Fire Recovery Mapping (FRM) tutorial
Use case
The three services that constitute the Use Case 6 (Wildfires: mapping events, danger and recovery) can be triggered over a region of interest in the LAC and by defining a date from which the wildfire monitoring shall start.
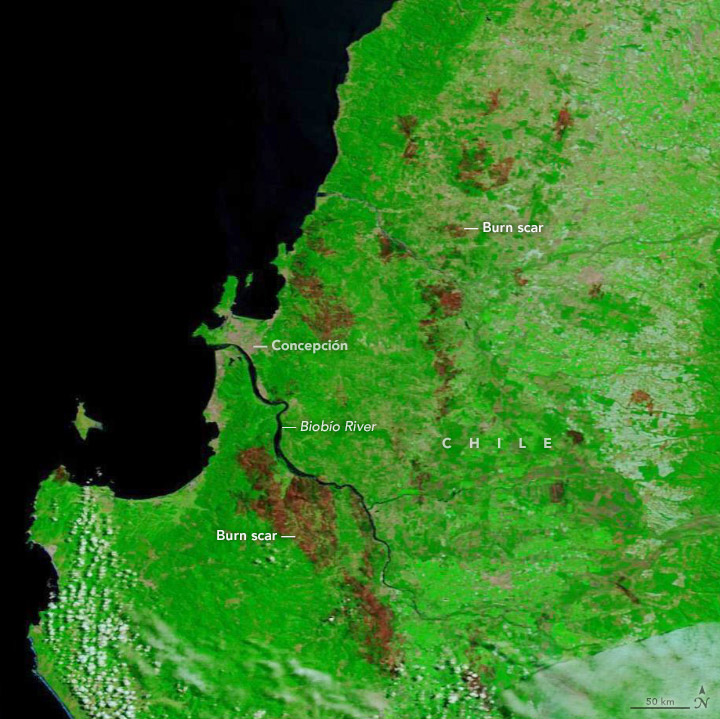
In this tutorial we take as example the case study of the large wildfire event that took place in central Chile in February 2023 (see article from the NASA Earth Observatory) and pre-executed the Fire Recovery Mapping (FRM) service to simulate the whole event in all its stages as if it had been a near-real-time monitoring. This tutorial aims to indicate a potential usage of the FRM service.
Getting familiar with the UI
Once inside the Wildfire Results Explorer of the CopernicusLAC Platform the user gets access to an essential and intuitive Graphic User Interface with a global map centered over the LAC region and with panels located on the right and on the left.
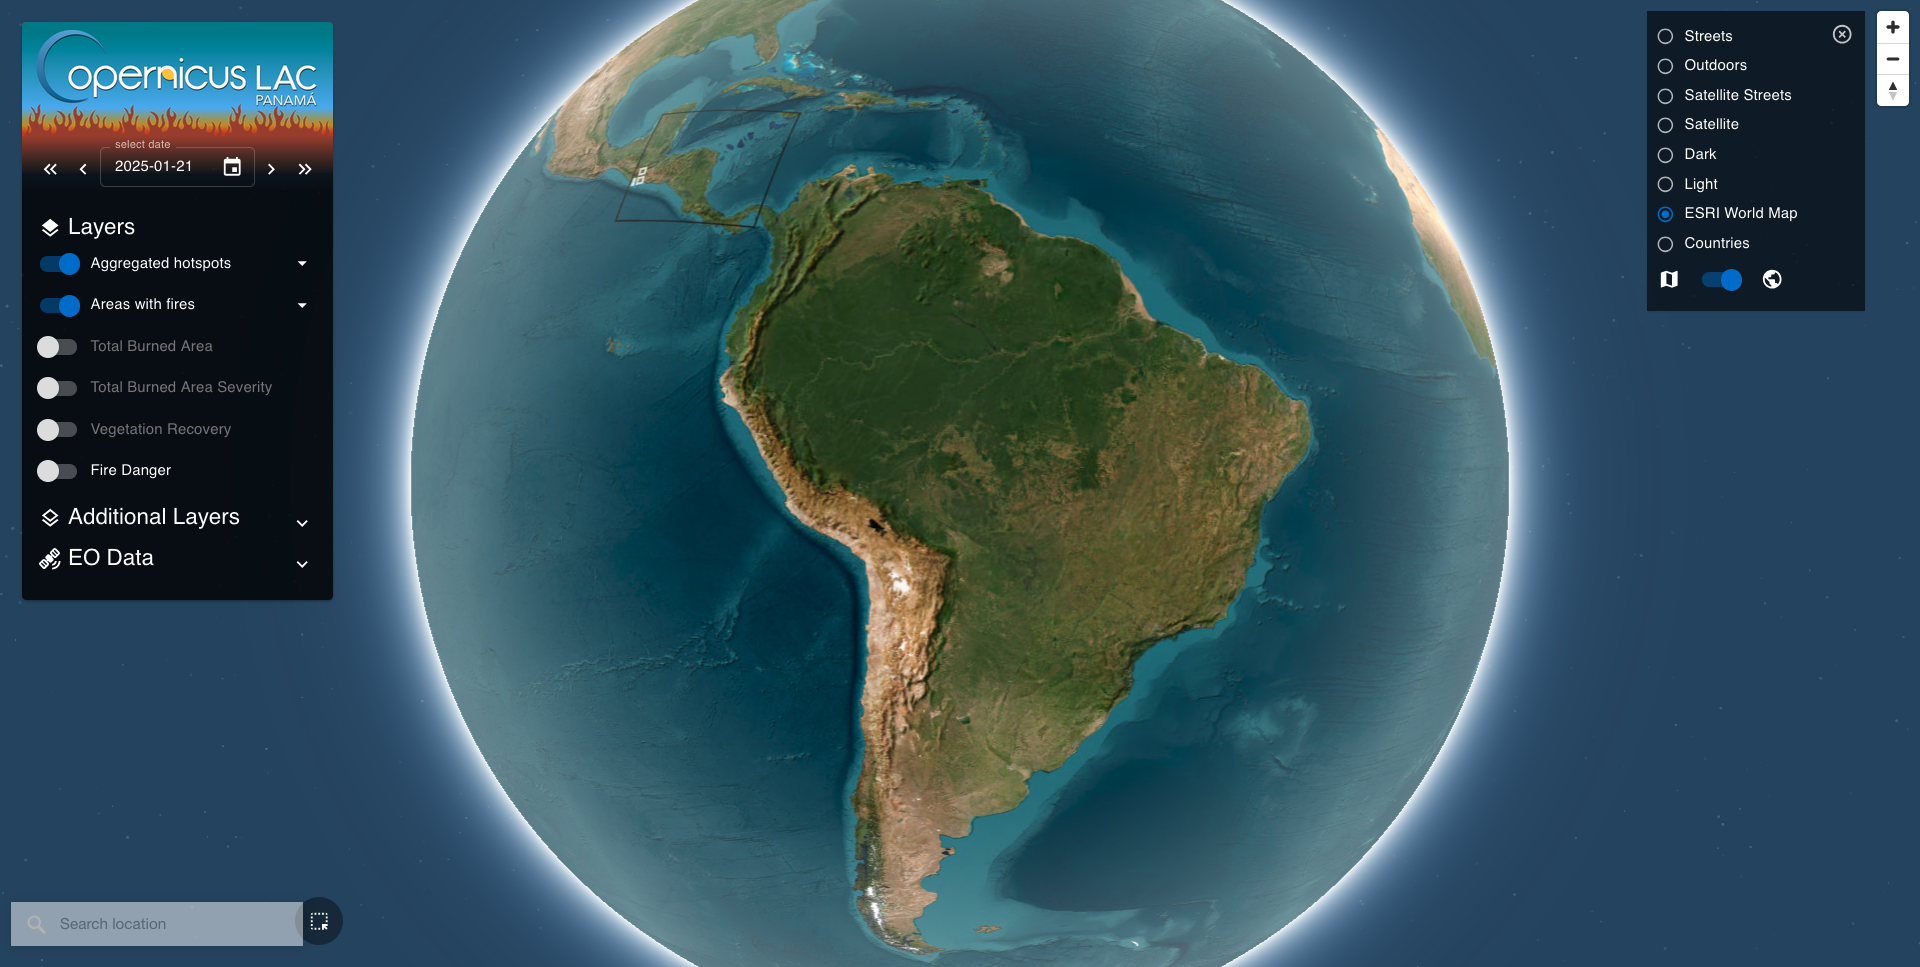
The left panel provides a Date Selector and a Layer List to be activated and shown on the map. Below is also available a Location Search widget that can be used to find a location of interest. On the right is located the Basemap and navigation panel where the user can change the base layer, switch between 3D and 2D views of the map, and find the Navigation control buttons.
Hint
Find more information about the Wildfire Results Explorer user interface here
Basemap Control Panel and Navigation Buttons
To navigate into the Wildfire Results Explorer the user can employ the Map Navigation buttons available in the Navigation Panel which is located in the upper right corner of the map. Alternatively, the user can also pan, zoom-in/out, rotate and tilt the 3D view also by using classical left click and mousewheel.
Hint
Find more information about the navigation controls of the Wildfire Results Explorer here
The 3D view is enabled by default in the Wildfire Results Explorer. To change to a plane view of the map click on the dedicated button located in the Basemap control panel.
Hint
The Basemap control panel is closed by default. To expand it click on 3 lines icon located next to the Map Navigation buttons
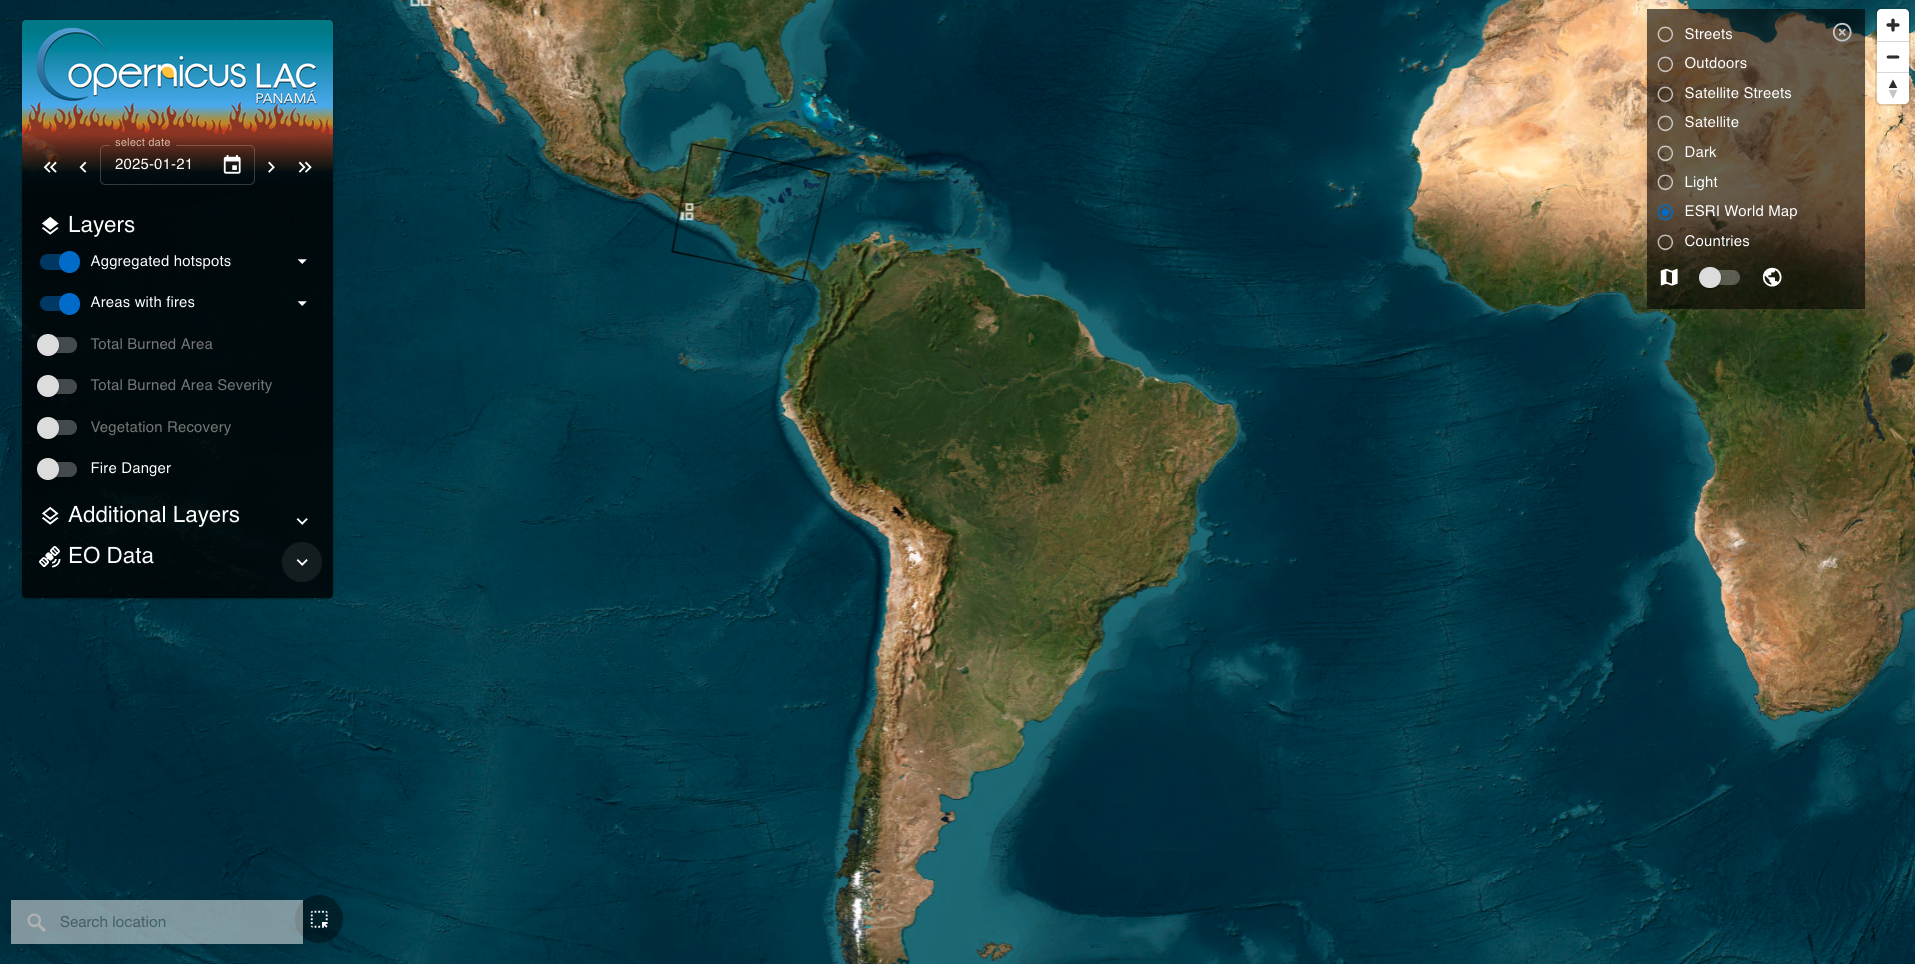
Try to switch among the 3D and 2D view of the map. The below image shows an example of the 2D view of the map.
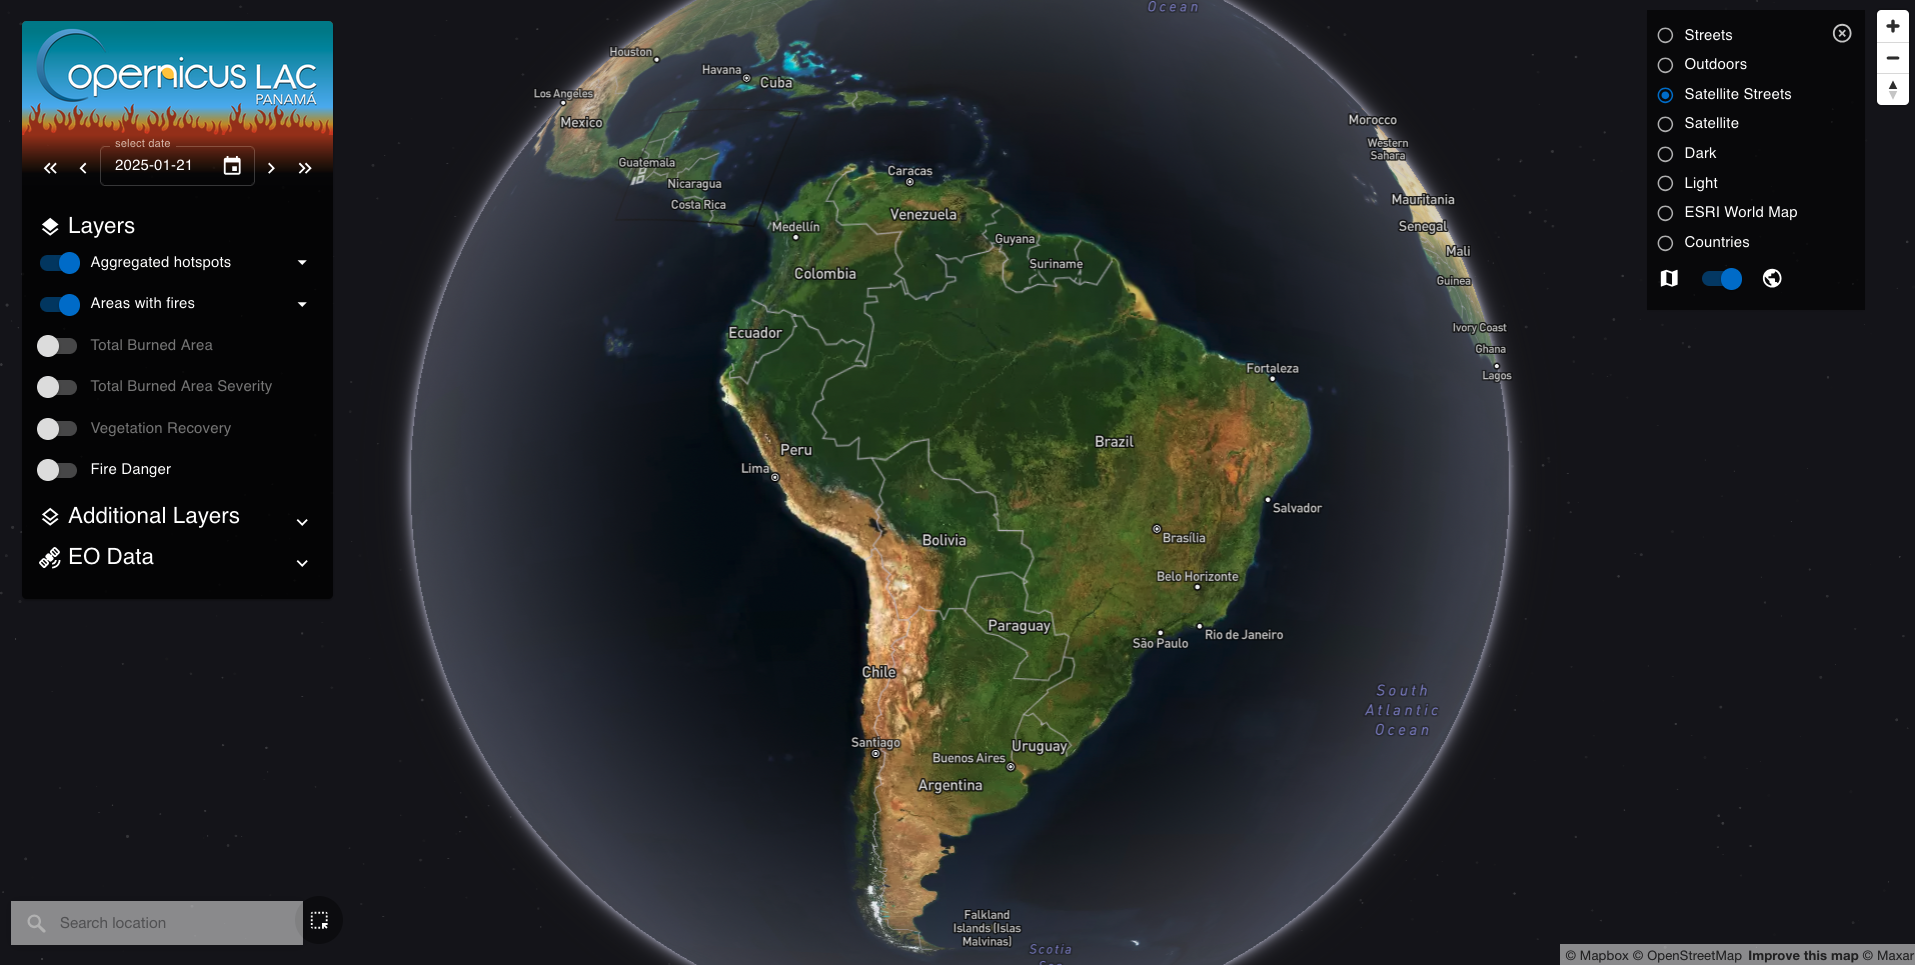
The user can also change the default basemap by selecting another one from the list available in the Basemap Control Panel. Get back to the 3D view of the map and switch the default baselayer, the ESRI World Map baselayer, with another one such as the Satellite street one. The map will appear as in the below image.
Layers
In the Wildfire Results Explorer layers are grouped into: Layers, Additional Layers and EO data. The Fire Recovery products can be seen on the map by activating the dedicated layers under the Layer list.
-
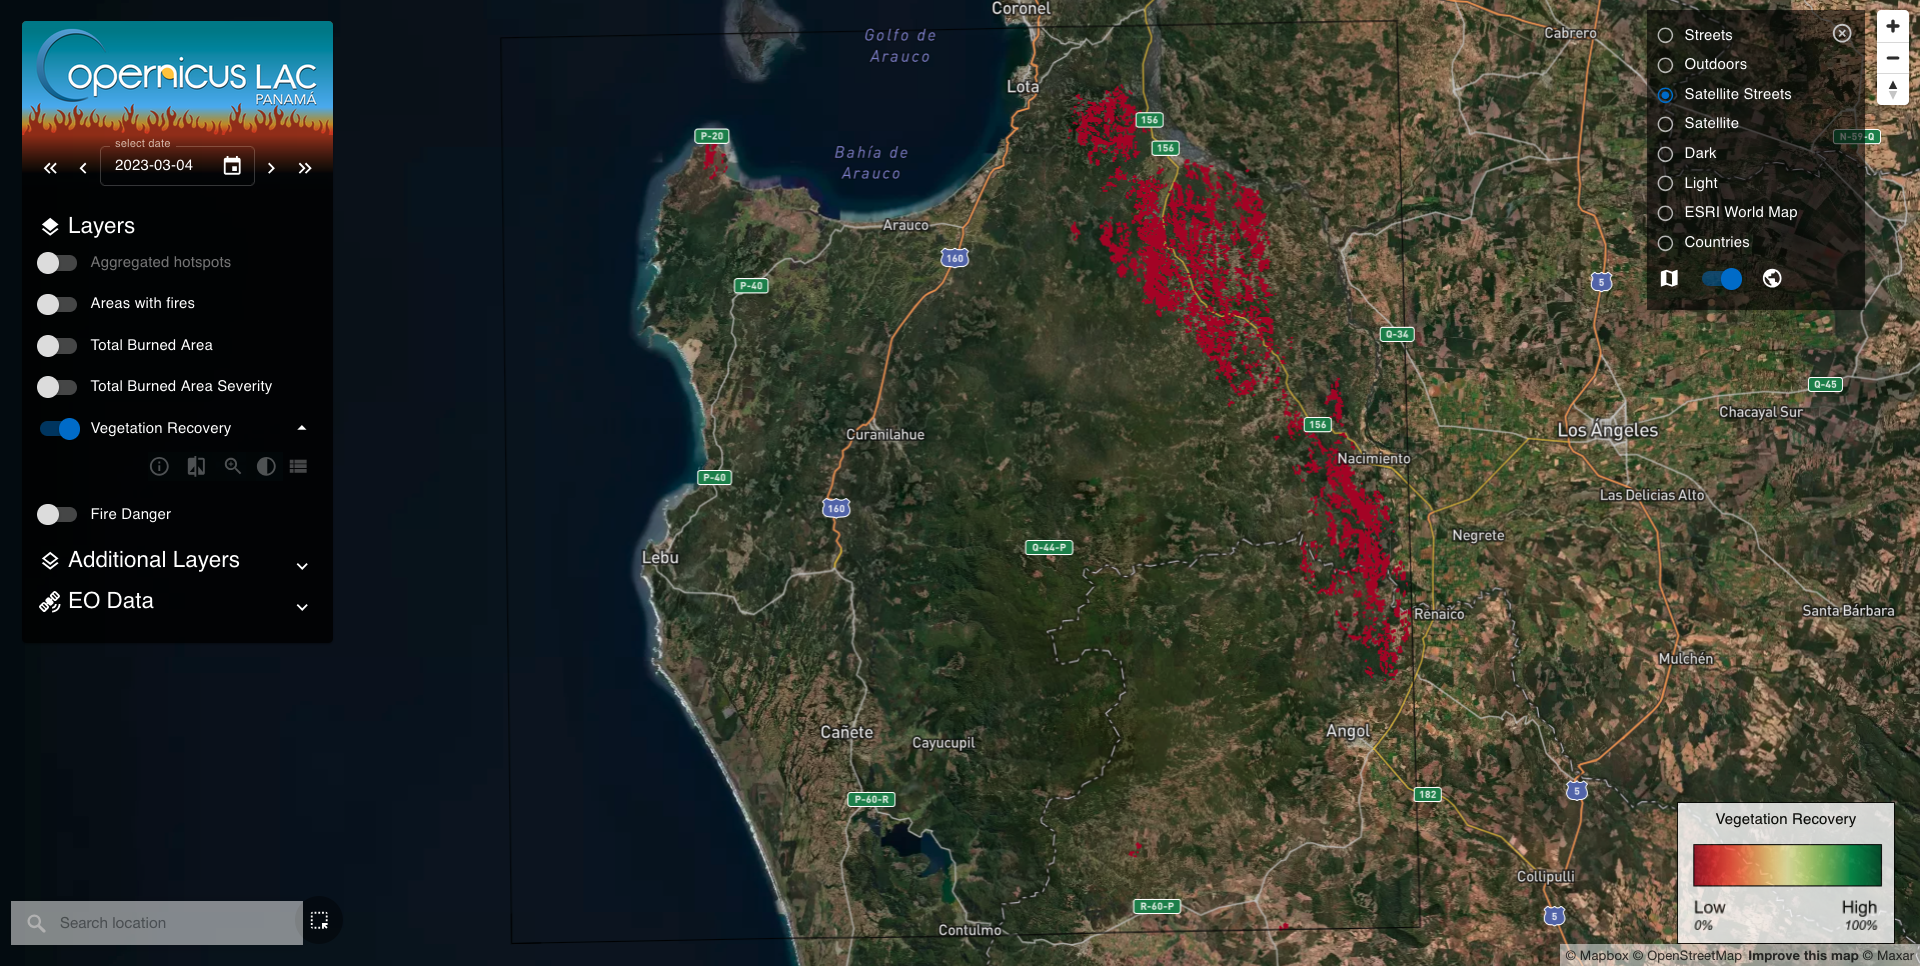
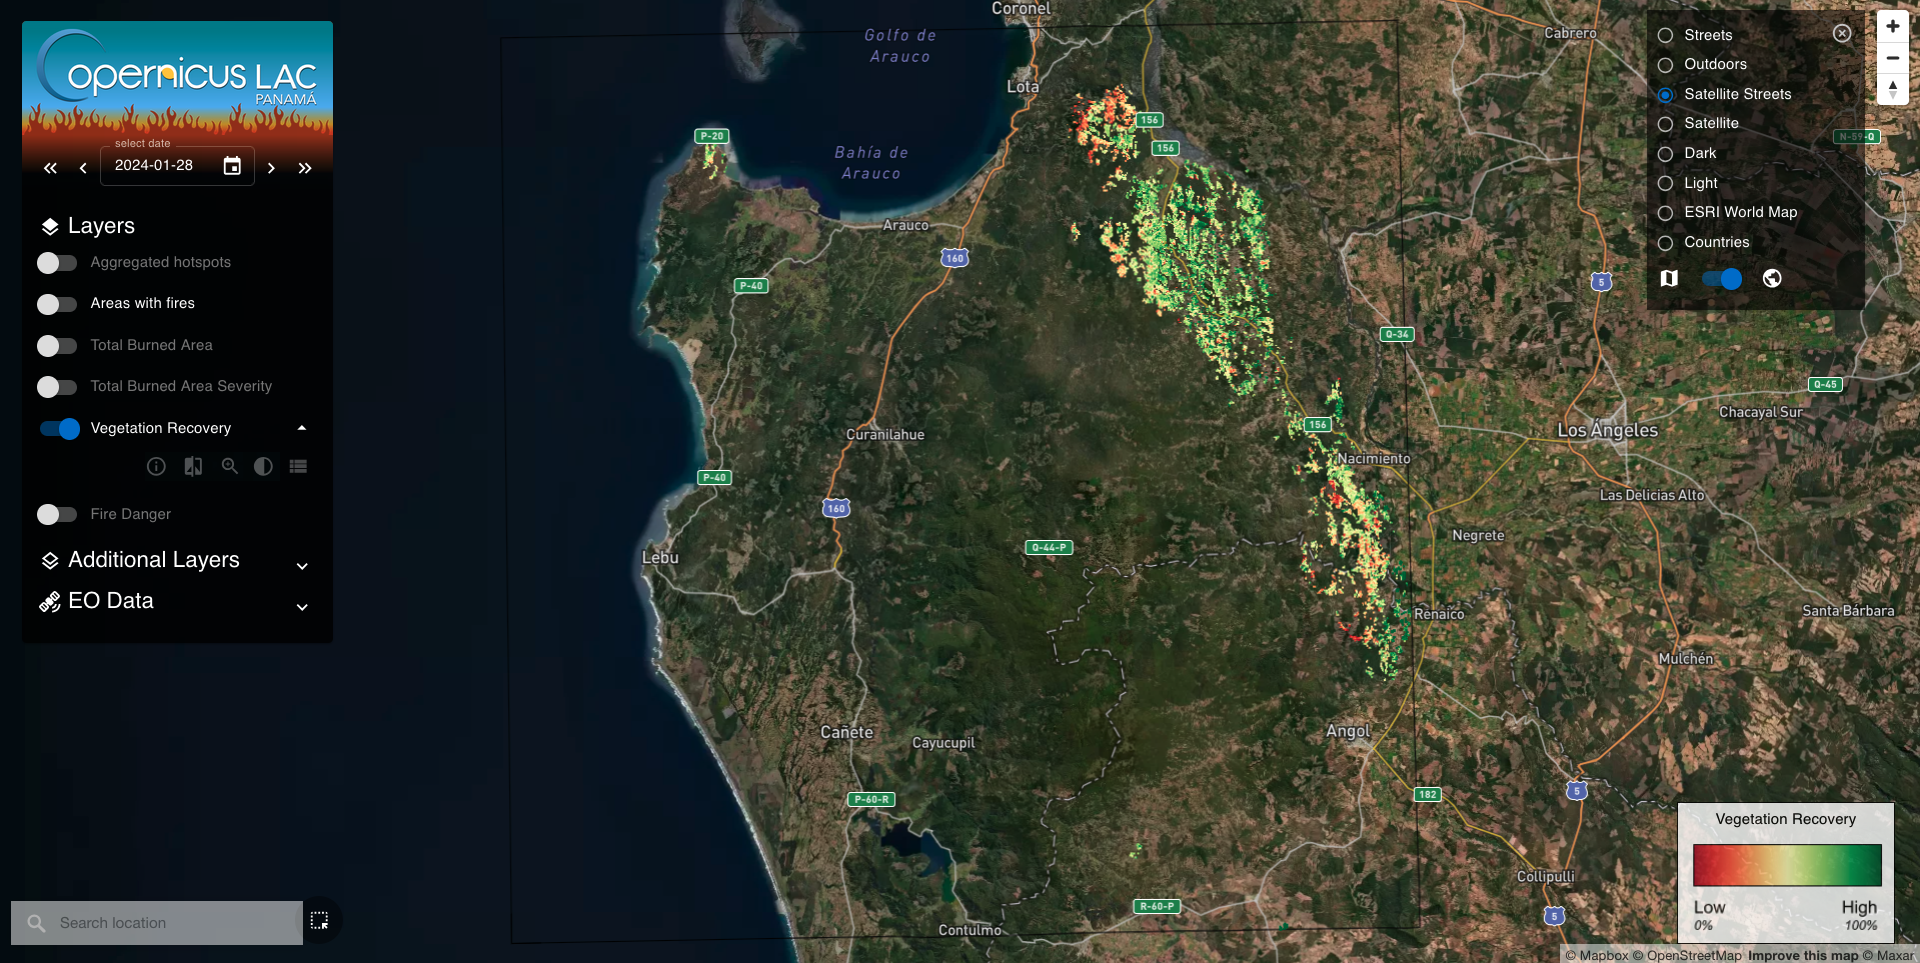
15-day vegetation recovery maps: the Vegetation recovery layer shows the percentage of vegetation recovery as a continuous variable ranging from 0% to 100%. Areas are color-coded to reflect the degree of recovery from red (low) to green (high).
-
15-day NDVI maps: the NDVI additional layer shows 15-day Normalized Difference Vegetation Index (NDVI) composites derived from Sentinel-2 L2A data acquired after active hotspots have ceased.
In addition to that the user can also visualize true/false color composites or single band visual products, derived from multispectral or thermal calibrated EO data from the Sentinel-2 and Sentinel-3 missions, by activating one of the layers under the EO data group.
Find here a description of all other layers available in the Wildfire Results Explorer user interface.
Interact with layers
To show or hide a layer in the map you can click on the circular button located next to the layer title on the left.
The user can interact with the layers by using the Layer buttons: Info about the layer, Pan/Zoom, Set opacity, and Item list.
Concerning the layer order visualization, the last activated layer will be the top layer in the visualization of multiple layers in the map.
In the Wildfire Results Explorer it is possible to visualize in the Vegetation Recovery map derived from the FRM service. The map will automatically show all the items included in the layer for the current date. Once the layer is activated the platform shows the FRM legend in the bottom right corner of the map.
To get more information about the items contained into a layer see:
-
the Item list panel,
-
the Item details panel,
-
and the Clicked items dialog.
Warning
When no items are available (e.g. no products are available for the selected date or area of interest) the layer title is instead shown in gray.
Temporal search
The Wildfire Results Explorer shows in the map EO data products as layers for a selected date. To select the date you shall employ the Date selector available in the Layers panel on the top left corner of the interface. After a selection the platform automatically does for each layer a search of items that are made available under that date.
Let's use the Date selector to change the current date with another one in the past such as the 4 March 2023 (almost a month after the large Chile 2023 wildfire). You can either use the buttons available on the left of the selected date or by clicking on the calendar icon. After the change of the date the interface will show the following result.
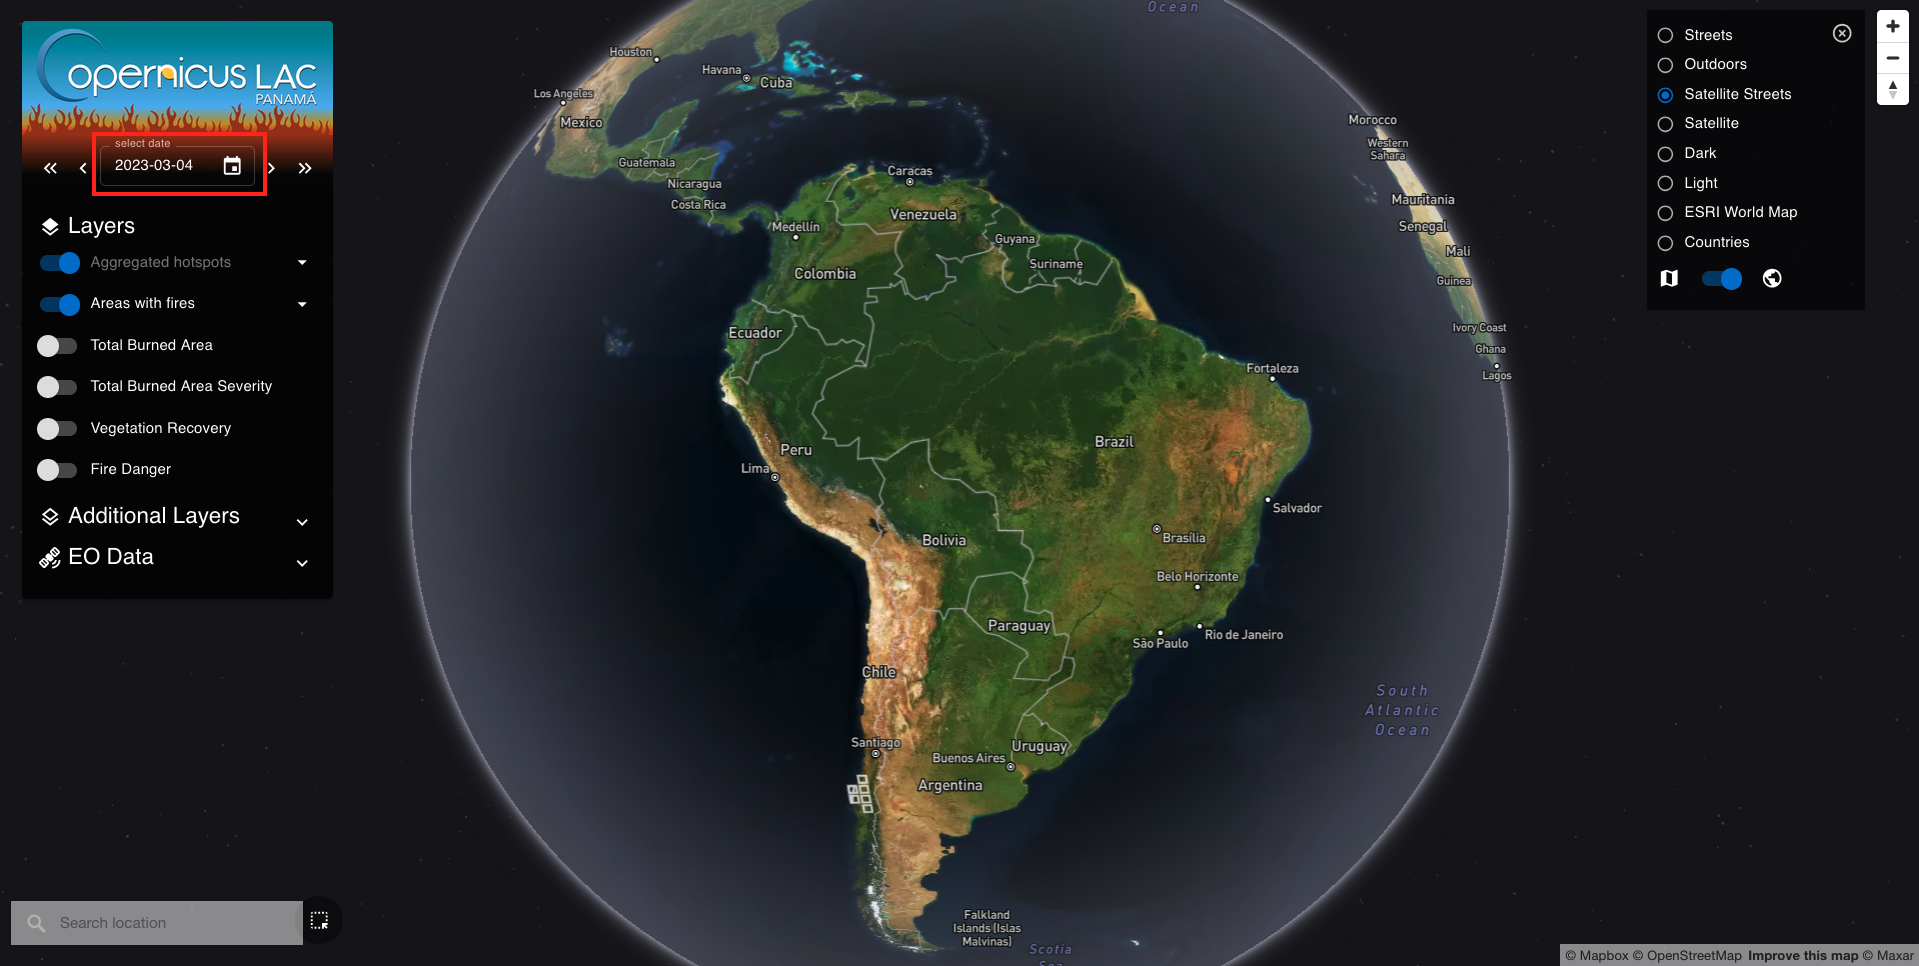
Turn off the Aggregated Hotspots and Areas with fires layers and click on the Pan/Zoom layer button to automatically center the map view over the available item in the Vegetation Recovery layer.
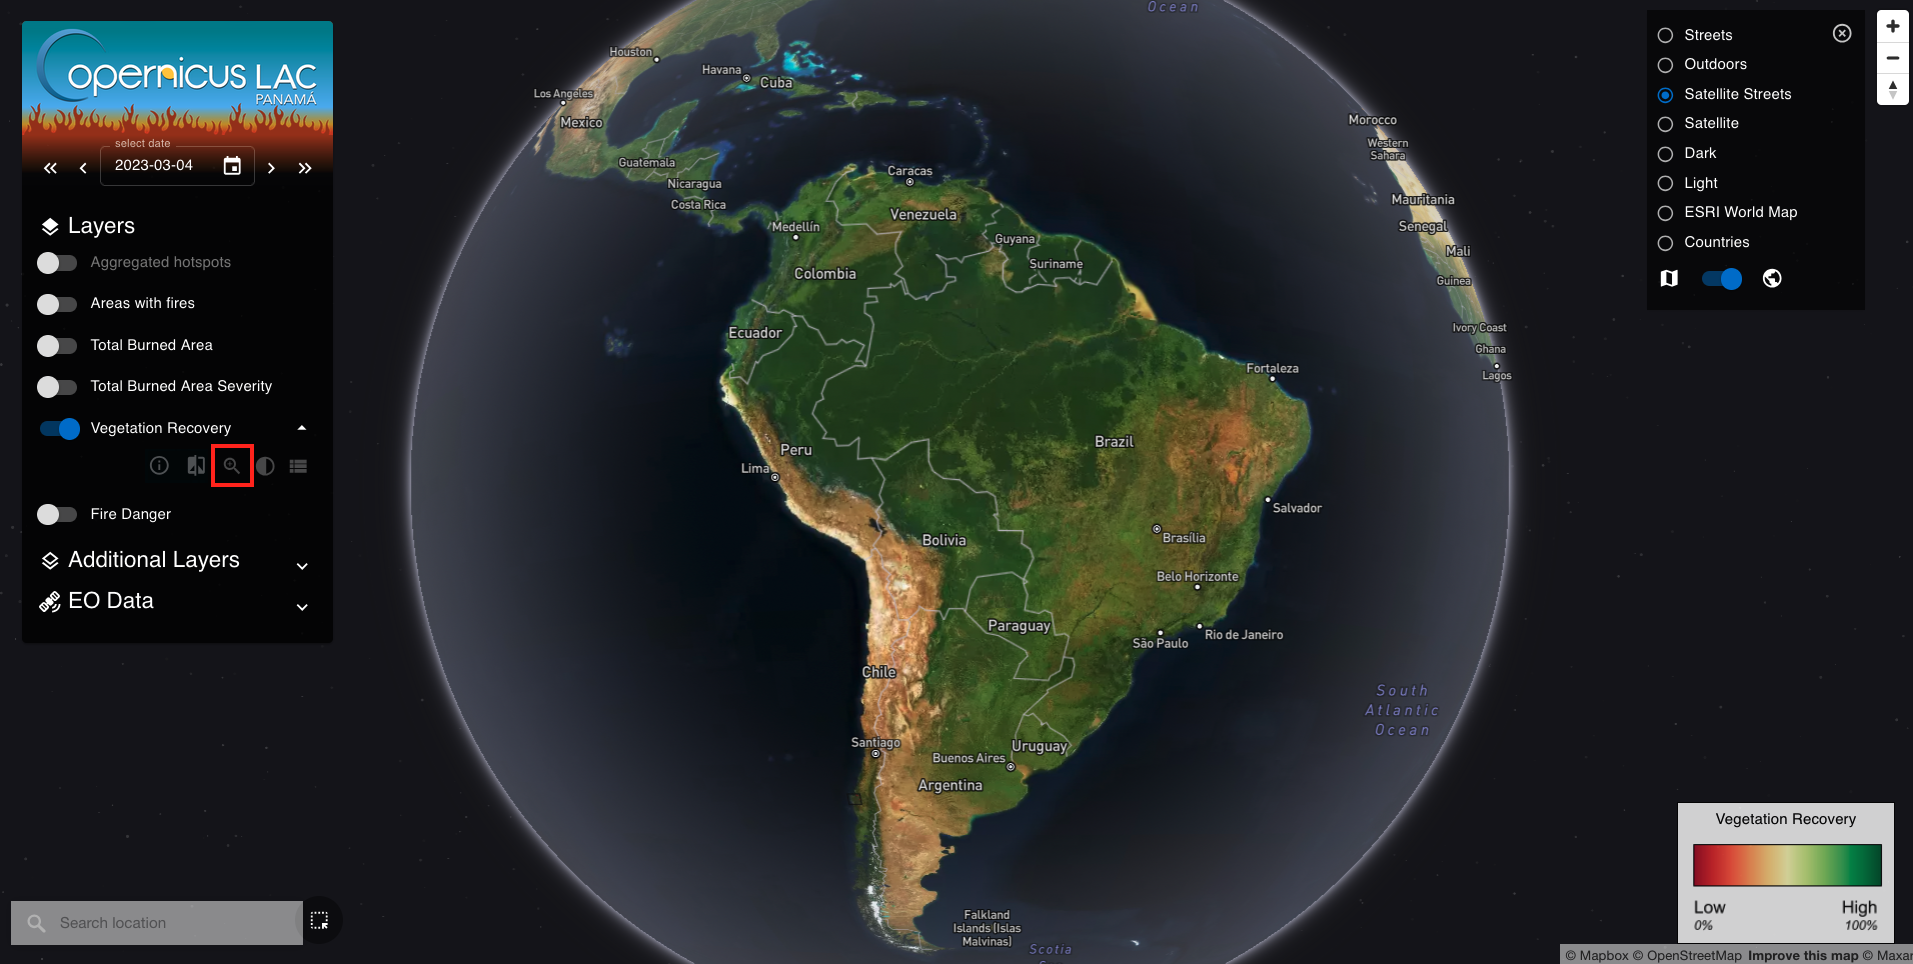
After that the following product will be shown in the map.
Warning
By design the first Vegetation Recovery map shows all pixels having a 0% of recovery (initialization of the algorithm at the first iteration). You should wait for another 15 days to get the first useful result. Meaningful FRM maps are from the 2nd iteration forward.
Spatial search
To zoom to another area of interest you can employ the Search Location widget located in the bottom left corner of the map or the BBOX selector.
Find and visualize EO products
Let’s keep inspecting the Vegetation Recovery layer showing a 15-day vegetation recovery map over this area of Chile. To do this you shall change date from the date selector to visualize all the following 15-day products generated over the area to see the values of the vegetation recovery across the time. Select another date: the 3 May 2023 using the calendar button.
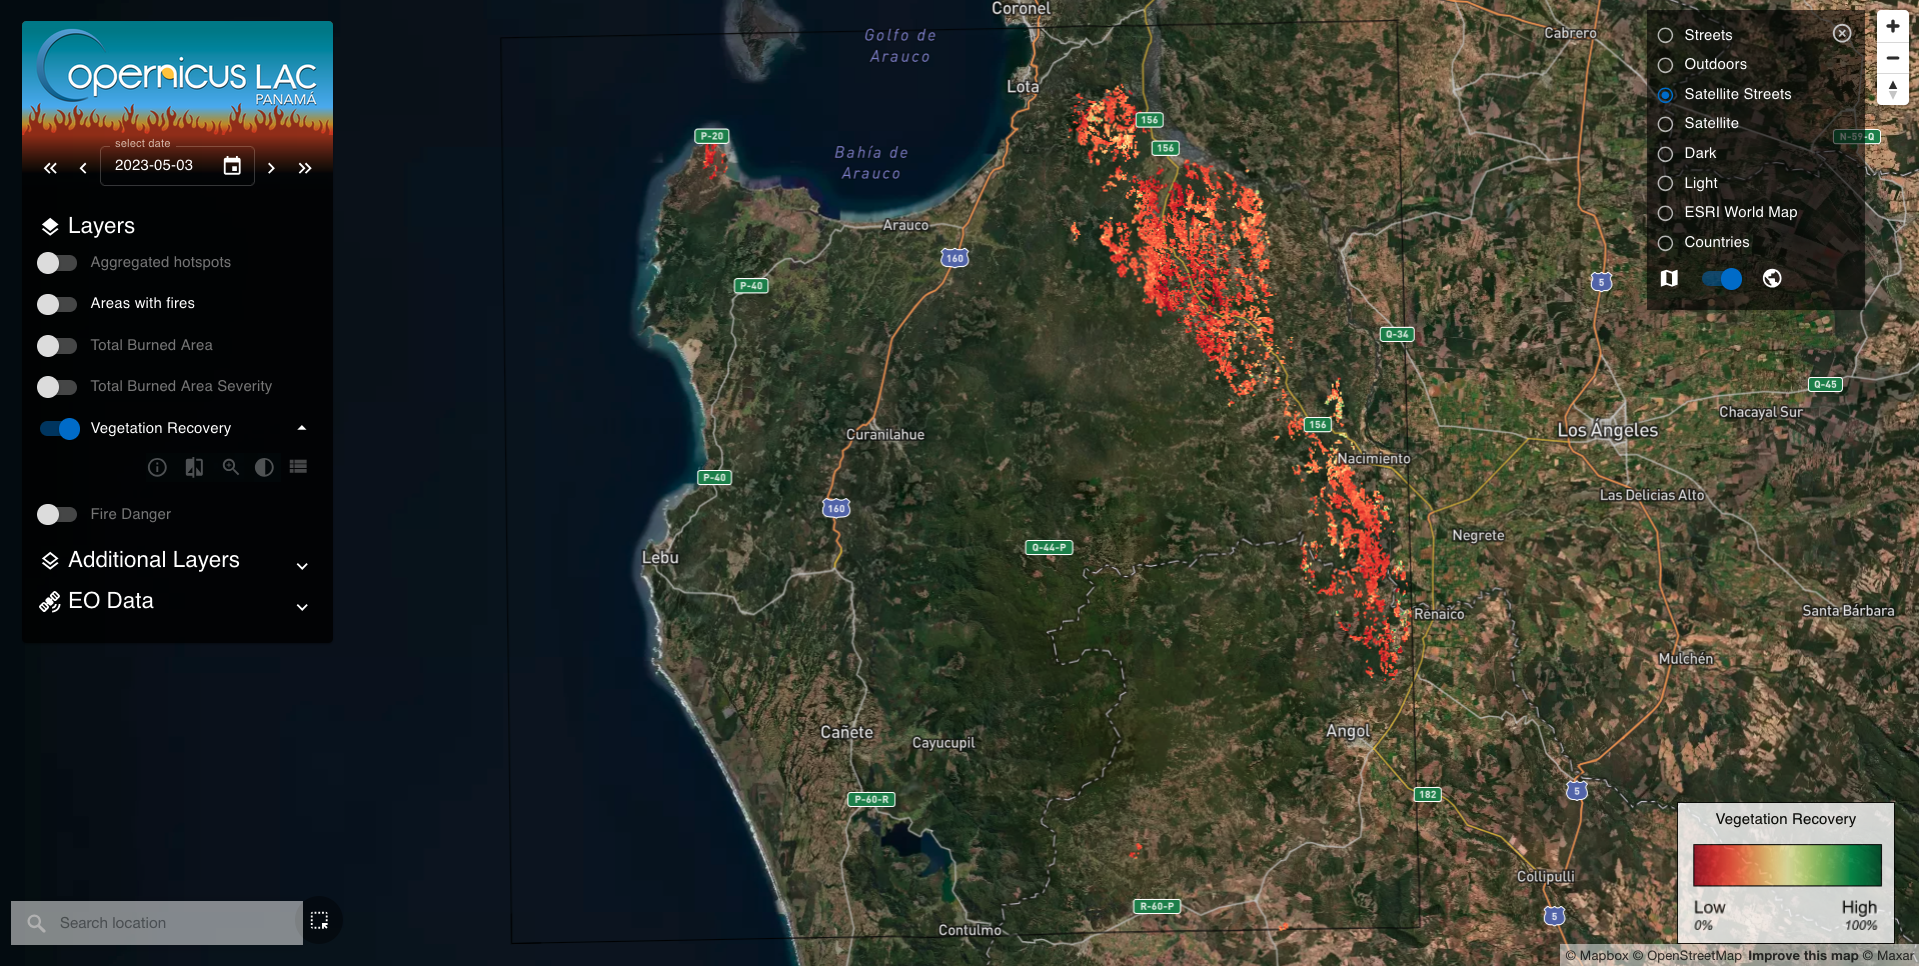
To better interpret the vegetation recovery full resolution visual product, you can check the legend appearing in the bottom right corner of the map.

Note
Find more information about the Vegetation recovery layer here
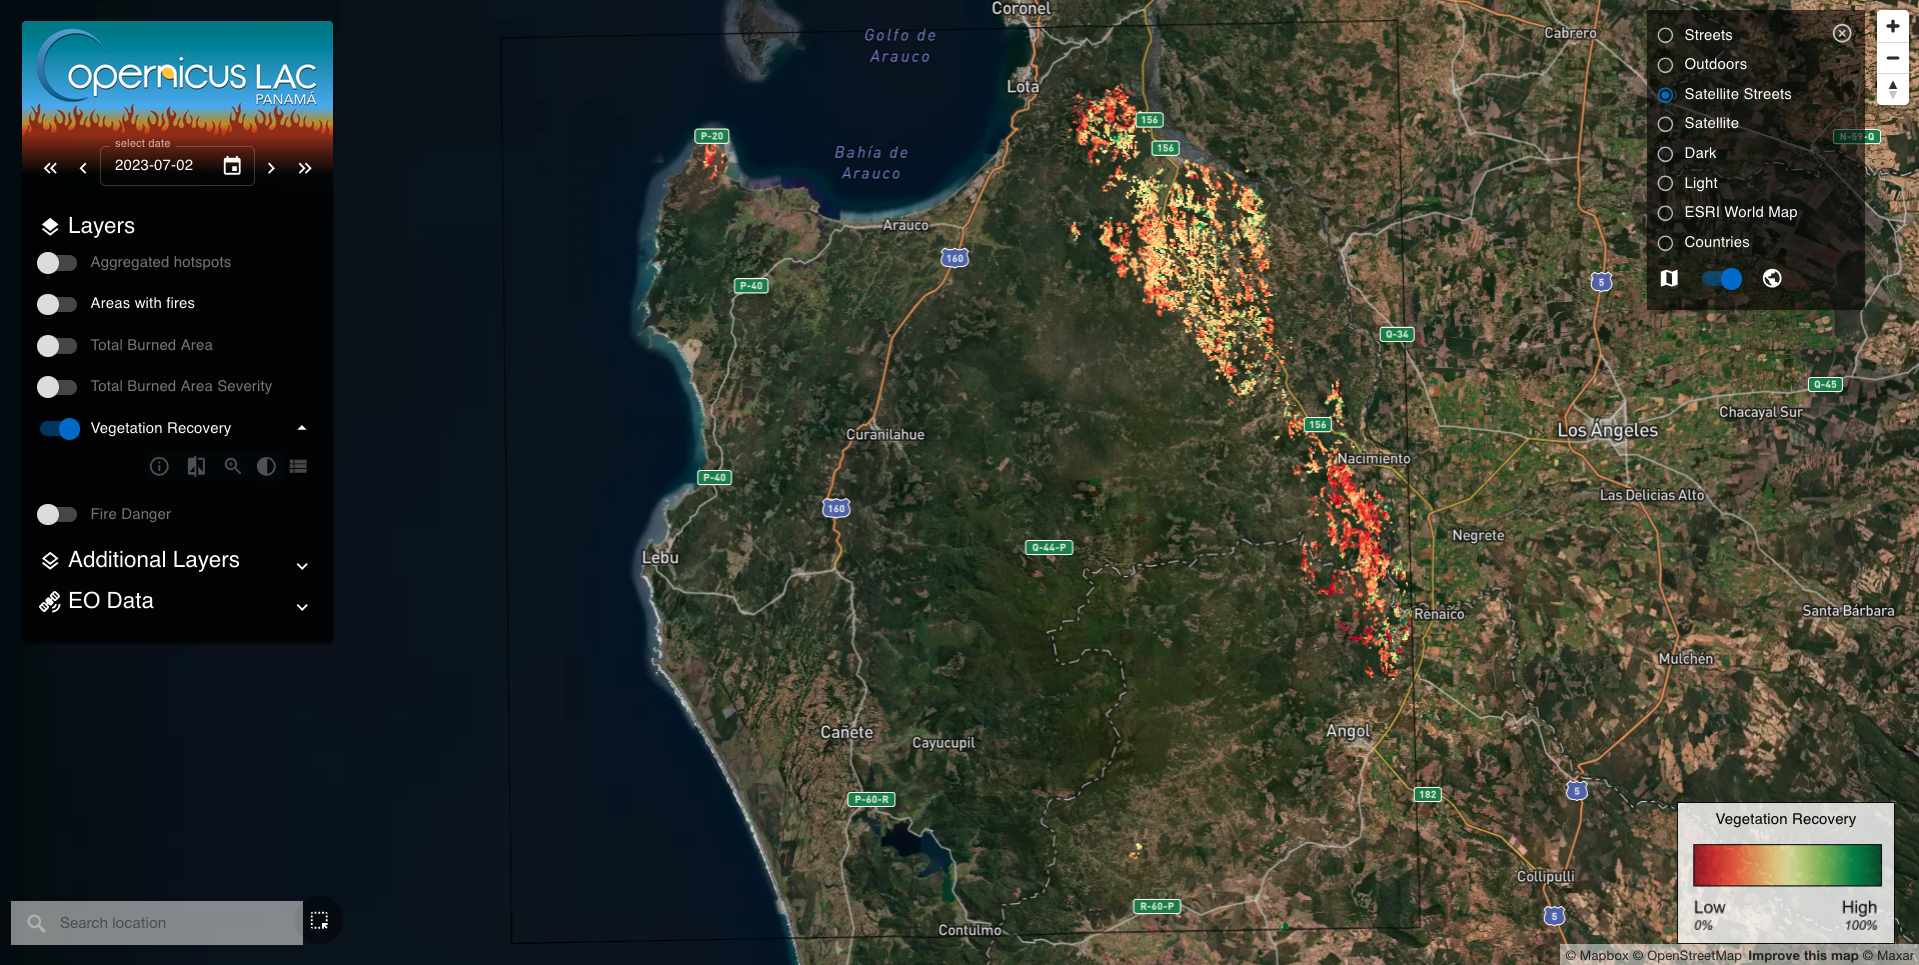
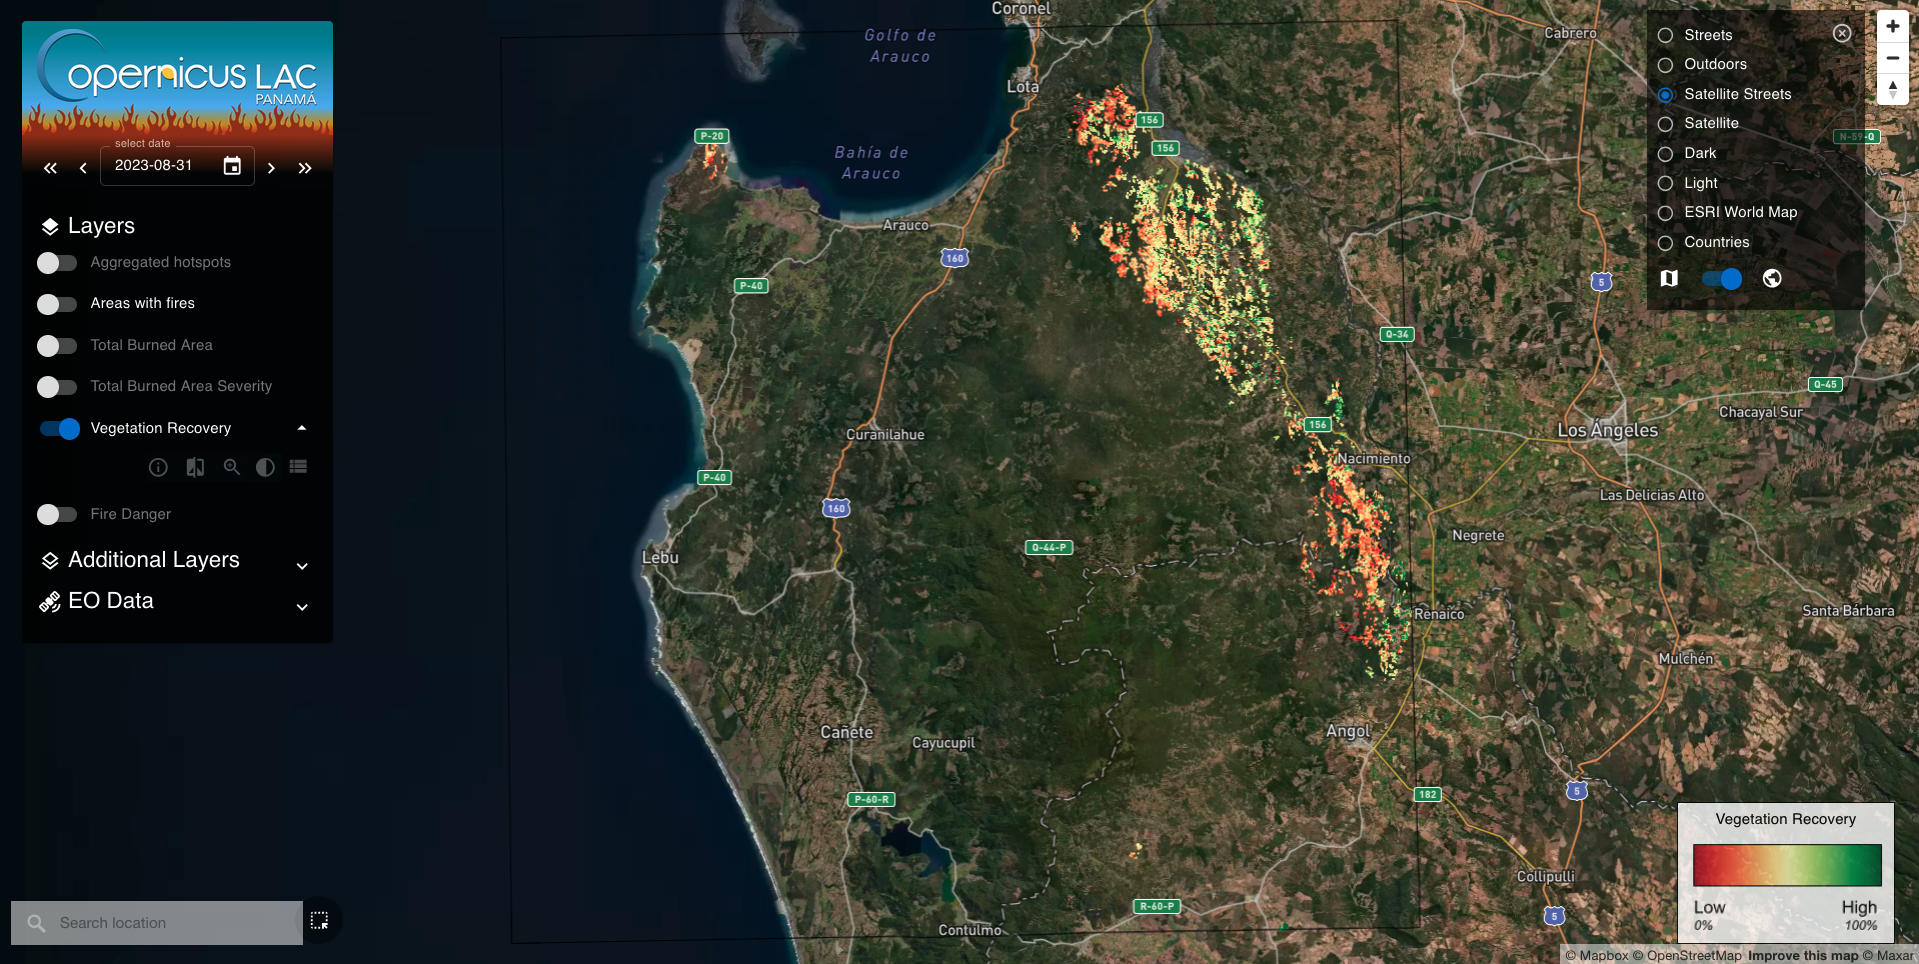
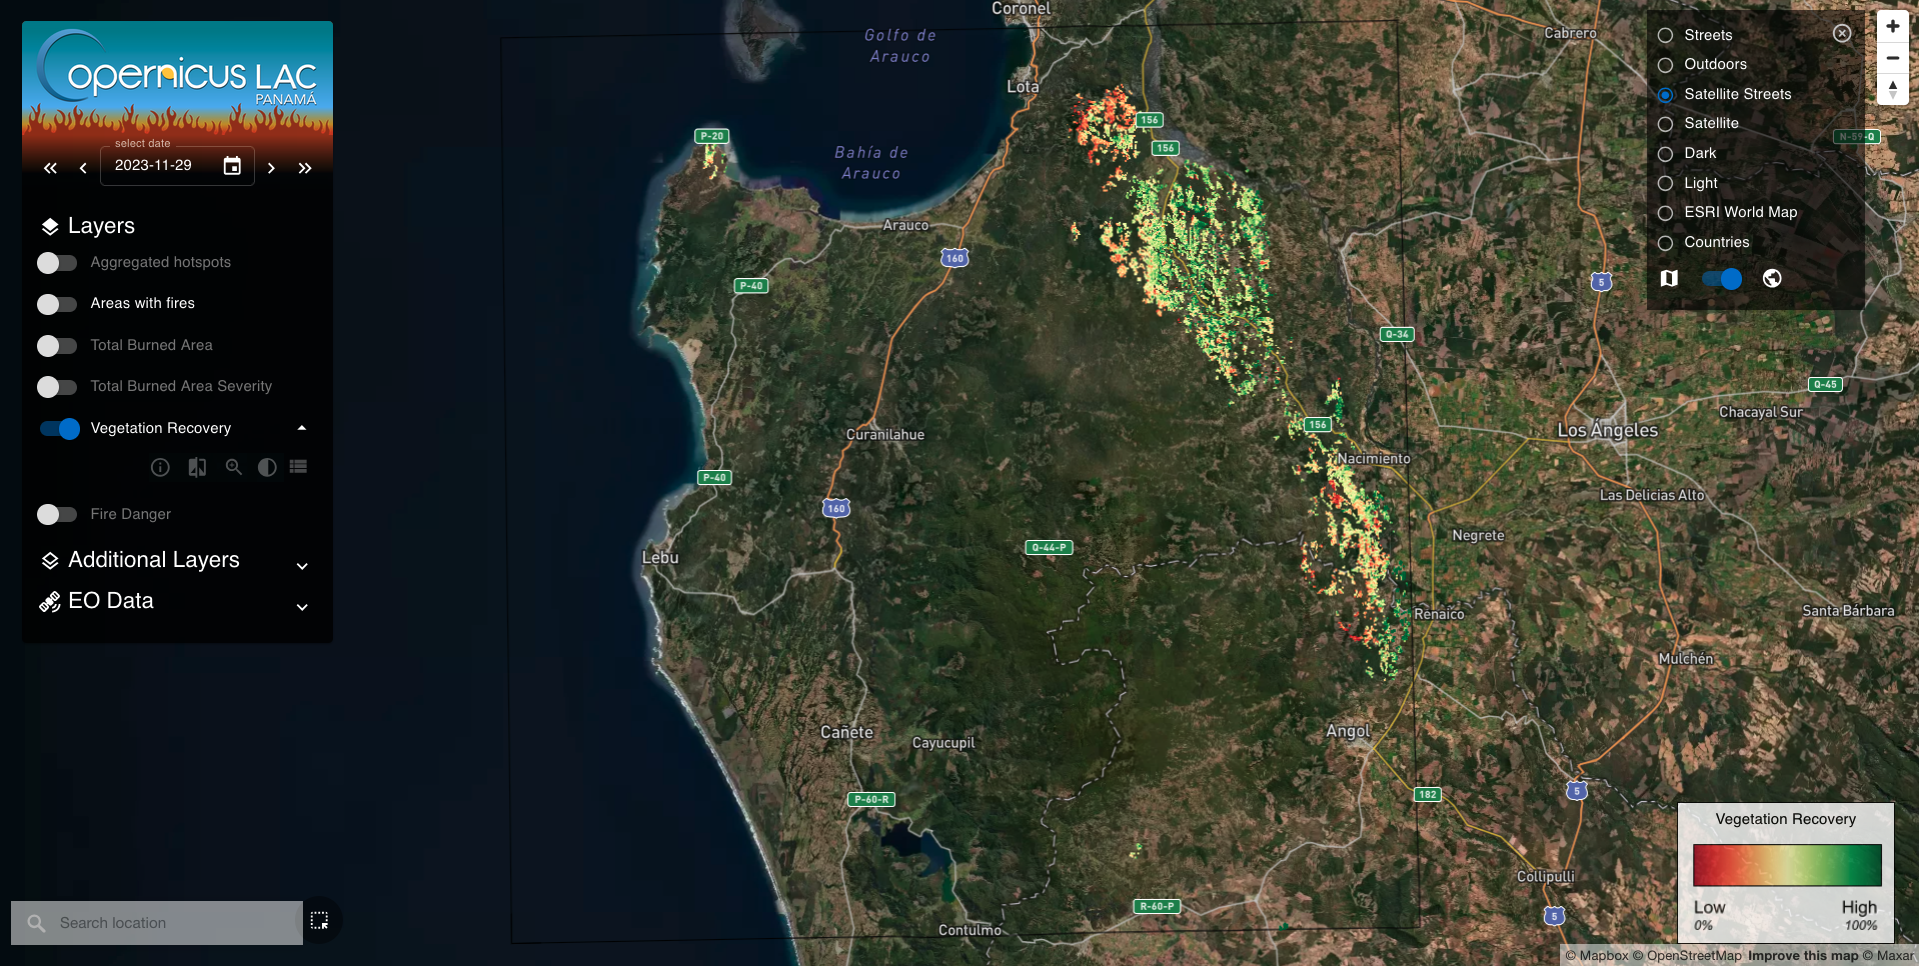
From the Select date functionality of the Date selector, change the date to all the following 15-days products generated over the area to see the values of the vegetation recovery across the time.
Below images show the results for a selection of these products.
Exercise
Check out over the same dates also the 15-days NDVI composites available under the additional layer NDVI
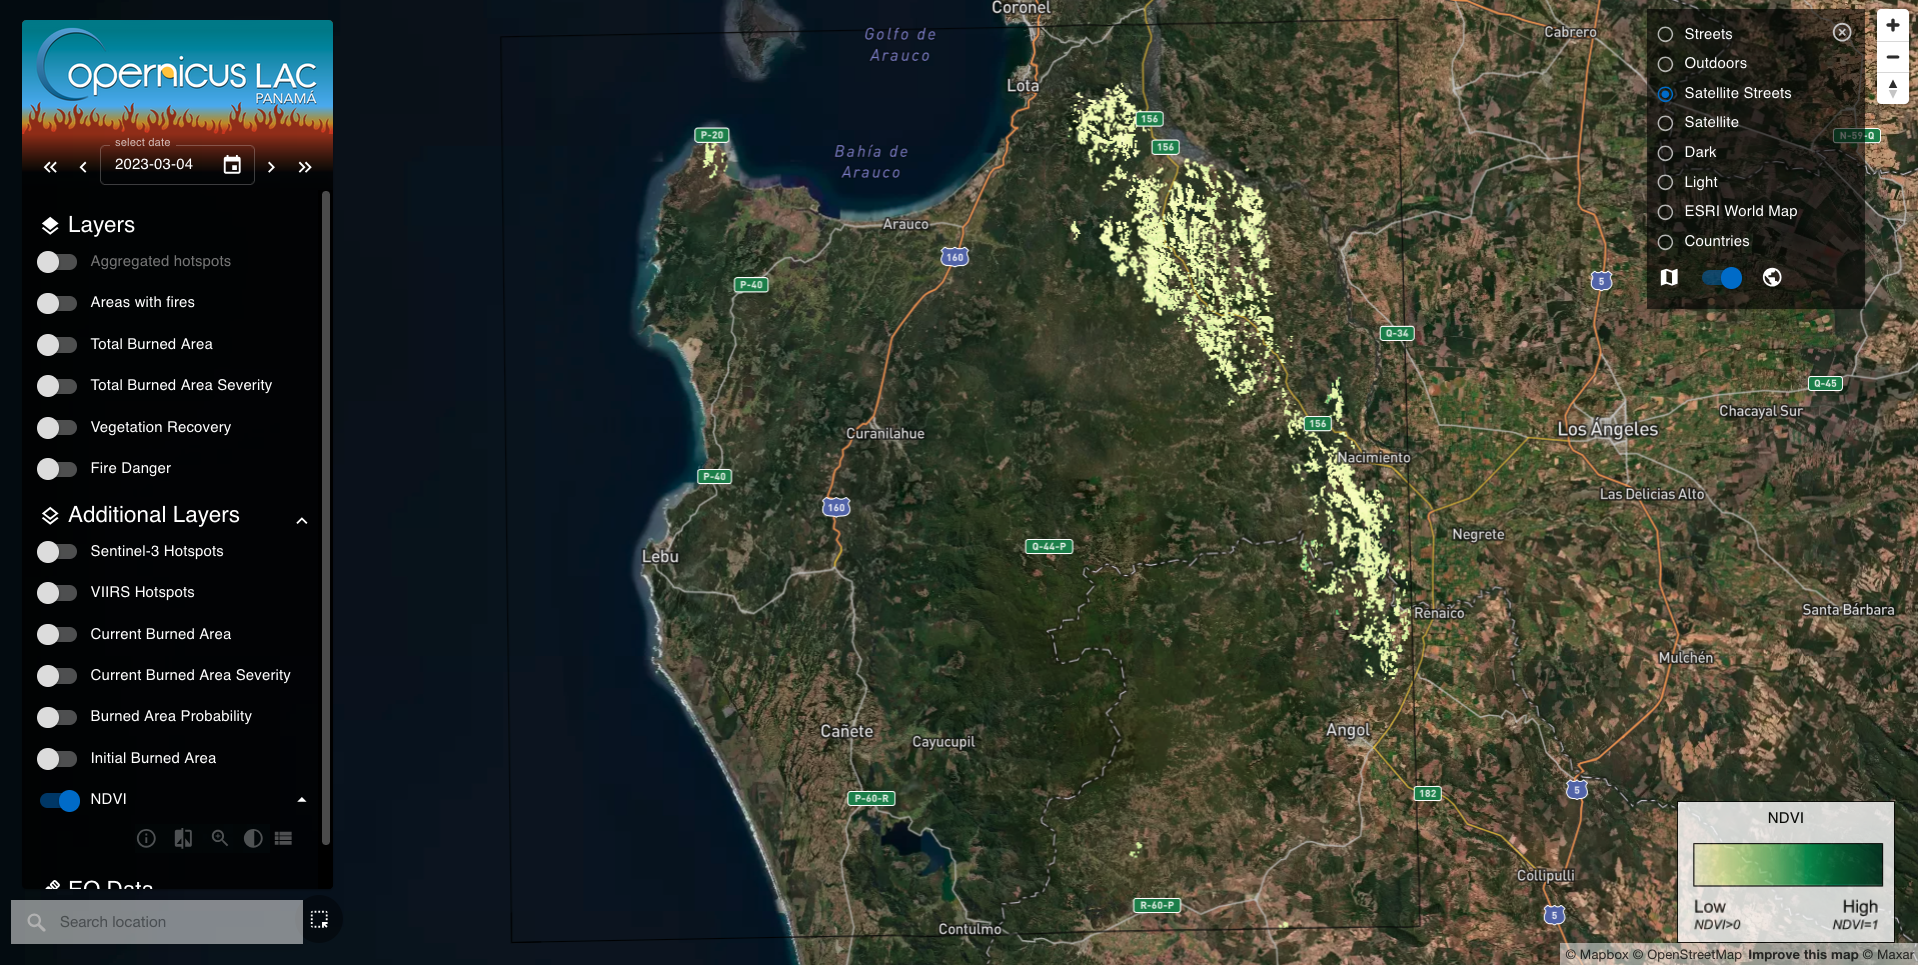
To better interpret the vegetation recovery full resolution visual product, you can check the legend appearing in the bottom right corner of the map.

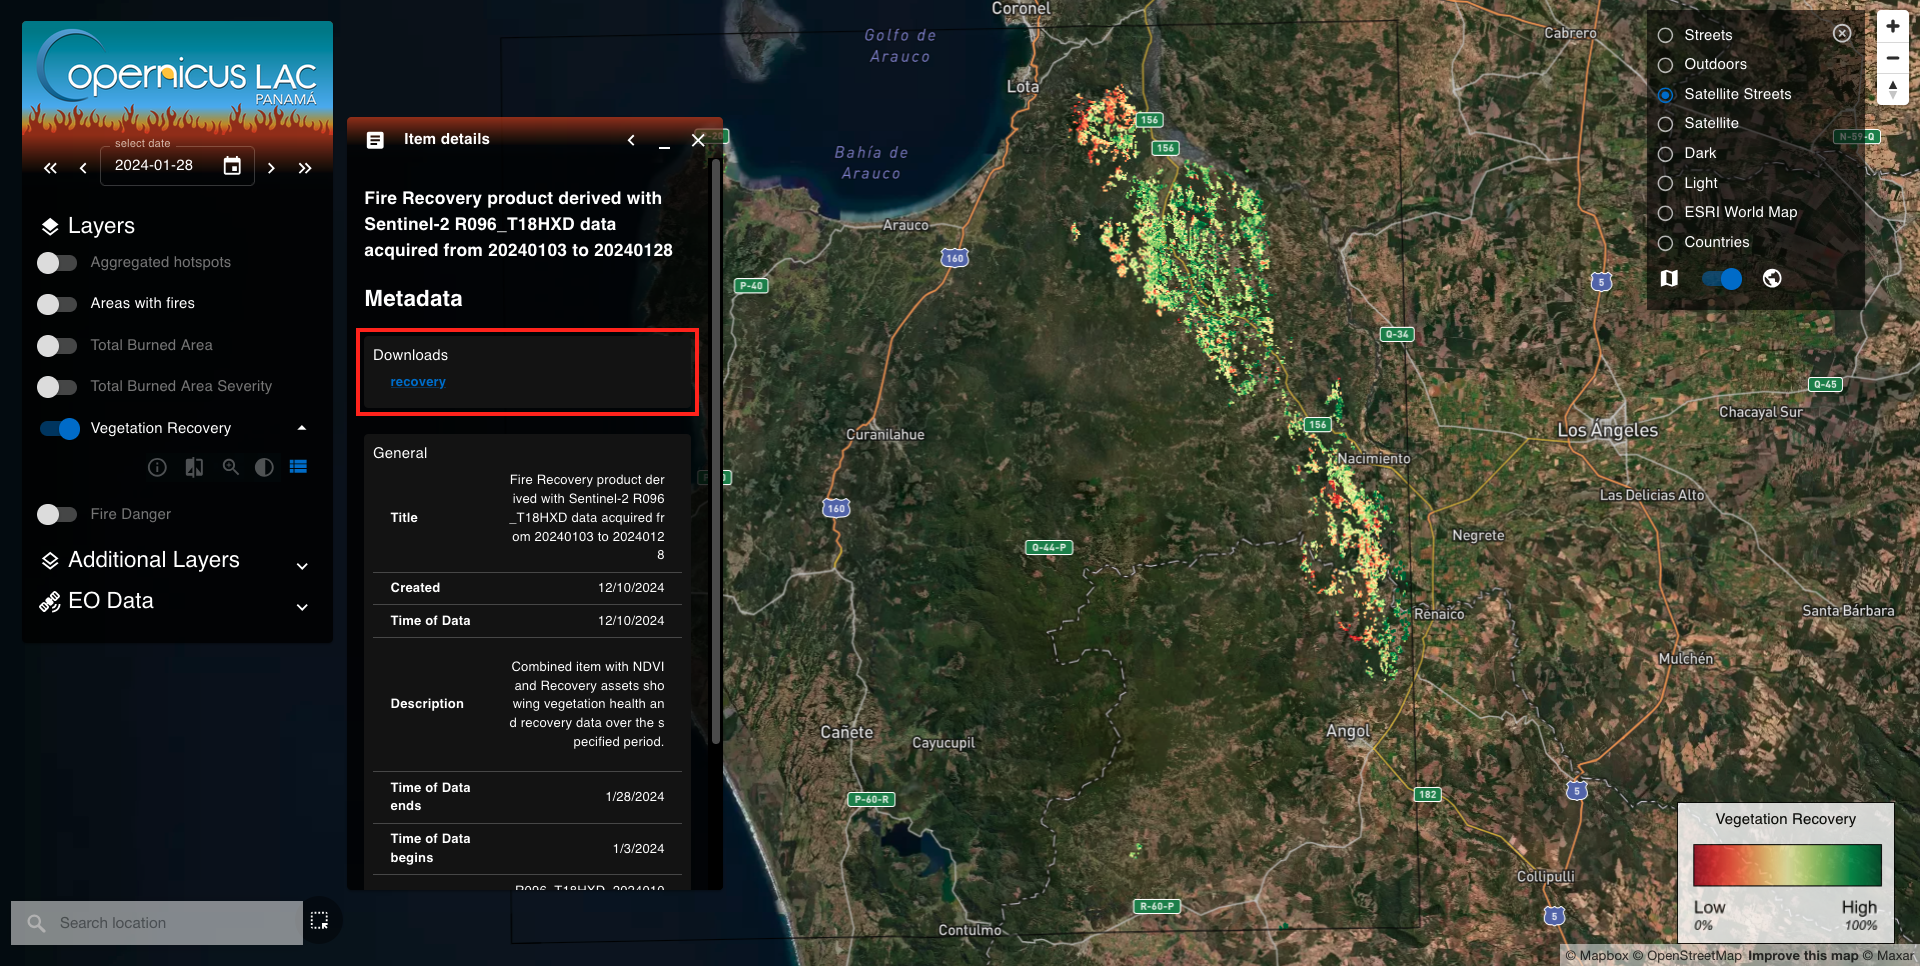
Download the EO products
To access the Item list panel and find all the items available for the Vegetation Recovery layer click on the Item List from the available layer buttons.
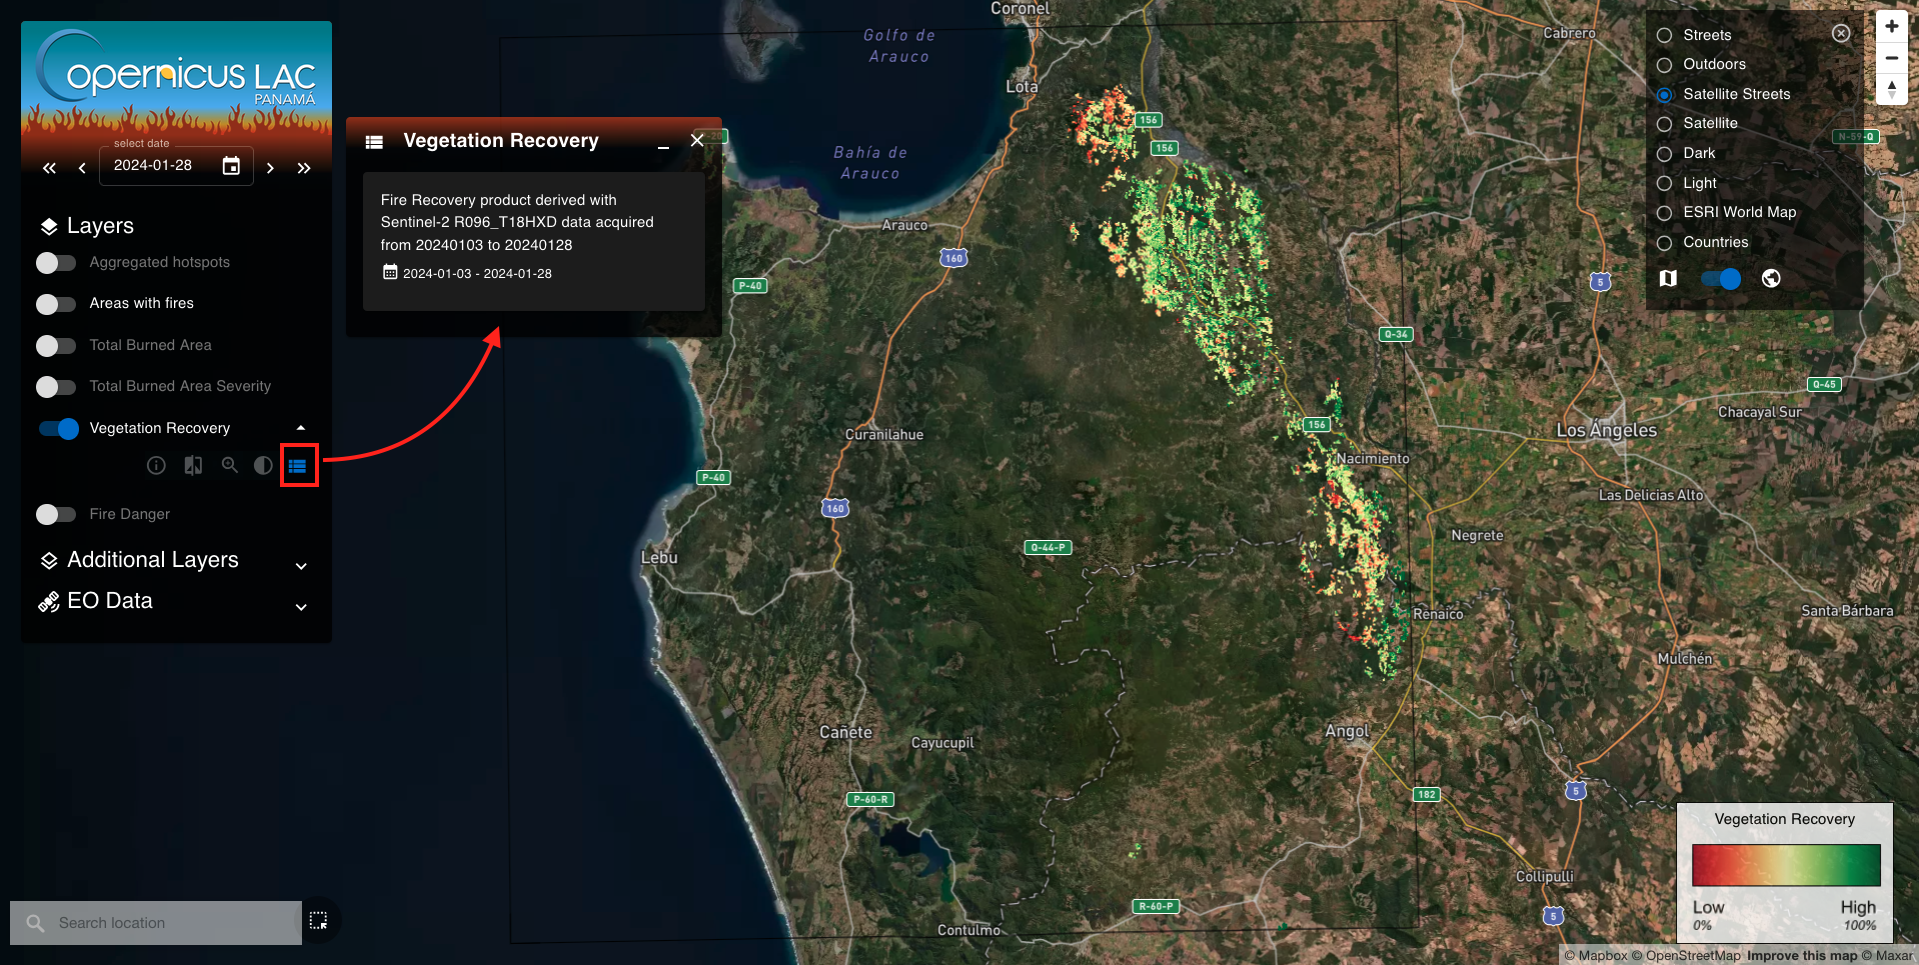
To download the FRM single band asset, click on one of the items in the list and then from the Item details panel click on the available hyperlink under the section Downloads of the metadata.