Layers of the Wildfire Results Explorer
This section provides the list of all layers available in the Wildfires Explorer of the CopernicusLAC platform. These are organized into 3 groups:
-
Layers,
-
Additional Layers,
-
and EO data.
Layers
This first collection includes the layers providing primary information from the most important products of the processing chain.
Aggregated hotspots
Spatial aggregation of detected hotspots at 1km resolution derived from Sentinel-3 SLSTR RBT calibrated data. This layer is derived from a product of the Burned Area Mapping (BAM) service. It shows in red clusters of aggregated hotspots.
Areas with fires
This layer shows the portions of the land where the Burned Area Mapping (BAM) service is currently active to monitor a fire event. This layer is derived from a product of the Burned Area Mapping (BAM) service. The areas contained in this product correspond to Sentinel-2 image footprints intersecting aggregated Sentinel-3 SLSTR hotspots. This layer can be used to quickly identify the areas with active fires for which burned area products are or will be generated by the BAM.
Total Burned Area
Temporal aggregation of Burned Area Extent since the beginning of the event at 10m resolution derived from pre- and post-event Sentinel-2 L2A calibrated data. This layer is derived from a product of the Burned Area Mapping (BAM) service. Burned areas are derived using an adapted version of the FireCCISFD20 algorithm (Roteta et al, 2021) employing Mid-Infrared Burn Index (MIRBI), and Normalized Burned Ratio 2 (NBR2) indexes from Sentinel-2 and VIIRS S-NPP hotspots. This product is the synthesis of all burned area extent products derived by the BAM algorithm since the beginning of the wildfire monitoring. The Total Burned Area layer shows in red burned areas, in green burnable areas and in grey where no valid observations were available to run the algorithm. The legend is shown in the bottom right corner of the map.
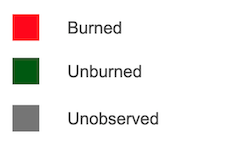
The legend of the Total Burned Area layer is shown in the bottom right corner of the map.
Total Burned Area Severity
Temporal aggregation of Burned Area Severity since the beginning of the event at 10m resolution derived from pre- and post-event Sentinel-2 L2A calibrated data. This layer is derived from a product of the Burned Area Mapping (BAM) service. The Total Burned Area product is the synthesis of all burned area severity products derived by the BAM algorithm since the beginning of the wildfire monitoring. BAS is derived using the Relativized Burn Ratio (RBR) index and is computed only over the pixels classified as burned in the total burned area product. This layer shows the total burned area severity map using a yellow to red color gradient based on RBR values above 0.3. The legend is shown in the bottom right corner of the map.
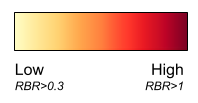
The legend of the Total Burned Area Severity layer is shown in the bottom right corner of the map.
Vegetation Recovery
The main product from the Vegetation Recovery algorithm that indicates the cumulative regeneration progress over burned areas. This layer is derived from a product of the Post Fire Vegetation Recovery Mapping (FRM) service. The vegetation recovery algorithm is triggered once active hotspots have ceased, and monitors vegetation regeneration over burned areas using the Normalized Difference Vegetation Index (NDVI) on a 15-day basis and comparing it against pre-fire conditions.
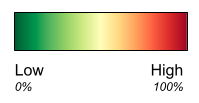
The Vegetation Recovery layer represents the percentage of vegetation recovery as a continuous variable ranging from 0% to 100%. Areas are color-coded to reflect the degree of recovery:
-
Values near 0% (represented in red) indicate minimal or no vegetation regeneration.
-
As recovery progresses, the colors transition continuously through orange and yellow, reflecting increasing recovery percentages.
-
Values around 60–80% (depicted in light green) represent substantial recovery, where vegetation is approaching pre-fire conditions.
-
Finally, values higher than 80% (shown in dark green) indicate full recovery, where vegetation has returned to its pre-fire state.
This continuous scale allows for a detailed assessment of vegetation recovery, providing a smooth gradient of information that highlights subtle variations in regeneration rates across the burned area over time.
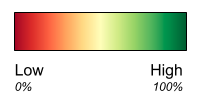
The legend of the Post-Fire Vegetation Recovery layer is shown in the bottom right corner of the map.
Fire Danger
Fire Danger Index (FDI) per pixel of Sentinel-2 imagery derived from the Fire Danger Mapping (FDM) service. The FDM algorithm relies on land cover, vegetation height, historical fire probabilities, and the Fire Weather Index (FWI) retrieved from the Global Wildfire Information System (GWIS). The Fire Danger layer provides a daily estimation of fire danger from 1 to 5. Fire danger categories are:
-
Low : Minimal fire risk.
-
Moderate : Fire conditions may ignite under certain circumstances.
-
High : Increased likelihood of fire ignition and spread.
-
Very High : Fires can start and spread rapidly.
-
Extreme : Exceptional fire danger; rapid and intense fire propagation is expected.
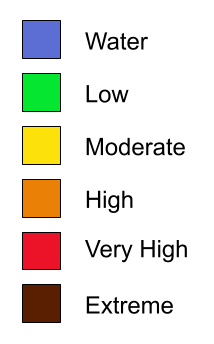
The legend of the Fire Danger layer is shown in the bottom right corner of the map.
Additional Layers
This second collection includes the layers providing complementary information to the first one.
VIIRS Hotspots
Detected hotspots at 1km resolution obtained from a daily composite of Near Real Time (NRT) active fires from the VIIRS S-NPP satellite offered by the NASA FIRMS service. This layer is derived from a product of the Burned Area Mapping (BAM) service. It shows hotspots in red.
Sentinel-3 Hotspots
Detected hotspots at 1km resolution derived from Sentinel-3 SLSTR RBT calibrated data. This layer is derived from a product of the Burned Area Mapping (BAM) service. The fire detection algorithm evaluates both absolute values of brightness temperature at 3.74μm and significant increases of these values in comparison to the one observed at 10.85μm. This layer shows hotspots in red.
Current Burned Area
Burned Area Extent at 10m resolution derived from pre- and post-event Sentinel-2 L2A calibrated data. This layer is derived from a product of the Burned Area Mapping (BAM) service. Burned areas are derived using an adapted version of the FireCCISFD20 algorithm (Roteta et al, 2021) employing Mid-Infrared Burn Index (MIRBI), and Normalized Burned Ratio 2 (NBR2) indexes from Sentinel-2 and VIIRS S-NPP hotspots. This layer shows the current burned area in red.
The legend of the Current Burned Area layer is shown in the bottom right corner of the map.
Current Burned Area Severity
Burned Area Severity (BAS) at 10m resolution derived from pre- and post-event Sentinel-2 L2A calibrated data. This layer is derived from a product of the Burned Area Mapping (BAM) service. BAS is derived using the Relativized Burn Ratio (RBR) index and is computed only over the pixels classified as burned in the current burned area product. This layer shows the burned area severity map using a yellow to red color gradient based on RBR values above 0.3.
The legend of the Current Burned Area Severity layer is shown in the bottom right corner of the map.
Burned Area Probability
Burned Area Probability at 10m resolution derived from pre- and post-event Sentinel-2 L2A calibrated data. This layer is derived from a product of the Burned Area Mapping (BAM) service. The burned area probability is derived using an adapted version of the FireCCISFD20 algorithm (Roteta et al, 2021) employing Mid-Infrared Burn Index (MIRBI), and Normalized Burned Ratio 2 (NBR2) indexes from Sentinel-2 and VIIRS S-NPP hotspots. This layer provides a level of confidence reached by the burned area mapping. Thus, pixels having a Burned Area Probability above 50% are mapped as burned in the Current Burned Area Extent product. Green colors represent low burned area probability values of vegetation recovery, whereas red colors represent high ones.
The legend of the Burned Area Probability layer is shown in the bottom right corner of the map.
Initial Burned Area
Initial Burned Area Extent from Sentinel-2 L2A calibrated data at 10m resolution. This layer is derived from a product of the Burned Area Mapping (BAM) service. This is an intermediate product derived in the initial stage of the FireCCISFD20 algorithm (Roteta et al, 2021) based only on Mid-Infrared Burn Index (MIRBI), and the Normalized Burned Ratio 2 (NBR2) indexes.
The legend of the Initial Burned Area layer is shown in the bottom right corner of the map.
NDVI
15-day Normalized Difference Vegetation Index (NDVI) composites at 10m resolution derived from Sentinel-2 L2A data acquired after active hotspots have ceased. This layer is derived from a product of the Fire Recovery Mapping (FRM) service. This layer shows a 15-day NDVI composite using a yellow to green color gradient based on positive NDVI values.

The legend of the NDVI layer is shown in the bottom right corner of the map.
EO Data
This third collection is dedicated to layers showing EO data.
Sentinel-3 SLSTR RBT
Brightness temperature at 1km resolution derived from Sentinel-3 SLSTR RBT calibrated data for the S7 band (lwir11 CBN). This layer shows brightness temperature using a cool to warm color ramp that can be used to visually depict thermal signatures over the earth surface. Blue colors represent negative brightness temperature values in Celsius, whereas red colors represent the positive ones.
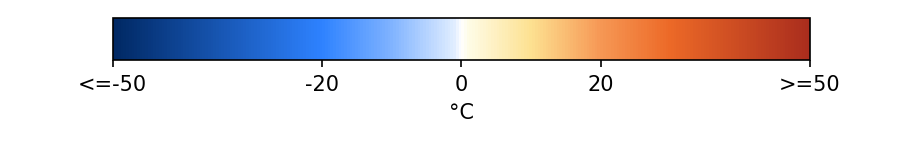
The legend of the Sentinel-3 SLSTR RBT Brightness Temperature Ascending or Descending layer is shown in the bottom right corner of the map.
Sentinel-2 MSI L2A
True Color composite at 10m resolution from Sentinel-2 L2A calibrated data acquired before or after a wildfire event.
Multitemporal mosaic
True Color composite from an image mosaic at 10m resolution derived from multiple calibrated Sentinel-2 L2A datasets acquired before the wildfire event. This layer shows a multi-temporal mosaic is the result of an artificial reconstruction of a pre-fire image to mitigate the effects of persistent cloud cover.