Wildfire Results Explorer
The Wildfire Results Explorer of the CopernicusLAC platform is a web application designed to visualize and analyze service outputs generated by the CopernicusLAC Wildfire Suite
Hint
See here how to access an Explorer in the CopernicusLAC platform.
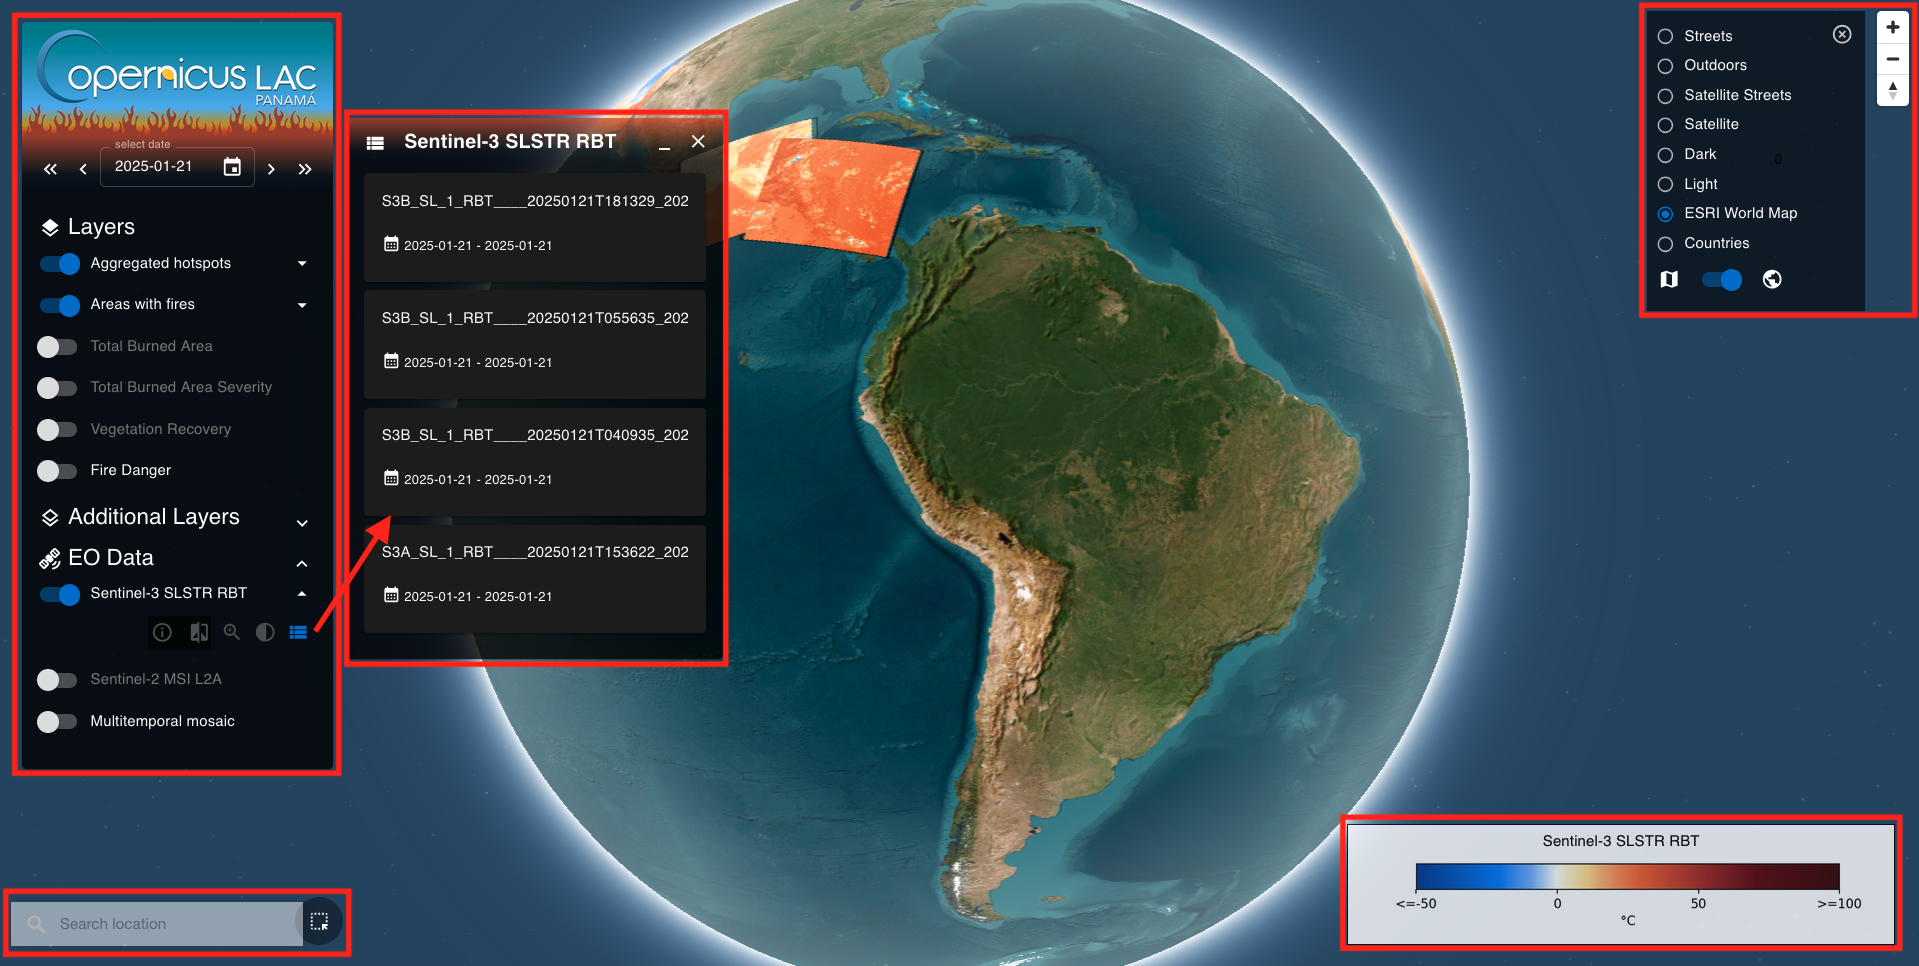
Once inside the Wildfire Results Explorer the user gets access to an essential and intuitive Graphic User Interface (GUI) with a global map centered over the LAC region and with different panels dedicated for the visualizing of EO products.
On the left side of the interface the user can find:
-
Layers Panel: providing spatio-temporal filters and a list of layers to be shown in the map.
-
Item List Panel: showing the list of items of a layer
-
Geo Location Search: providing a widget to search items over the bounding box of a location of interest
-
Clicked Items Dialog: showing the list of items over a clicked point in the map
while on the right:
-
Base map Panel: providing a list of selectable base layers and a button for switching among a 2D or a 3D view of the map
-
Map Navigation buttons: offering dedicated buttons to adjust the map view: zoom in/out, rotate and tilt.
-
Legend: legend of the last shown layer is shown in the bottom right corner of the map
Layers Panel
The Layers Panel is located on the left of the interface. In the upper part is located the Date Selector and below the List of Layers to be seen on the map.
Documentation button
The button to the online documentation is located in the top-right of the Layer Panel. The button is hidden and will appear when the user hovers over it with the mouse.
Date selector
When accessing the Wildfire Explorer it shows on the map products for active layers over a selected date.
The selected date is displayed in the select date field of the date selector box which is located in the upper part of the Layers Panel.
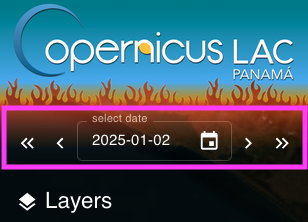
At first access the date selected is by default the current date. The user can change the current date by using the date selector buttons on the left to move -1 day (icon <) or -5 days (icon <<) back in the past. Instead, to quickly move forward in time the user shall employ the buttons on the right: +1 day (icon >) or +5 days (icon >>). Alternatively the user can also change the current date by clicking on the Calendar icon and selecting the desired one.
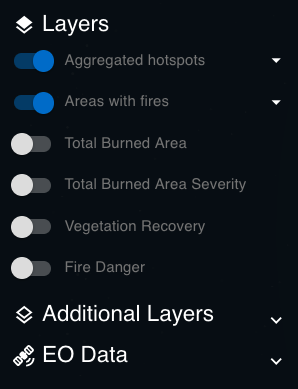
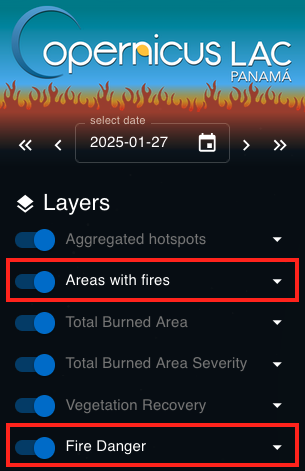
Layer List
This portion of the Layer Panel shows a pre-configured list of layers that the user can activate/disactivate to show/hide products in the map for the selected date. These products are derived from the wildfire services (Burned Area Mapping, Fire Danger Mapping and Fire Recovery Mapping) and are grouped into:
-
Layers: a collection of layers providing primary information from the most important products of the processing chain
-
Additional Layers: a collection of layers providing complementary information
-
EO data: a collection of layers showing EO data.
Info
Click on the below button to get more information about all the layers available within the Wildfire Results Explorer.
Show/Hide a layer
By default active layers are:
-
Aggregated hotspots,
-
Areas with fires.
The user can activate (show) or deactivate (hide) a layer by clicking on the circular button located next to the layer title on the left.
Layers order visualization
The visualization of layers in the map is based on the sequence followed by the user in activating each layer. Therefore, the last activated layer will be the top layer in the visualization of multiple layers in the map.
Tip
To visualize the Burned Area Severity layer superimposed to the Sentinel-2 MSI L2A one:
-
Deactivate all current active layers,
-
activate first the Sentinel-2 layer,
-
and then the BAS one.
If step 2 is inverted with step 3 the user will see only the Sentinel-2 MSI L2A layer in the map being the BAS layer underneath it.
Layers having the title in white are the ones having items to be shown in the map. When no items are available (e.g. no products are available for the selected date or area of interest) the layer title is instead shown in gray.
Warning
The visualization of too many active layers at the same time could slow down the system. For a fluid and responsive visualization of products in the map it is better to activate only the needed layers and deactivate the others.
Layer buttons
A list of Layer buttons are made available to users to easily interact with them. Layer buttons are by default hidden for each layer. To find the layer buttons the user must click on the triangular button placed next to the layer title on the right.
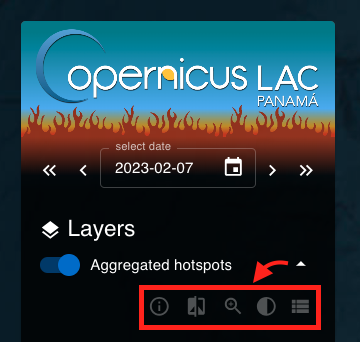
Available layer buttons are:
-
Info about the layer: it opens a dialog showing a description of each layer.
-
Compare layers: it opens a map view where the user can compare the layer with the others using a vertical slider. This swipe tool allows the user to interactively compare two layers horizontally. The selected layer is placed on the right and all the other active layers are on the left.
 Figure 7 - Compare layers functionality.
 -
Pan/Zoom: it automatically zooms and pan to the current list of items available for this layer. The pan and zoom is made on the bounding box including all the items.
-
Set opacity: it allows setting an opacity level to the layer.
-
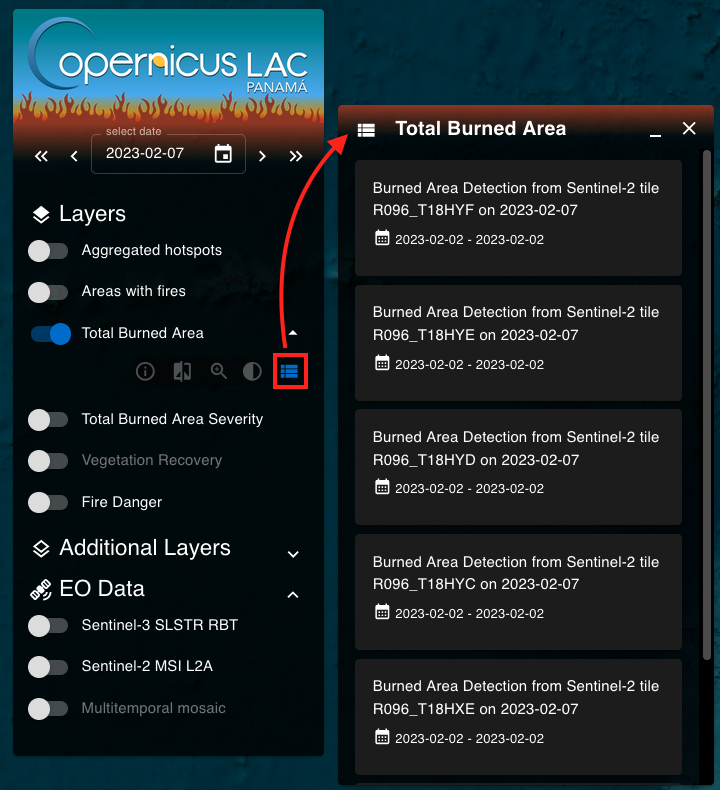
Item list: it opens the Item List Panel.
Item List Panel
Each layer contains a certain number of items that are produced by the wildfire services for the selected date. The list of items can be consulted by clicking on the Item list button. By default all the items in the list of each layer are simultaneously shown in the map.
Info
After a mouseover to the title of an item in the list the user can copy to clipboard the ID of the item.
Item Details Panel
After a click on an item in the Item List the Item details panel will appear and only the single selected item will be visible on the map. In the Item Details panel the user can consult the metadata of the product (e.g. product ID, datetime, resolution, etc.) that is displayed and ordered by following the STAC specifications.
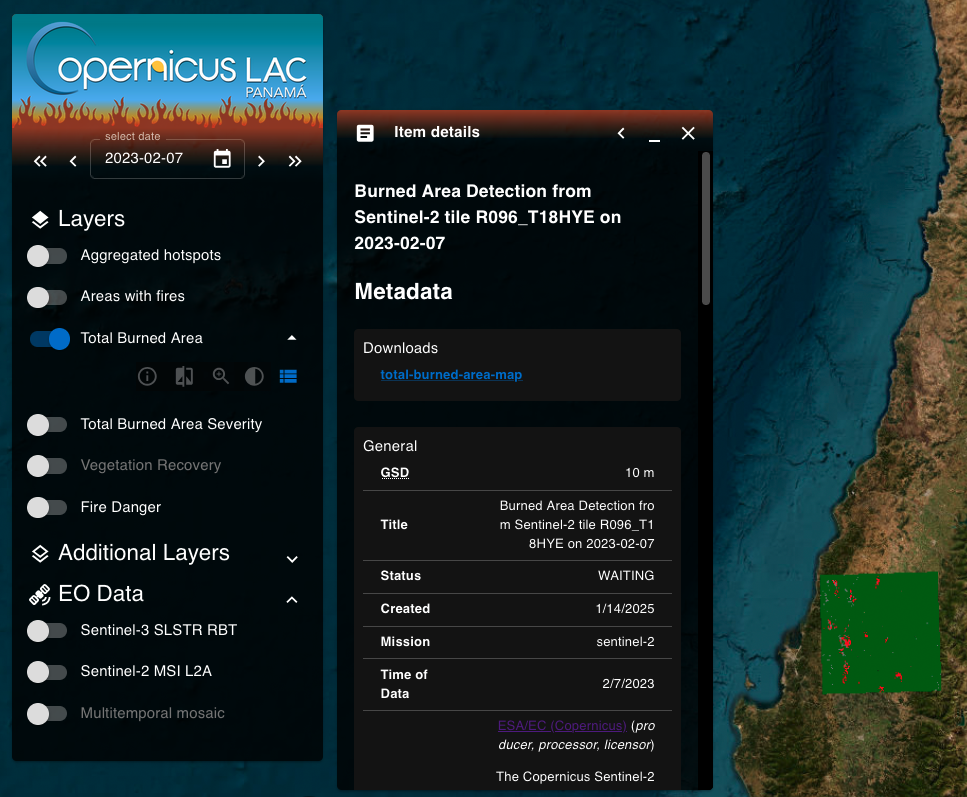
From this panel the used can also download the original product (e.g. the total-burned-area-map single band raster in COG format) by clicking on the available hyperlinks listed under Downloads.
Warning
The user can only download from a product the single band raster employed in the RGB combination shown by the layer. Thus from a Sentinel-2 MSI L2A calibrated dataset the user can only download the BOA reflectance single band raster for red, green and blue CBN (and not for nir or swir22) being the Sentinel-2 MSI L2A layer shown in the map as a True Color Composite.
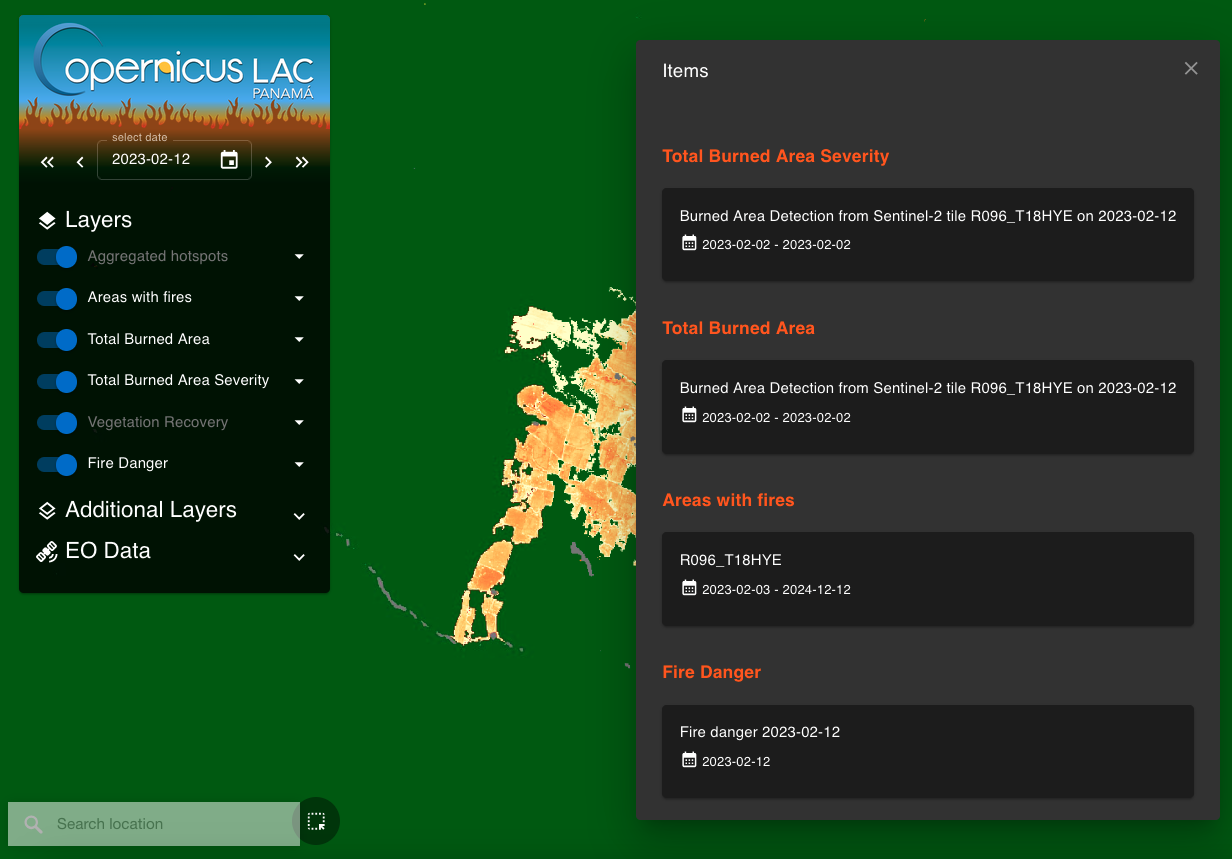
Clicked Items Dialog
After a click over a point in the map the interface shows the Clicked items dialog. This draggable dialog can be an heterogeneous list of items from multiple layers. The below Figure 10 shows an example of a list of overlapping items after a click over a point in the map.
Note
The access to the Item details panel is possible by clicking on the title of an item listed into:
- the Item List panel
- or the clicked items dialog.
In both cases the map will show only the selected item.
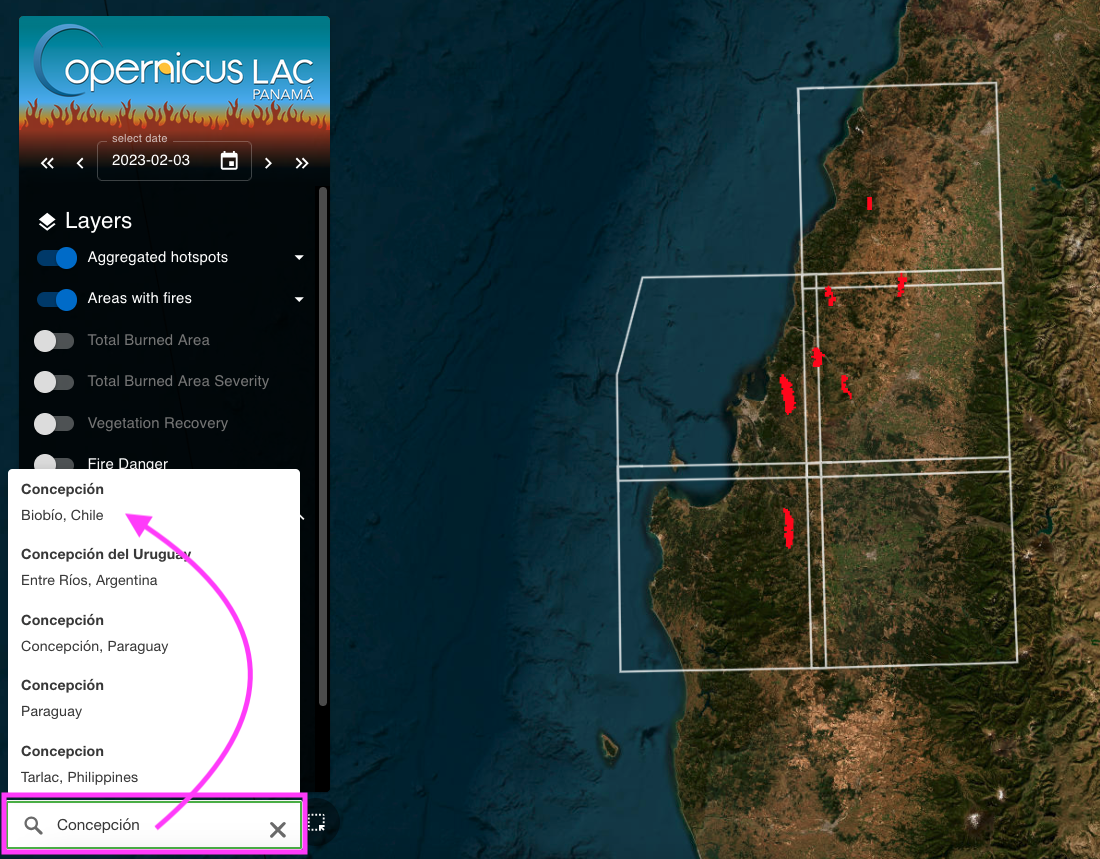
Location search and BBOX selector
On the bottom left corner of the map are located the Location Search and the BBOX selector widgets. Both these widgets can be used by the user to select and visualize on the map only the items falling inside a certain area.
Search location: the Search location widget can be used to find items falling inside the bounding box of a location of interest. After the insertion of the name of a location of interest (e.g. a city, a region, a province), the system automatically derives the bounding box of the geolocation layer for that municipality, and employs this geometry to retrieve the intersecting products from all the items of a layer.
BBOX selector: this widget can be used to find items falling inside a custom bounding box. After the drawing of a square by the user in the map, the platform employs this geometry to retrieve the intersecting products from all the items of a layer.
After the employment of either the Search location or the BBOX selector widget:
-
the map will automatically zoom to the search area,
-
will show only the layers having items inside the search BBOX,
-
and a geo filter icon will appear in the upper part of the Layer list panel just below the Date selector.
![]()
Note
The geo filter icon shows the Custom bounding box text when the search is made with the BBOX selector.
Hint
To remove the spatial filter just click on the Bin icon next to the geo filter icon.
Basemap Control Panel and Navigation buttons
On the top right corner of the map is located the Base map and Navigation Panel that includes:
-
the Basemap Control panel: where the user can change the base layer and switch between a 3D or a 2D view of the map,
-
and the Map navigation buttons.
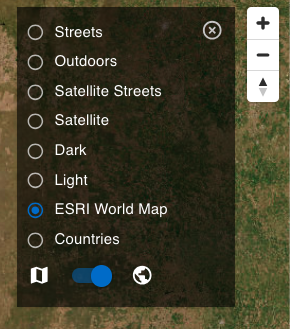
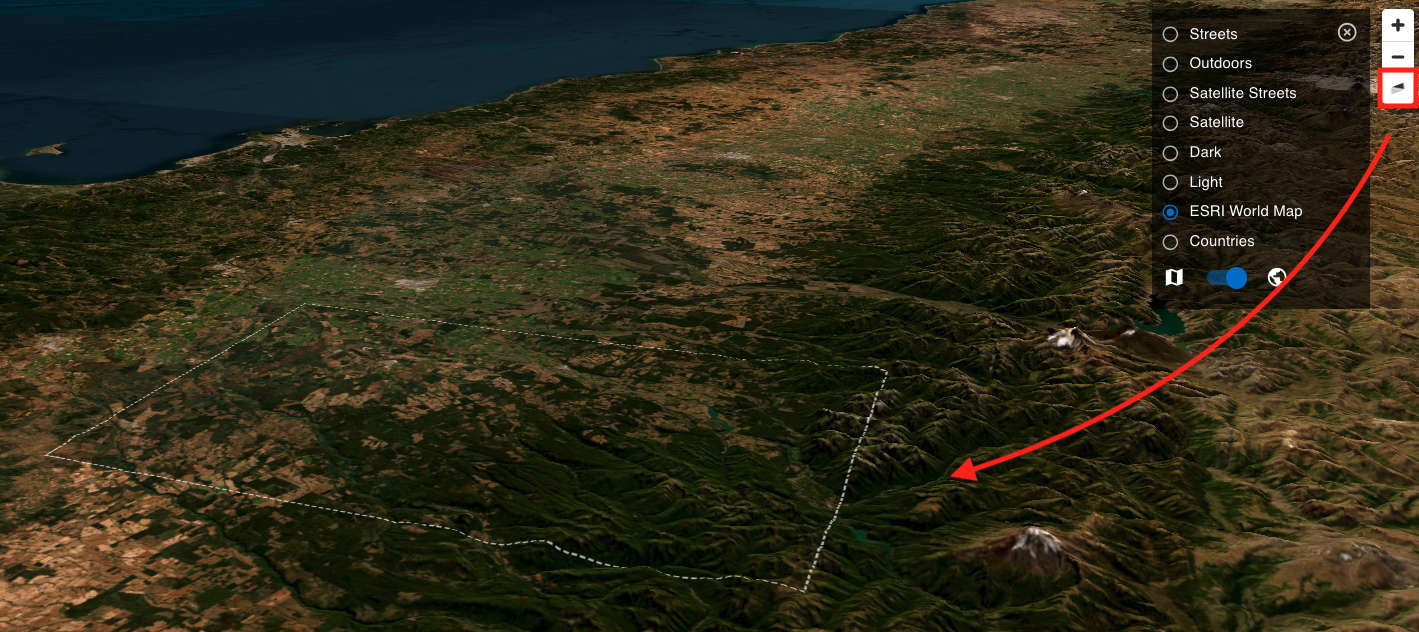
Basemap Control panel
In the Basemap Control panel the user can change the default background map with another one (e.g. the Light base layer) by clicking on the desired base layer from the list:
-
Streets
-
Outdoors
-
Satellite Streets
-
Satellite
-
Dark
-
Light
-
ESRI World Map
-
Countries
The default baselayer is the ESRI World Map one.
From the Base map panel it is also possible to switch from the 3D to a plane view of the map by clicking on the dedicated button located just below the list of base layers. By default the 3D view is selected.
Map Navigation buttons
Navigation controls are located on the right next to the Base map selector panel. Using the available Map Navigation buttons the user can:
-
Zoom in: left click on the + button
-
Zoom out: left click on the - button
-
Change the viewing angle by setting inclination and orientation: left click and hold the compass button while you drag left and right or up and down.
-
Reset bearing to the north: left click on the compass button
Hint
In the 3D view the user can tilt the map in any direction. The 3D tilt control is useful to view hills and mountains.
Legend
When available the legend of a layer is displayed in the bottom right corner of the map. When multiple layers are shown in the map, only the legend of the last activated layer will be shown.