Post-Fire Recovery Mapping (FRM) service specifications
Service Description
The Post-Fire Recovery Mapping (FRM) service is activated at the end of a wildfire event once hotspots are not anymore detected over a monitored area. This service monitors post-fire vegetation regeneration using spectral data, specifically evaluating the Normalized Difference Vegetation Index (NDVI), a widely used indicator of vegetation health and post fire recovery1. NDVI values are calculated at regular temporal intervals and compared against pre-fire and immediate post-fire conditions to monitor vegetation recovery progress. The NDVI is a normalized spectral index calculated using the Red and Near-Infrared (NIR) bands of satellite imagery, providing a quantitative measure of vegetation health. The FRM service uses imagery from the Sentinel-2 satellite, with a spatial resolution of 10 meters, ensuring detailed monitoring of vegetation recovery dynamics.
The service enables users to track recovery trends over time, identify areas with slower regeneration rates, and support decision-making for post-fire management and ecological restoration efforts.
In terms of geophysical products, the FRM tool generates the following outputs from the input datasets:
-
Temporal NDVI: product representing the vegetation health and dynamics at regular temporal intervals (e.g., monthly), serving as a key indicator of ecosystem recovery.
-
Vegetation Recovery: product assessing the degree of vegetation recovery compared to pre- and post-fire conditions.
The processor delivers updates at regular intervals, facilitating consistent monitoring of the affected areas.
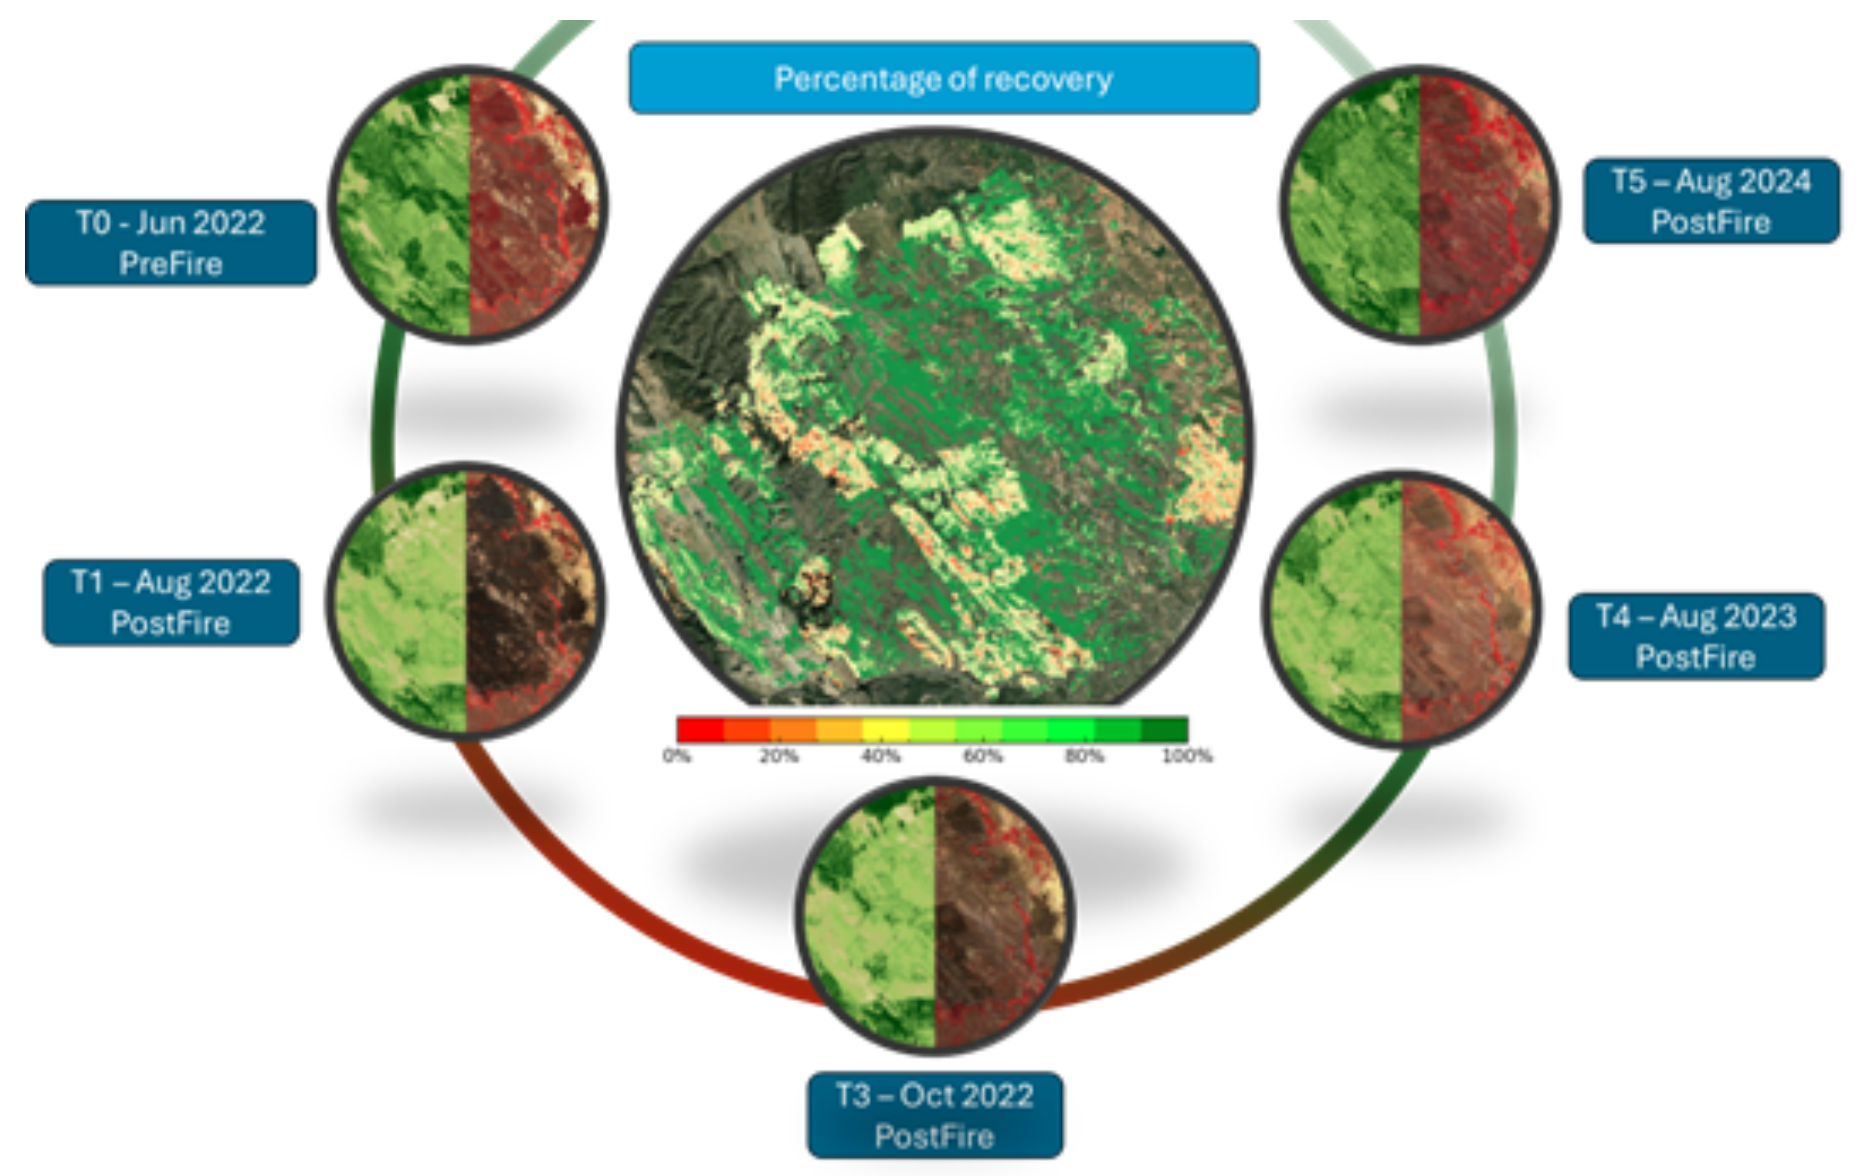
Figure 1 illustrates the recovery process, with NDVI composites and cumulative recovery rasters generated at regular time intervals. It highlights the progression from pre-fire conditions (T0) to post-fire recovery (T1–T5), demonstrating spatial and temporal variations in vegetation regeneration.
Temporal NDVI is displayed in the UI map as a resampled index ranging from 0 (yellow) to 1 (green). More information about the layer derived from the NDVI product can be found here.
Vegetation recovery is displayed in the UI map as a continuous variable ranging from 0% (red) to 100% (green). More information about the layer derived from the Post-Fire Vegetation Recovery product can be found here.
Note
Post-Fire Recovery Mapping (FRM) service
Frequency: 15 days. Calculation frequency can be differently configured by the operator if required by the user.
Spatial coverage: only over burned perimeters identified in the ROI.
Temporal coverage: regularly provides vegetation recovery from 15 to 380 days after the end of the wildfire event..
Constraints: availability of Sentinel-2 data from CDSE. Data gaps or delays due to persistent cloud coverage.
Workflow
The schema shown in the below figure describes the high-level workflow of the FRM service.
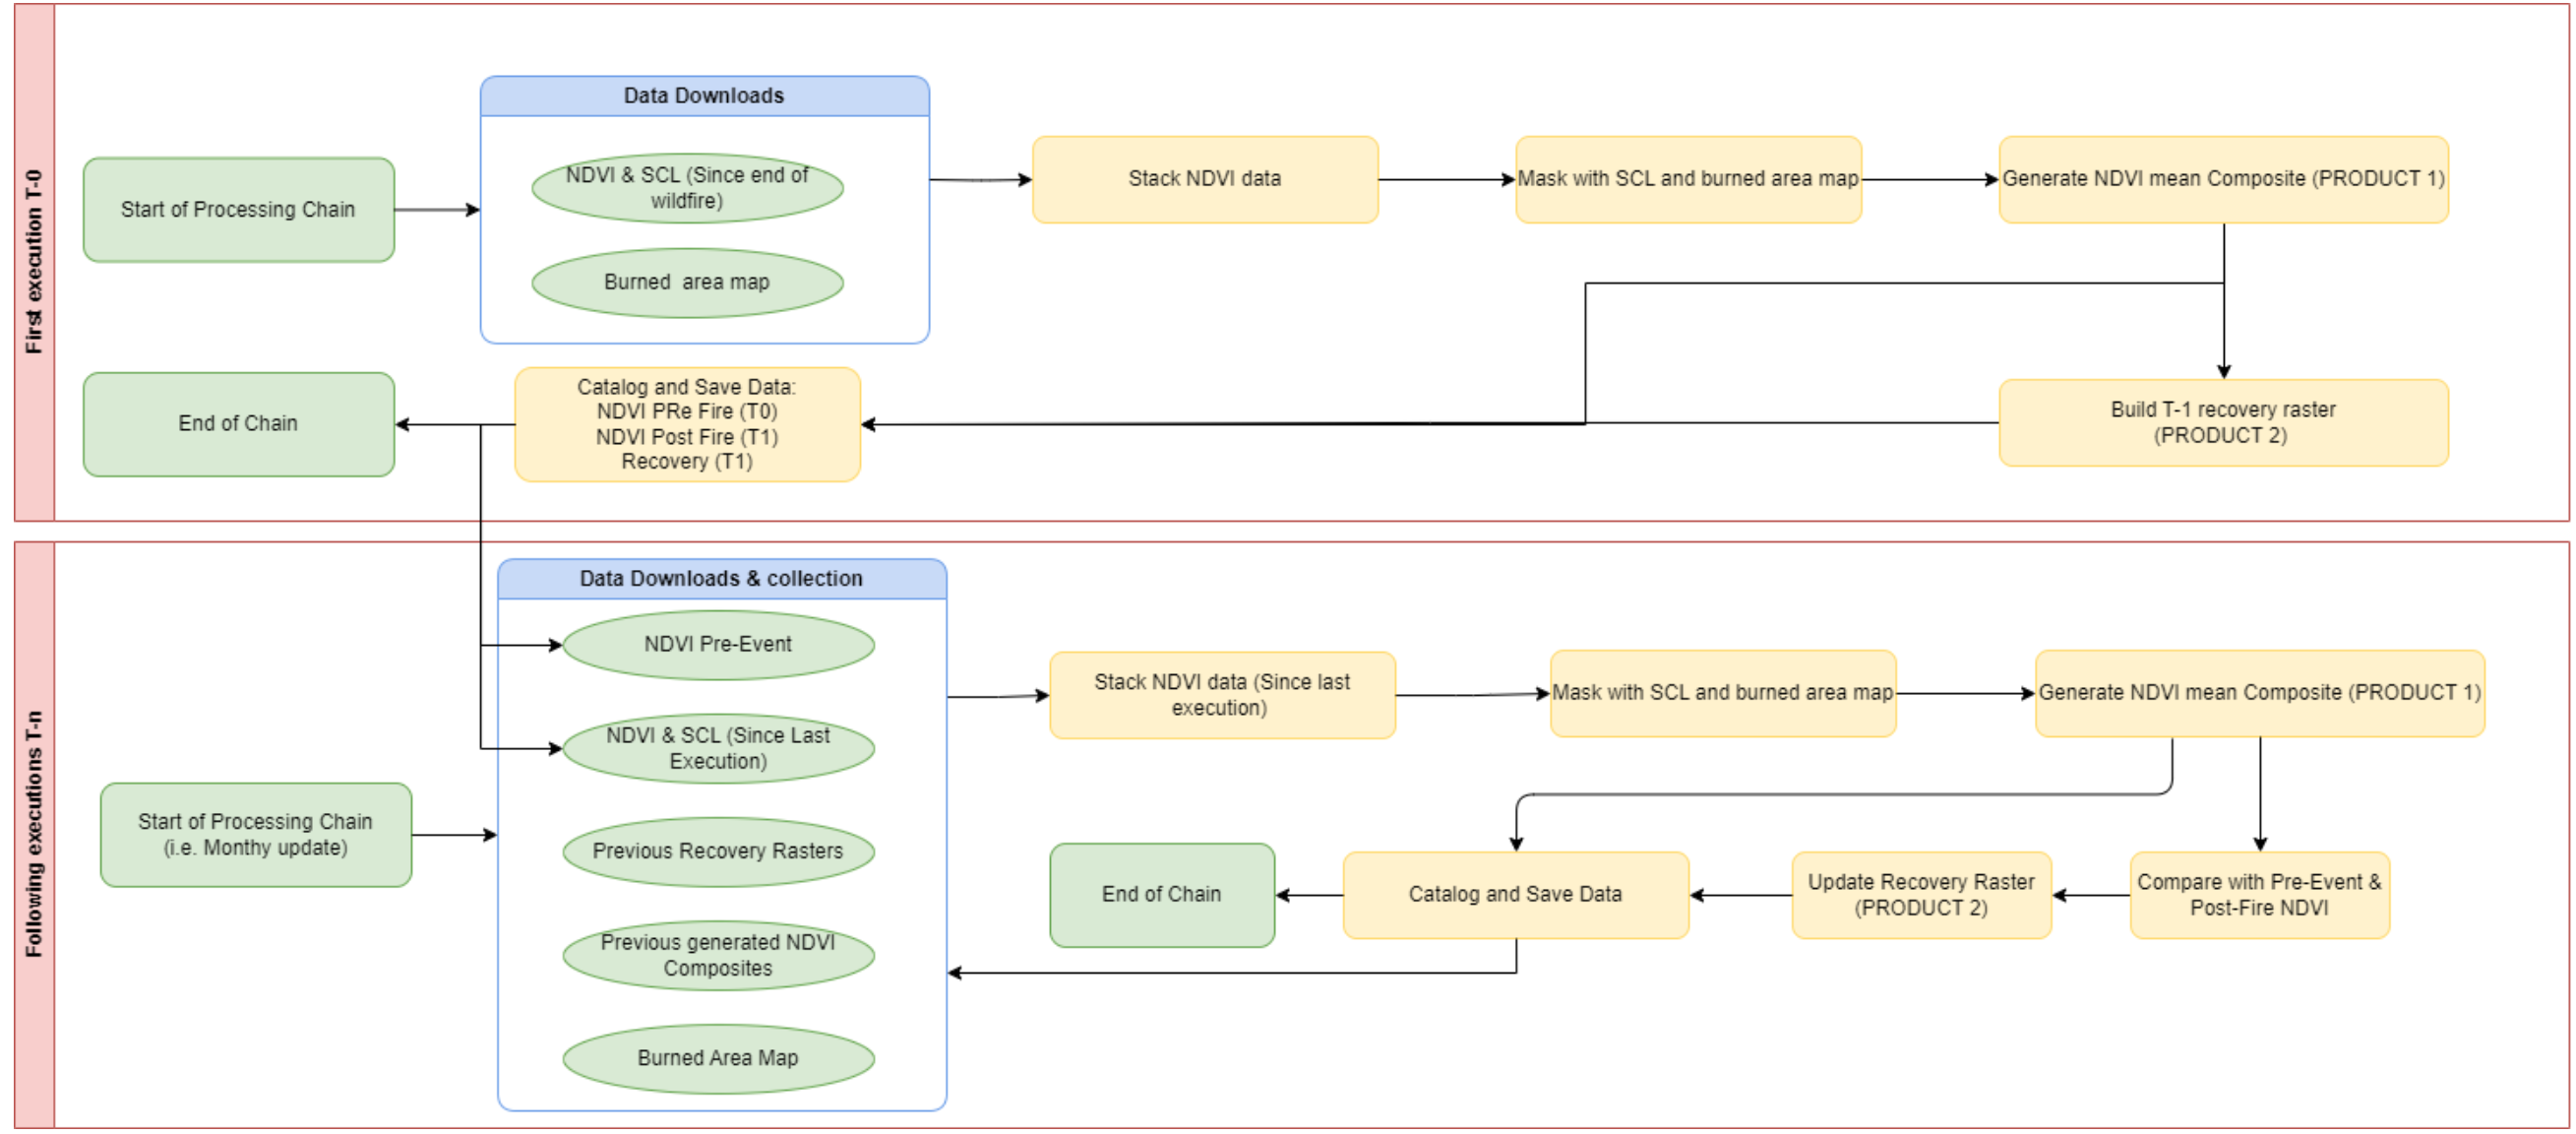
The execution of this service is automated and operates upon initiation. When a wildfire perimeter becomes available, the process may be triggered to collect and analyze the necessary data. During the initial execution, the service calculates the NDVI for the pre-fire condition (T-0) and generates a composite to characterize the immediate post-fire situation (T-1).
Subsequently, the processor runs at defined temporal intervals (e.g., bi-weekly, monthly, bi-monthly) (T-n) to compute a new NDVI composite and compare it against the T-0 and T-1 conditions. This comparison estimates the percentage of spectral vegetation recovery, offering valuable insights into the ongoing post-fire regeneration process. In broad terms, the processor performs the following operations:
Stack NDVI Data (Since Last Execution)
In this step, the processor collects NDVI data from satellite imagery acquired since the last execution of the workflow. If it is the initial run (no previous executions), the processor retrieves and stacks pre-fire imagery to establish baseline conditions (T-0) and immediate post-fire imagery (T-1).
Mask with SCL and Burned Area Map
In this step, the stacked NDVI data is masked to exclude any pixels that could introduce noise into the characterization of vegetation behavior. This includes pixels affected by cloud cover, fog, cloud shadows, ice, snow, and water, as defined by the SCL (Scene Classification Layer). Each image is individually masked, assigning "NoData" values to pixels that do not meet the required quality thresholds. Additionally, the analysis is restricted to the burned area as defined by the Burned Area Map, ensuring the focus remains on relevant regions for recovery monitoring.
Generate NDVI Mean Composite (Product A)
A nanmean (mean that excludes invalid or "NoData" values) is calculated from the masked NDVI data to produce a composite. This composite represents the average NDVI values over the relevant time period since the last execution, providing a clear metric for monitoring vegetation recovery.
Compare with Pre-Event and Post-Fire NDVI
In this step, each pixel's current NDVI value is compared against the pre-event and post-fire NDVI benchmarks:
-
The Pre-Event NDVI represents the 100% recovery benchmark, indicating the vegetation's condition before the fire.
-
The Post-Fire NDVI, calculated from the first NDVI composite after the fire, serves as the 0% recovery baseline, representing the immediate impact of the fire.
Recovery percentages are determined for each pixel by normalizing the current NDVI value within the range defined by these two benchmarks.
Update Recovery Raster (Product B)
In this step, a new recovery raster is generated based on the latest NDVI calculations, reflecting the progress of vegetation regeneration. The process involves the following:
-
First Comparison (Initial Run): If this is the first recovery composite after the pre-fire NDVI (T-0), the recovery raster assigns a value of 0% recovery to all pixels, as the condition immediately post-fire (T-1) is used as the baseline.
-
Subsequent Updates: For subsequent recovery calculations, the new recovery raster is compared with the previous one. For each pixel, the maximum recovery value between the new and the previous raster is retained. This ensures that the recovery percentage for each pixel either increases or remains constant over time, reflecting the cumulative progress of vegetation recovery.
Catalog and Save Data
In this step, all generated information is systematically catalogued, starting from the initial pre-fire NDVI (T-0) through to the current temporal iteration (T-n). This includes storing the NDVI composites and the recovery rasters generated in the previous steps.
The catalog serves as a cumulative repository, retaining both the NDVI data and the calculated recovery values for each time step. This archived information is iteratively utilized in subsequent temporal cycles to update the recovery analysis, ensuring that each iteration builds upon the results of the previous ones.
Input
The FRM service requires in input the following:
-
Burned Area Map: Defines the spatial extent of the fire-affected region to focus on vegetation recovery within this perimeter.
-
NDVI Pre-Event: Represents the condition of vegetation before the wildfire. This serves as the baseline (target recovery level) to determine when vegetation has fully recovered.
-
Previous Generated NDVI Composites: These composites represent historical NDVI values, including the immediate NDVI after the fire, which is considered the 0% recovery point. This is needed to track NDVI evolution over time.
-
Previous Recovery Rasters: These rasters represent the recovery state calculated during previous processor executions. The recovery value for each pixel always increases or remains constant, ensuring that vegetation recovery is cumulative and does not regress.
-
NDVI and SCL (Since Last Execution): NDVI data collected since the processor’s last execution is used to compute updated NDVI composites. Cloud contamination is masked using the SCL, and only valid pixels within the burned area are included.
Parameters
The FRM service includes the possibility of adapting the temporal range over which NDVI composites are calculated and fire recovery is assessed (i.e., frequency of calculation). Once a burned area is detected, the processor can operate to generate temporal outputs based on the defined configuration.
| Parameter | Description | Required | Default value |
|---|---|---|---|
| Calculation frequency | Time lapse over which calculate the average NDVI composite (e.g. every two weeks, every month, every two months) | NO | 15 days |
Output
The FRM service provides in output the following products:
-
PRODUCT A - NDVI Mean Composites: A composite representing the average NDVI values for the burned area since the last processor execution. This product provides a snapshot of vegetation health over the analyzed period. Format: raster file in COG format. Projection: WGS84 (Latitude, Longitude). Spatial Resolution: 10 meters. Temporal Coverage: Extends from the first execution of the service through subsequent updates.
-
PRODUCT B - Vegetation Recovery: A raster indicating the cumulative percentage of vegetation recovery. This is calculated based on the highest recovery values observed across multiple executions, offering a dynamic and continuously updated view of post-fire recovery progress. Format: raster file in COG format. Projection: WGS84 (Latitude, Longitude). Spatial resolution: 100m. Temporal Coverage: Extends from the first execution of the service through subsequent updates.
All generated outputs, including the NDVI composites and recovery rasters, are cataloged and made accessible to the user. Users can visualize the outputs directly and explore the complete historical series for the analyzed area. This enables the user to review detailed NDVI or recovery values at any point in time and for any location within the region of interest, supporting in-depth monitoring and decision-making processes.
Service Provider
The service is developed by Indra.
References
-
João, T., João, G., Bruno, M., & João, H. (2018). Indicator-based assessment of post-fire recovery dynamics using satellite NDVI time-series. Ecological Indicators, 89, 199-212. DOI: 10.1016/j.ecolind.2018.02.008. ↩