Fire Danger Mapping (FDM) service specifications
Service Description
The Fire Danger Mapping (FDM) service is a decision-support service that estimates the Fire Danger. The Fire Danger is calculated at pixel level by integrating static and dynamic variables derived from Earth Observation data. These variables provide a comprehensive characterization of weather conditions, topography, and vegetation, which are critical factors influencing fire danger. The following figure provides a visual example of the calculation process, the appearance of the final product, and its corresponding legend.
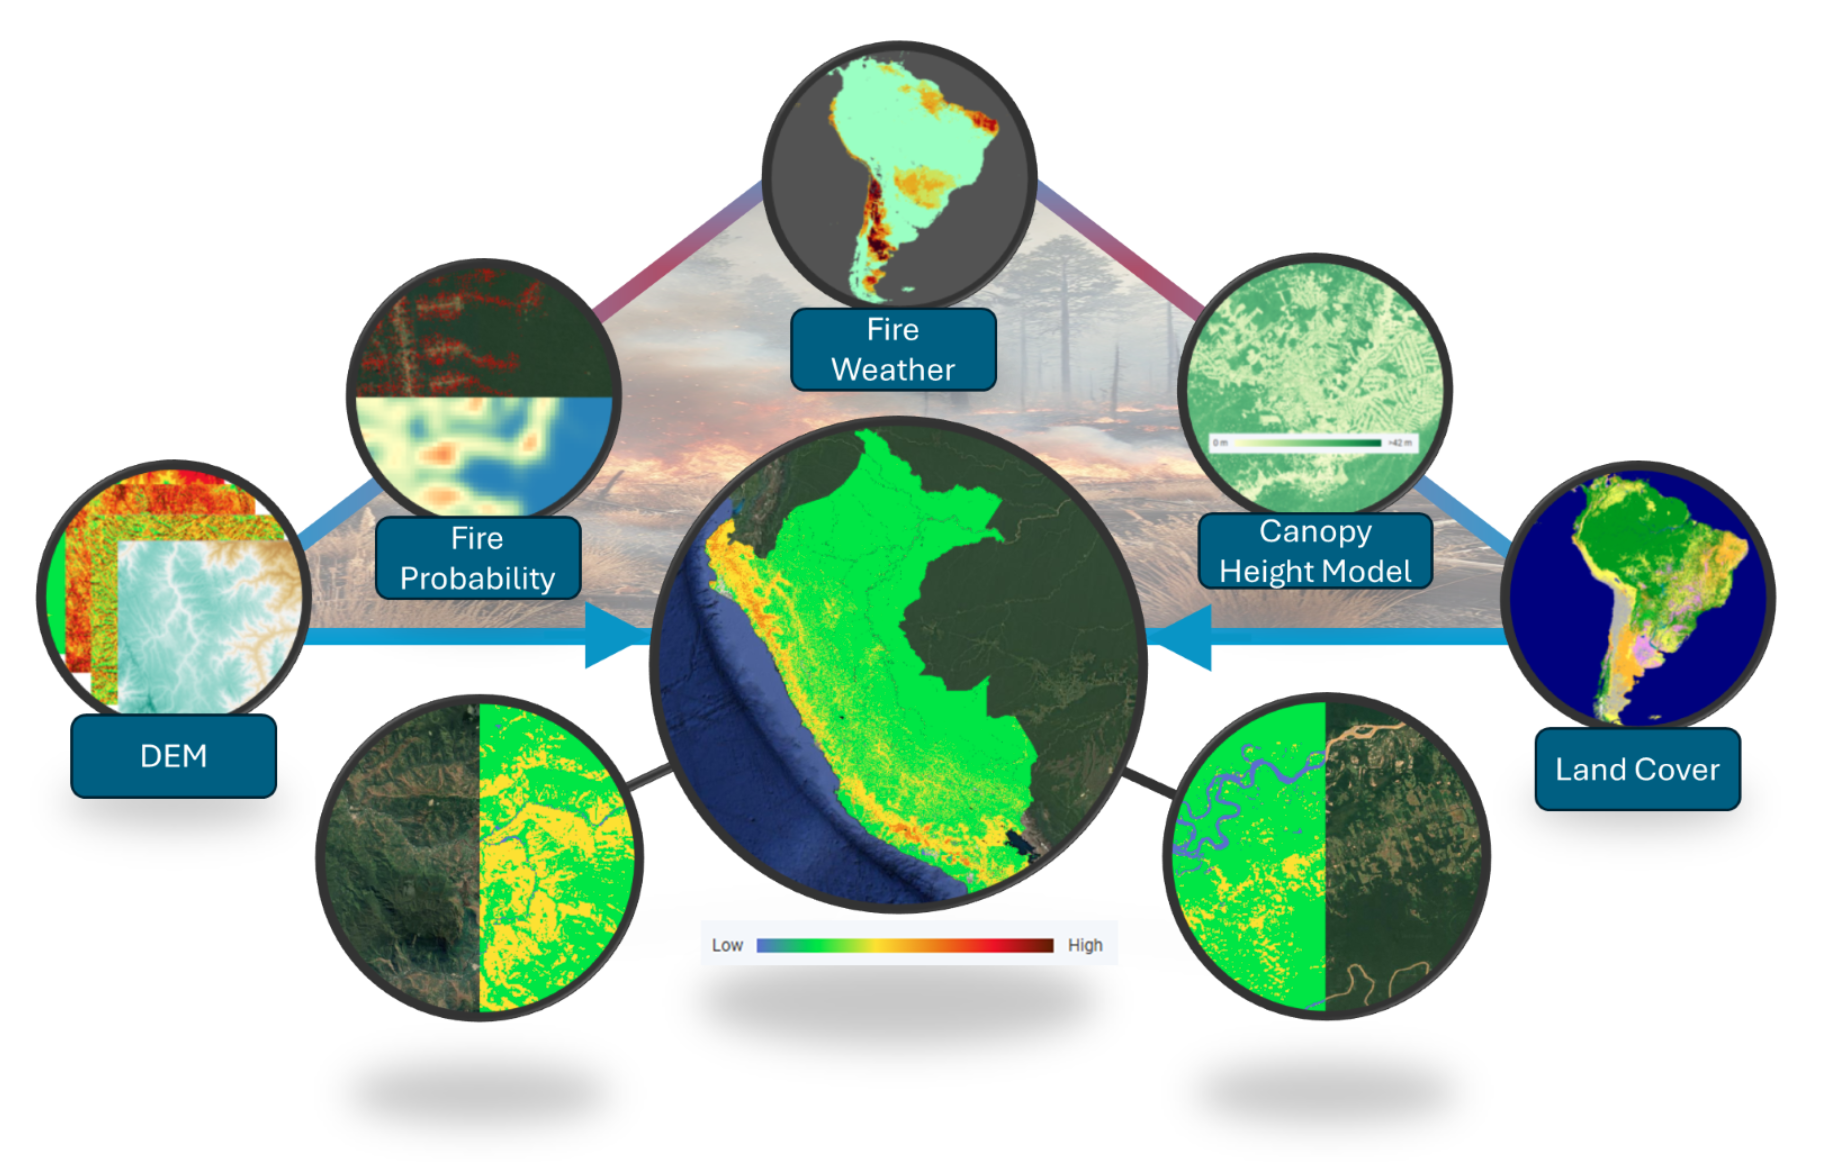
This geospatial map visually represents fire danger levels over the Area of Interest (AOI) and specific date. Fire danger is classified into qualitative categories, such as:
-
Low : Minimal fire risk.
-
Moderate : Fire conditions may ignite under certain circumstances.
-
High : Increased likelihood of fire ignition and spread.
-
Very High : Fires can start and spread rapidly.
-
Extreme : Exceptional fire danger; rapid and intense fire propagation is expected.
The Fire Danger product is shown in the UI using the above defined colors. More information about the layer derived from the Fire Danger product can be found here.
The FDM service offers a highly customizable application that allows users to assess fire danger levels, adapting the model to specific local conditions. The service uses static variables, such as land cover, vegetation height, and historical fire probabilities, combined with dynamic data like the Fire Weather Index (FWI) retrieved from the Global Wildfire Information System (GWIS). These inputs are standardized, reclassified, and integrated using a weighted average algorithm. The service allows for the adjustment of input variable weights, enabling the process to be adapted to better reflect the environmental and meteorological characteristics of specific regions. This flexibility enhances the accuracy of the FDI, ensuring that the assessment is not only regionally relevant but also sensitive to local variations.
In terms of geophysical products, the FDM service generates, from the inputs datasets:
-
Fire Danger Maps: Comprehensive hazard assessments highlighting areas at risk of fire.
-
Intermediate Reprocessed Variables: Datasets used in the computation of the FDI, providing insights into specific contributing factors.
Note
Fire Danger Mapping (FDM) service
Frequency: 7 days.
Spatial coverage: over a defined ROI in the LAC region.
Temporal coverage: Maps are continuously produced over the ROI. This service can potentially calculate fire danger for any date within the time range covered by the FWI dataset, which spans from historical data starting in 2017 to forecast data with a lead time of up to 10 days. This flexibility allows for both retrospective analysis and near-future fire danger predictions.
Constraints: Availability of the Fire Weather Index (FWI) retrieved from the Global Wildfire Information System (GWIS). The Fire Weather Index (FWI) data is available from 2017 to the present. Forecasted FWI values are provided for a maximum of 10 days ahead, with increasing uncertainty for each additional day into the future. This limitation affects the precision of longer-term predictions and should be considered when analyzing fire danger trends or planning mitigation strategies.
Workflow
The schema shown in the below figure describes the high-level workflow of the FDM service.
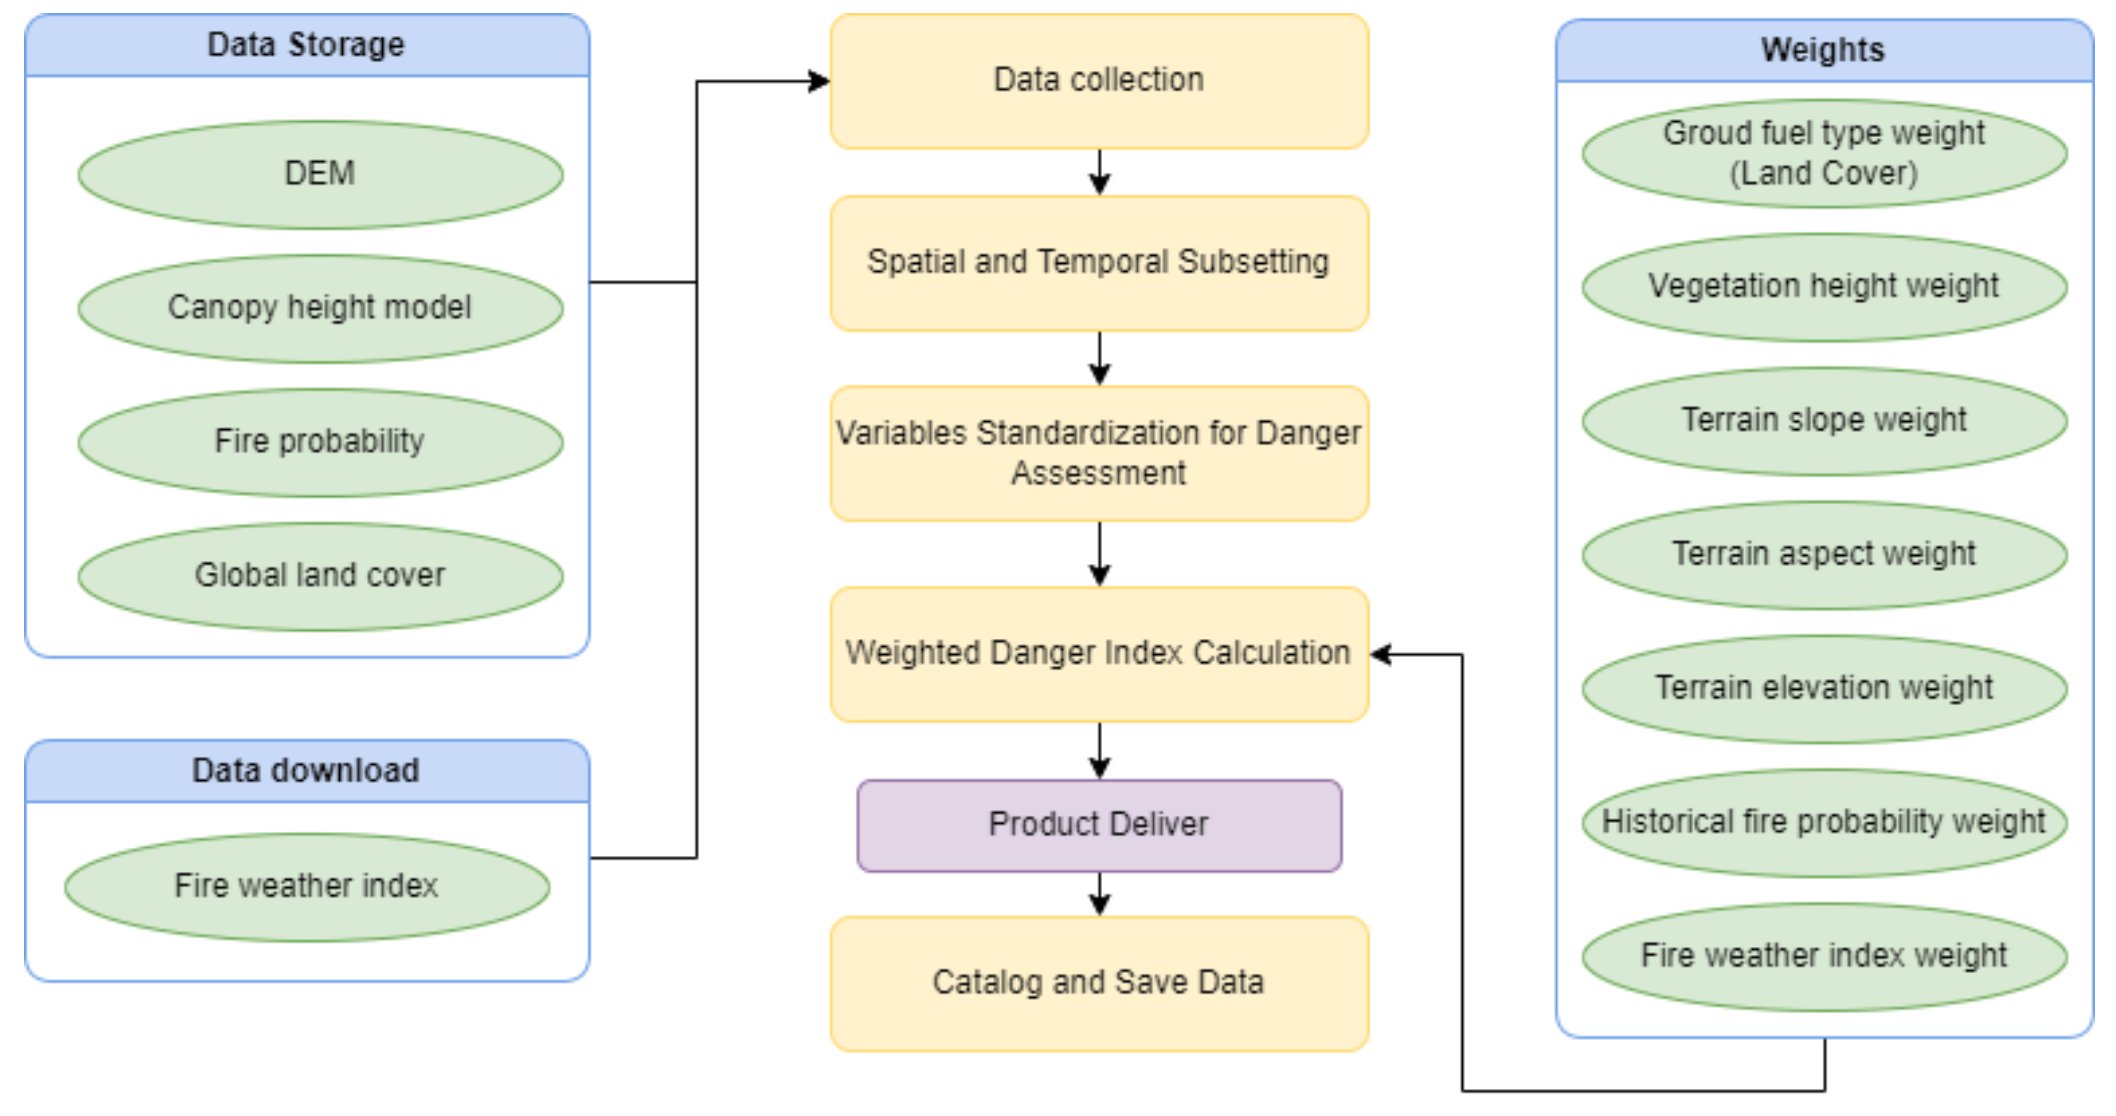
First, the service establishes a connection with the databases containing the various variables involved in the process. It then processes and integrates these variables to generate the Integrated Danger Index, following a series of detailed steps as described in the below sections.
Data Collection
The static variables (DEM, Canopy Height Model, Fire Probability, and Land Cover) are stored on the server and cover the entire Latin America region. For the Fire Weather Index, the application connects to the servers of the Global Wildfire Information System (GWIS) and retrieves the data through a query to their services. This collected data is then passed on to the next phase.
Spatial and temporal subsetting
In this step, the service extracts and preprocesses data. All datasets are clipped to match between them. Subsequently, the data is reprojected to a common spatial projection, ensuring consistency across all datasets for further analysis.
Variables Standardization for Danger Assessment
At their original resolution, each dataset is individually reclassified to generate a qualitative variable representing the level of fire danger associated with each factor. Once reclassified, all datasets are resampled to a uniform resolution of 100 meters, to a uniform resolution of 100 meters to ensure spatial consistency.
Weighted Danger Index Calculation
The integration of variables is performed using a weighted average, where each variable is assigned a specific weight. The default weights used in the Weighted Danger Index Calculation were established through a systematic analysis of variable behavior across diverse regions in Latin America. Each input variable was first reclassified into qualitative danger levels based on its influence on fire ignition and propagation. These reclassified variables were then integrated using the weighted average, where each variable was assigned a specific weight to reflect its relative importance. Below, we detail the criteria used for reclassification and the rationale behind the assigned default weights:
-
Ground Fuel Type (0.4): Vegetation types were grouped into fire danger categories based on their combustibility and fuel availability. For example, dry grasslands and shrublands were classified as high risk, while forests with significant humidity were classified as moderate risk, and barren or urban areas as low risk. Ground fuel type plays a dominant role in fire ignition and spread, as it determines the availability and combustibility of fuel. This factor was assigned a high weight (0.4) to reflect its primary influence on fire danger.
-
Fire Weather Index (0.65): The FWI was divided into danger levels ranging from low to extreme, based on thresholds commonly used in fire meteorology (e.g., humidity, temperature, wind speed, and fuel dryness). As a dynamic variable, the FWI is the most critical driver of fire danger. Even areas with significant fuel loads remain low-risk unless weather conditions are conducive to fire ignition. This explains its dominant weight of 0.65.
-
Vegetation Height (0.18): Vegetation height was used as a proxy for biomass availability. Taller vegetation, such as forests, was classified as high risk due to the higher fuel load, while shorter vegetation, such as grasslands, was assigned moderate risk. Although important, vegetation height alone does not determine fire danger, as it interacts strongly with weather conditions. Its moderate weight reflects its secondary importance.
-
Terrain Slope (0.2): Slope values were divided into categories where steeper slopes were assigned higher danger levels due to their effect on fire spread (fires move faster uphill). The analysis demonstrated that terrain slope significantly accelerates fire propagation, particularly in mountainous regions, justifying its moderate weight.
-
Terrain Aspect (0.15): Aspect (terrain orientation) was classified into danger levels based on solar exposure. South-facing slopes (in the Northern Hemisphere) or north-facing slopes (in the Southern Hemisphere) receive more sunlight, leading to drier conditions and higher fire risk. While important, aspect has a more localized influence compared to weather and fuel type, so it was assigned a slightly lower weight.
-
Terrain Elevation (0.1): Elevation was categorized based on vegetation distribution patterns. Higher altitudes, where vegetation is sparse, were assigned low risk, while mid-altitudes with significant vegetation were classified as higher risk. Elevation has a relatively minor influence on fire danger compared to other factors and thus was assigned a low weight.
-
Historical Fire Probability (0.3): Historical fire occurrence data was grouped into risk levels based on frequency. Areas with frequent past fires were classified as high risk, while areas with few or no historical fires were categorized as low risk. Historical fire patterns often align with environmental and climatic conditions conducive to fire. This weight reflects the strong, though not exclusive, predictive value of past fire occurrence.
By adapting the weights to specific cases, the resulting fire danger index becomes more tailored to the selected area. This customization enhances accuracy by better reflecting local conditions, such as vegetation characteristics, terrain properties, or historical fire patterns, thereby improving the relevance and reliability of the results for the targeted region.
Catalog and Save Data
Once the necessary calculations are completed, the results are stored in the catalog for future reference. The outputs are then made available to the user, ensuring accessibility and usability for further analysis or decision-making.
Input
The FDM service employs the static and dynamic input datasets that are listed below.
Static datasets
-
Global Land Cover (Copernicus GLC): The Copernicus GLC1 provides detailed information on vegetation and land cover types globally. This product classifies the Earth's surface into 23 distinct classes, following the Food and Agriculture Organization (FAO) classification scheme. Land cover maps are available annually for the years 2015 to 2019, with a spatial resolution of 100 meters.
-
Canopy Height Model (ETH Global Canopy Height 2020): The Global Canopy Height 2020 model2 estimates vegetation height and structure globally, providing essential data for evaluating biomass and forest dynamics. The model is based on data from 2020 and offers a spatial resolution of 10 meters.
-
Fire probability: it is built from historical fire occurrence data, using complete time series from MODIS and VIIRS sensors (2000-2024). These data help identify areas with higher fire frequency in the past, which is crucial for assessing current and future fire risks.
-
Topography (FABDEM): The FABDEM (Forest And Buildings removed Copernicus DEM)3 is a global digital elevation model that removes the influence of buildings and vegetation, providing an accurate representation of the terrain. It offers a spatial resolution of 30 meters and is essential for analyzing the influence of topography on fire spread.
Dynamic dataset (updated daily)
- Fire Weather Index (GWIS): This index, derived from the Global Wildfire Information System (GWIS)4, estimates fire danger based on meteorological conditions such as fuel moisture and wind. Data is available from 2017 for historical analysis, and forecasts are provided with lead times of up to 10 days. Both have a spatial resolution of approximately 8 km. The Fire Weather Index (FWI) is categorized into six fire danger levels, ranging from low to very extreme, and serves as a critical dynamic input for assessing both current and near-future fire danger.
Parameters
The FDM service requires a specific set of mandatory parameters, to be inserted by the user or service operator. Table 1 describes these parameters.
| Parameter | Description | Required | Default value |
|---|---|---|---|
| Area of Interest | Geographic region where to assess the fire danger. Expressed in Well-know text (WKT) format | YES | |
| Date of Interest | Specific date on which evaluate the fire danger, in relation to the moment of execution: Future date: up to a week ahead, Past date: any day up to mid 2016 | YES | |
| Weights | Factors to adjust the influence of different parameters on fire danger. | NO | Ground fuel type: 0.4, Vegetation height: 0.18, Terrain slope: 0.2, Terrain aspect: 0.15, Terrain elevation: 0.1, Historical fire probability: 0.3, Fire weather index: 0.65 |
Output
The FDM service provides in output the following products:
-
PRODUCT A - Fire Danger Map geospatial mapping of fire danger levels over a defined Area of Interest (AOI) and specific date. The map classifies areas into qualitative categories (e.g., low, moderate, high, very high, extreme) based on the integration of environmental and meteorological variables, representing the likelihood and potential severity of wildfire occurrence. Format: raster file in COG format. Projection: WGS84 (Latitude, Longitude). Spatial Resolution: 100 meters. Temporal Coverage: Historical or forecast date.
-
PRODUCT B - Variables Involved in Fire Danger Calculation: rasters representing the standardized input variables used for calculating the Fire Danger Index. These variables include land cover, canopy height, fire probability, topography, and fire weather conditions, each contributing to the overall assessment of fire risk. Format: raster file in COG format. Projection: WGS84 (Latitude, Longitude). Spatial resolution: 100m. Temporal Coverage: Depends on the product. From annual to daily.
Service Provider
The service is developed by Indra.
References
-
Copernicus, Land Monitoring Service, Global Dynamic Land Cover. Available at: https://land.copernicus.eu. ↩
-
Lang, N., Jetz, W., Schindler, K. et al. A high-resolution canopy height model of the Earth. Nat Ecol Evol 7, 1778–1789 (2023). DOI: 10.1038/s41559-023-02206-6. ↩
-
Hawker, Laurence, Peter Uhe, Luntadila Paulo, Jeison Sosa, James Savage, Christopher Sampson, and Jeffrey Neal. "A 30m global map of elevation with forests and buildings removed." Environmental Research Letters (2022). DOI: 10.1088/1748-9326/ac4d4f. ↩
-
JRC Global Wildfire Information System, Fire Weather Index. Available at: https://gwis.jrc.ec.europa.eu. ↩