Burned Area Mapping (BAM) service specifications
Service Description
The Burned Area Mapping (BAM) service operates in two complementary stages to support wildfire detection and monitoring. First, users receive real-time information on active fire hotspots detected using Sentinel-3 SLSTR thermal data that is ingested in automatic fashion from the Copernicus Data Space Ecosystem (CDSE). This early detection capability provides a near-instantaneous view of fire activity, allowing for rapid situational awareness and initial response. When a significant density of hotspots is detected, the system automatically activates the ingestion of atmospherically corrected optical imagery (Sentinel-2 MSI L2A) acquired before and after on-going active fires. After the calibration of Sentinel-2 data the system then triggers the burned area mapping algorithm which provides burned area probability, extent, and severity at 10m spatial resolution and with a 5-day frequency. By focusing computational resources only on areas flagged as significant, this systematic approach enables efficient mapping of fire-affected zones, offering users geospatial products to assess wildfire impacts and guide decision-making.
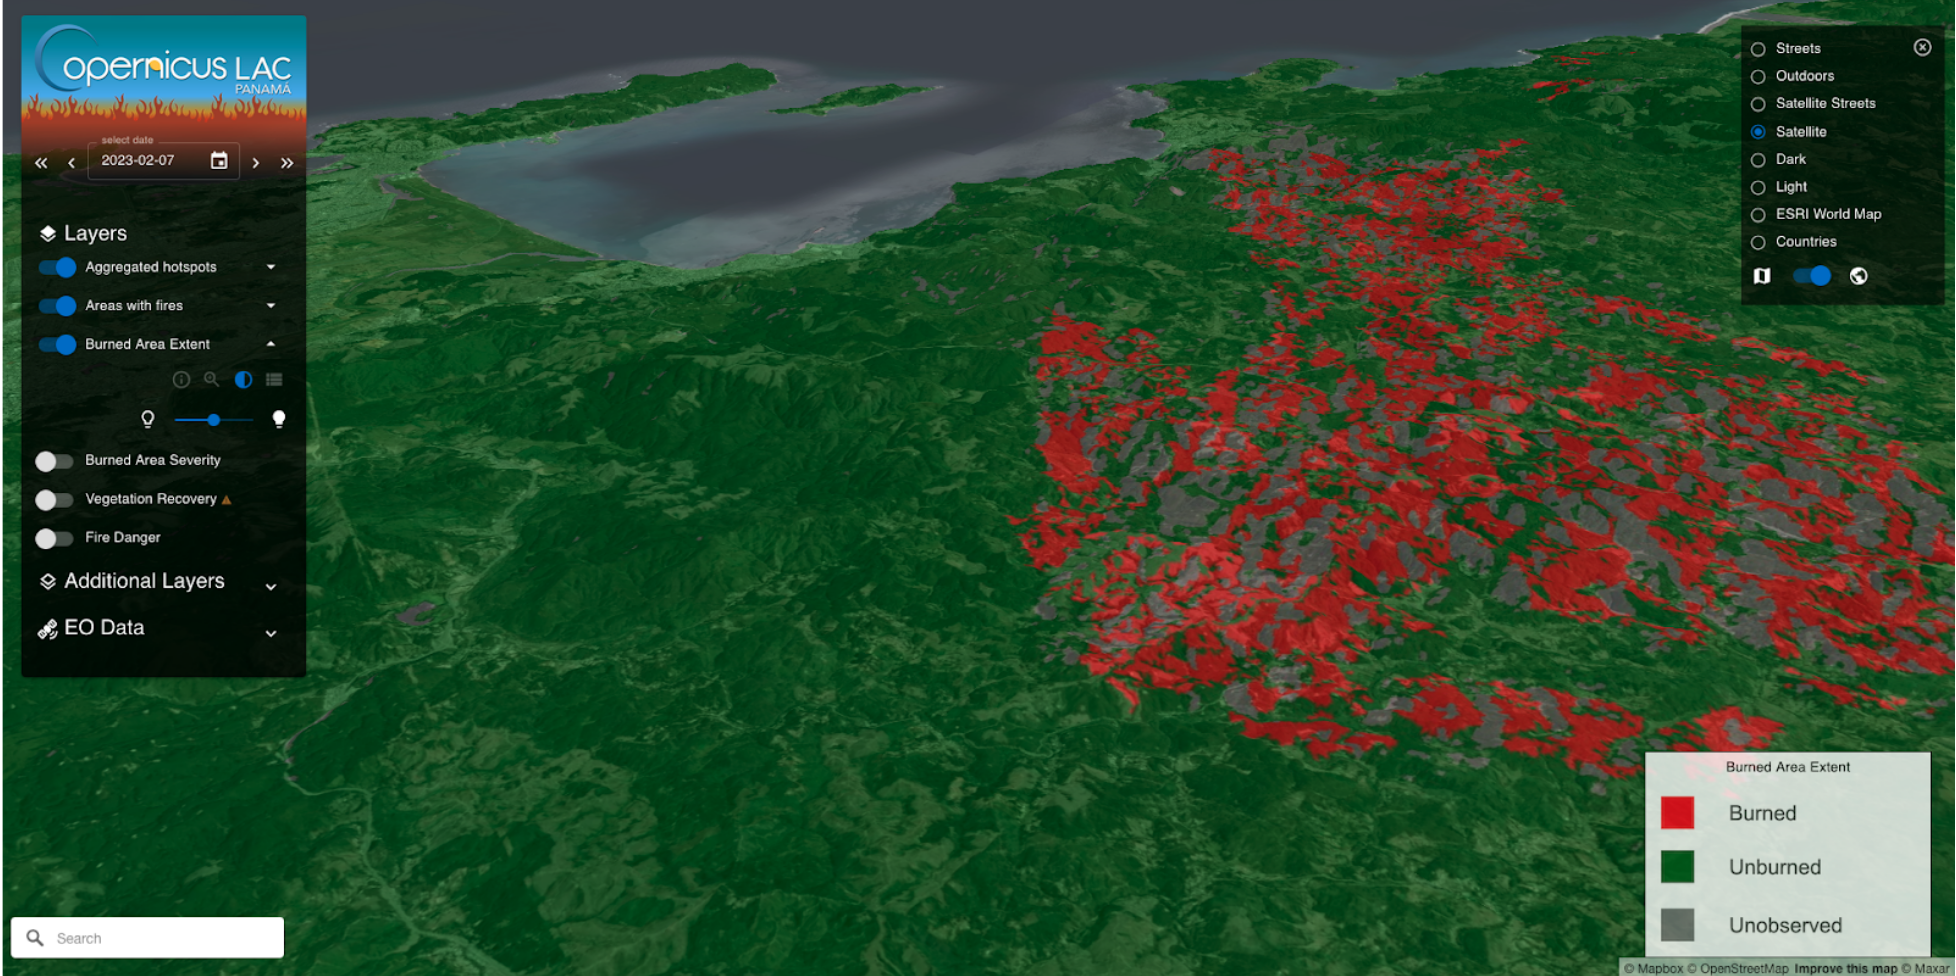
In the Copernicus LAC Platform, the BAM workflow requires as input a date from which the monitoring shall start (e.g. 1st February 2025) and an Area of Interest (AOI) (e.g. the entire Colombian territory).
After that a calendar component of the processing chain, which is a feature in the processing chain that is responsible for time-based scheduling and automation, regularly searches and ingests EO data from the Sentinel-3 SLSTR L1B collection of the Copernicus Data Space Ecosystem (CDSE). After this search, the platform harvests this data via APIs or direct access to the catalogues and automatically ingests and calibrates the EO data. The ingestion and calibration of Sentinel-3 SLSTR is performed continuously at continental scale over a wide area of interest defined within the LAC region.
For each Sentinel-3 SLSTR calibrated dataset available in the catalogue the hotspot detection processor is then triggered. Hotspots are then aggregated using a spatial filter to identify significant clusters of hotspots. Each cluster is then used to identify areas with fires over the whole region of interest. An area with fires consists of the land covered by a Sentinel-2 tile footprint intersecting clusters of aggregated hotspots. Over this area the ingestion of pre- and post-event Sentinel-2 L2A data is then automatically triggered by the system. In particular the Copernicus LAC Platform is able to ingest and calibrate all the S2 L2A acquisitions available in a configurable temporal period before the first hotspot seen over the tile and after the last one registered. The same component also searches for VIIRS S-NPP hotspots from the NASA FIRMS service within the area of the Sentinel-2 tile.
After the pre-processing of all the needed Sentinel-2 and VIIRS data is accomplished, the system automatically activates the burned area mapping module. This module employs an adapted version of the FireCCISFD20 algorithm (Roteta et al, 2021)1, replacing the pre-fire image with a multitemporal composite to mitigate the effects of persistent cloud cover. Additional adjustments have been made to adapt the processing chain to the service execution framework and the configuration of the servers. At each overpass of the Sentinel-2 satellite the BAM algorithm delineates burnt areas using multiple spectral indexes based on SWIR and NIR reflectance values (employed indexes are described in the section about the workflow). In addition, the algorithm uses VIIRS S-NPP hotspots as ancillary information to confirm the burned areas from the spectral indexes. From this stage an approach based on initially burned statistics is then applied to extract the burned area probability. A thresholding and binarization of the probability produces the burned area extent, and over this delineation the burned area severity is computed, using the Relativized Burn Ratio (RBR) from Parks et al., 20142.
The BAM service generates in output hotspots from Sentinel-3 SLSTR data, and burned area maps (probability, extent and severity) from Sentinel-2 data.
Note
Burned Area Mapping (BAM) service
Frequency: Daily for hotspots and 5 days for burned area maps.
Spatial coverage: depending on the availability of resources, the area of interest will be selected with the final user. The system is potentially extendible to the whole LAC region.
Temporal coverage: The Sentinel-2 ingestion stops when there are no more hotspots detected. The monitoring mode will be up and running in a demo version for at least 3 consecutive months. For the operational phase, the temporal coverage of such monitoring is still to be defined.
Constraints: availability of EO products from data providers (CDSE, and NASA FIRMS service).
Workflow
The schema shown in the below figure describes the high-level workflow of the BAM service.
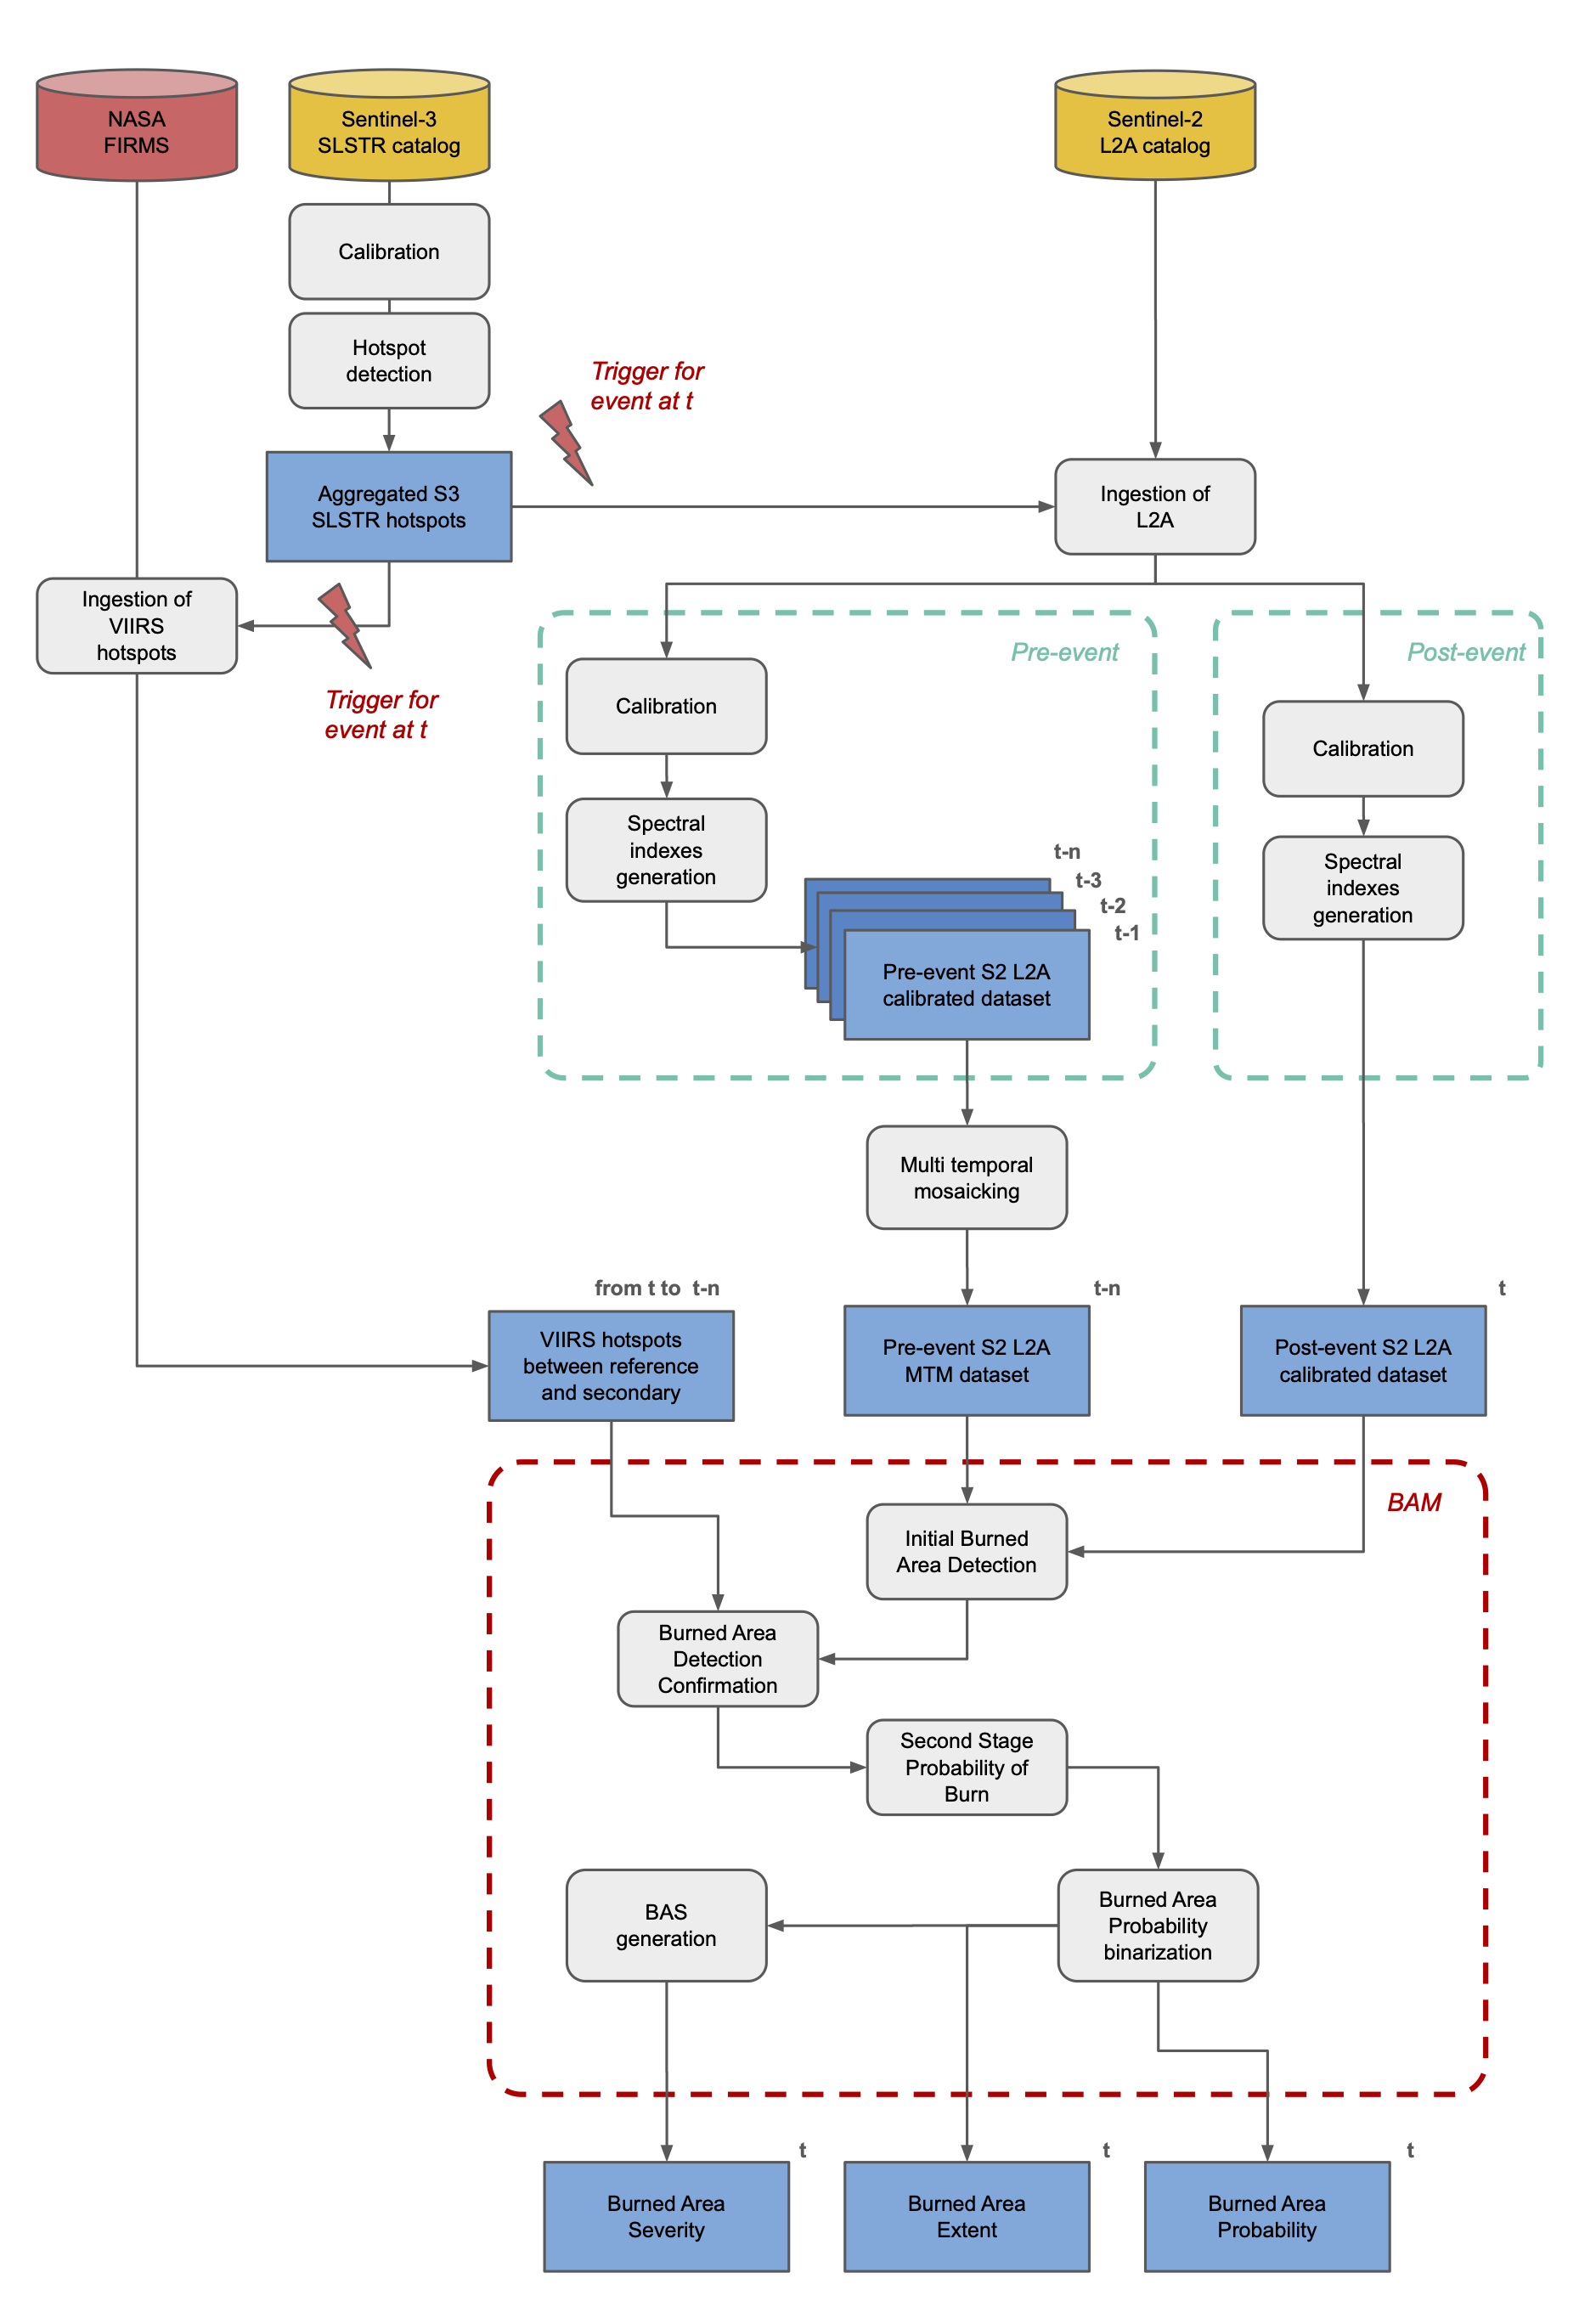
A detailed description of each step of the chain is given in the below sections.
Sentinel-3 calibration
This step is about the calibration of Sentinel-3 SLSTR RBT data3. Sentinel-3 SLSTR L1B RBT calibrated datasets are derived for both ascending and descending passes. VIS and SWIR assets are computed on a 0.5 km grid, and measurements are expressed in TOA reflectances. For thermal IR and fire channels at 1 km res the radiometric measurements are expressed in Top Of Atmosphere (TOA) brightness temperatures. The calibrated dataset also includes a land cover single band asset derived from the ESA CCI 2020 Land Cover dataset4. More information about the calibration of Sentinel-3 SLSTR L1B data can be found here.
Concerning the visualization of this EO data in the map, find here more information about the layer derived from the Sentinel-3 SLSTR RBT calibrated data.
Note
In the current configuration (see default values of BAM service parameters in Table 1) both Sentinel-3 SLSTR acquisitions in ascending pass (nighttime) and descending pass (Daytime) are being considered.
Sentinel-3 hotspot aggregation
In this step the service derives aggregated hotspots from the Sentinel-3 SLSTR L1B calibrated data.
Hotspots are derived from Sentinel-3 SLSTR L1B RBT calibrated datasets acquired on ascending passes (night-time). The algorithm returns the detection of active fires of the entire scene as a binary mask (No-Fire=0, Hotspot=1) at 1 km resolution. The Sentinel-3 SLSTR Hotspot detection processor implements a simple algorithm to identify pixels containing one or more active fires at the time of the satellite overpass. The algorithm evaluates both absolute values of brightness temperature at 3.74μm and significant increases of these values in comparison to the one observed at 10.85μm (Giglio et al., 2003)5.
In the first stage the processor evaluates pixels to be excluded from the hotspot detection by applying conditions based on brightness temperature values, cloud coverage and land cover data. Pixels from the F1 band having a brightness temperature lower than 265 K are not considered from night-time Sentinel-3 SLSTR acquisitions. After that valid pixels are then identified by taking only the ones not cloudy and where the ESA CCI Land Cover 2020 dataset4 does not classify the land as: urban, bare soil, water, permanent snow and ice. Since MIR bands of SLSTR are the most sensitive to the presence of actively burning fires (ESA OPT-MPC, 2023)3, the algorithm initially identifies very bright pixels in the F1 channel data which are the ones containing actively burning fires due to their elevated brightness temperatures. The initial test considers only pixels from the F1 band having a brightness temperature higher than 325 K (Kings College London, 2012)6. Later, to eliminate warm background only the pixels having F1 – F2 value higher than 18 K are taken as candidate hotspots.
After the hotspots detection, the processor then derives clusters of aggregated hotspots using the results obtained from Sentinel-3 SLSTR night-time passes. The algorithm returns a STAC item with the spatially filtered single band binary asset derived from the hotspot one using the Sieve algorithm. It also returns a polygon vector for each cluster of aggregated hotspots derived from the filtered asset. Such polygons are given in a single file in GeoJSON format.
Concerning the visualization of this product in the map, find here more information about the layer derived from the Sentinel-3 hotspots product.
Sentinel-2 Calibration and generation of spectral indexes
This part of the chain is dedicated to the creation of Sentinel-2 MSI L2A calibrated datasets. VIS / SWIR assets are given at native resolutions (10 m, 20 m), and measurements are expressed in TOA reflectances. The Scene CLassification (SCL) product from sen2cor7 is also offered as a single band asset at 20m spatial resolution. The overview asset is a true color composite. During the ingestion of Sentinel-2 L2A products the SCL product is harvested and offered as single band asset in all the Sentinel-2 L2A calibrated datasets. The Normalized Difference Vegetation Index (NDVI)8, the Mid-Infrared Burn Index (MIRBI) 9, and the Normalized Burned Ratio 2 (NBR2) 10 are generated in a systematic fashion as part of the optical calibration workflow and offered as single band assets in all the Sentinel-2 L2A calibrated datasets. More information about the spectral index generation within the optical calibration processor can be found here.
Concerning the visualization of this EO data in the map, find here more information about the layer derived from the Sentinel-2 MSI L2A calibrated data.
Sentinel-2 Multitemporal mosaicking
This step derives a multitemporal mosaic from multiple Sentinel-2 MSI L2A calibrated datasets acquired before an on-going wildfire event over a single Sentinel-2 tile ID (e.g. T10TFK). This artificial multispectral image is derived with a temporal mosaicking driven by the highest NDVI value amongst a time series. An automated workflow searches for a pre-defined number of Sentinel-2 L2A images acquired before the beginning of the wildfire event that have a cloud coverage lower than a certain threshold. Later a stack of S2 L2A images acquired at different times is created, and the reflectance values of the greenest pixels in the temporal period are extracted from the image stack. Then the multitemporal image mosaic for blue, green, red, nir, swir16, swir22, and SCL single band assets is created from image stack.
Concerning the visualization of this EO data in the map, find here more information about the layer derived from the Multitemporal Mosaic product.
Ingestion of VIIRS hotspots
From the NASA FIRMS service11 the BAM service ingests Near Real Time (NRT) active fires from the VIIRS S-NPP satellite at 375 m res. These are then cropped at the extent of a Sentinel-2 tile and are aggregated in time using the 5-days revisit of Sentinel-2A/B. In this aggregation, only hotspots having nominal or high confidence values are taken (the ones having low confidence level are excluded). Finally, VIIRS S-NPP NRT hotspot vector files are dilated a with a diameter of 1 km (Roteta, et al., 2011)1 and then rasterized to a binary raster having the same grid, extent and spatial resolution of a Sentinel-2 image.
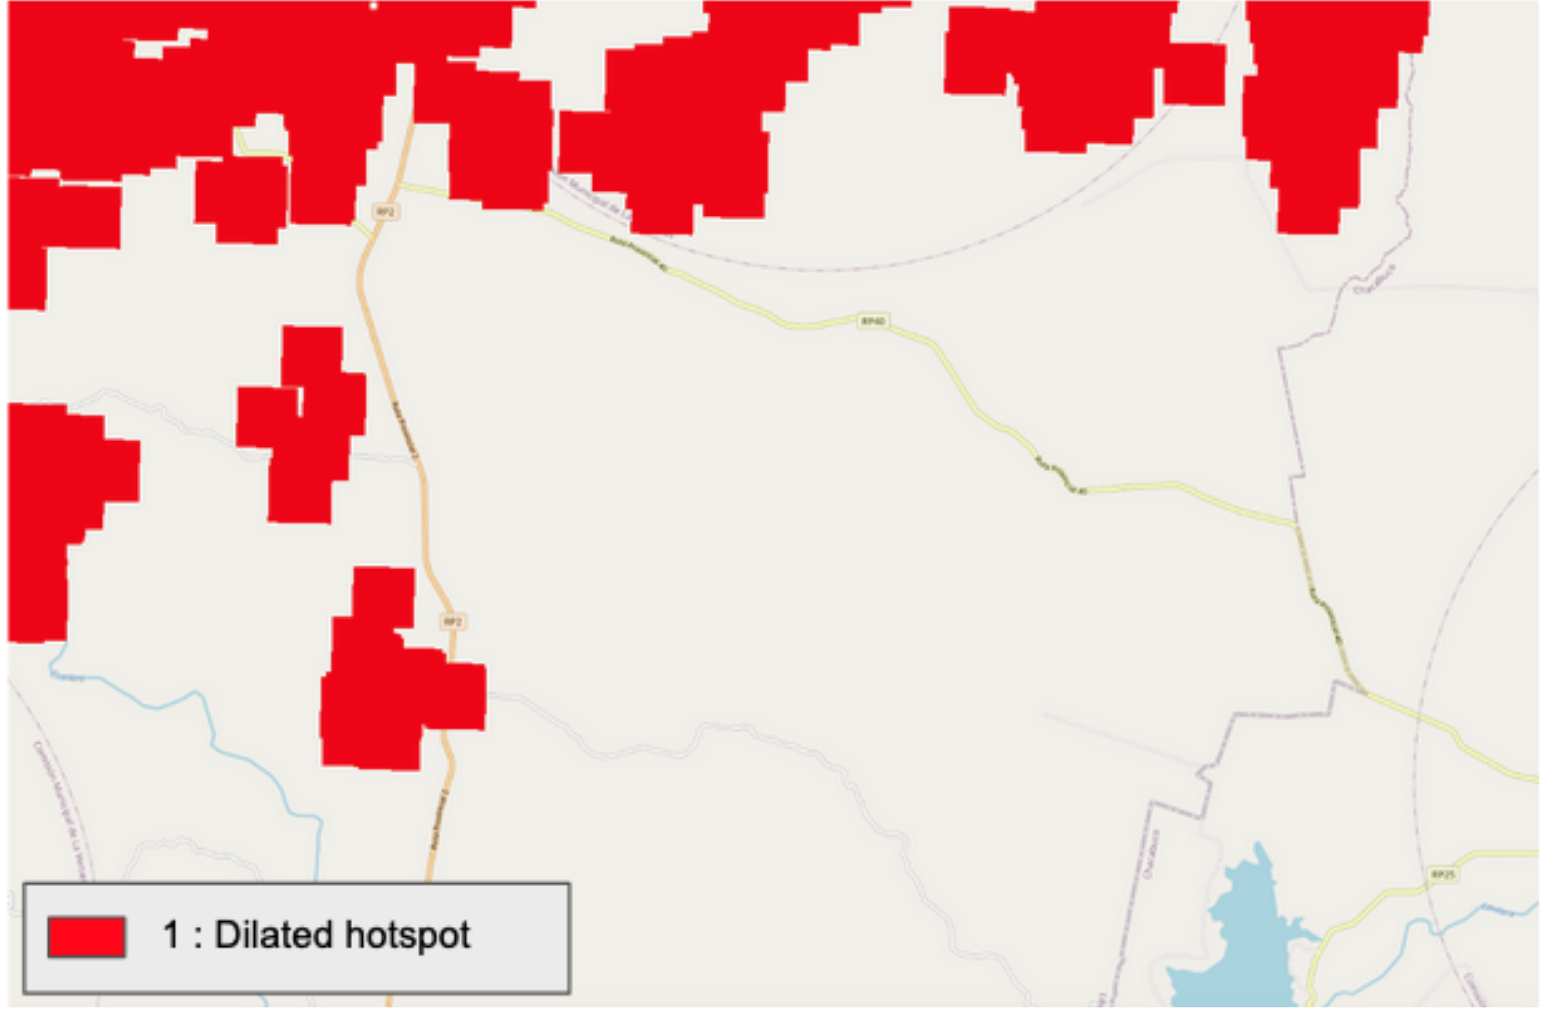
Concerning the visualization of this product in the map, find here more information about the layer derived from the VIIRS hotspots product.
Initial burned Area Detection
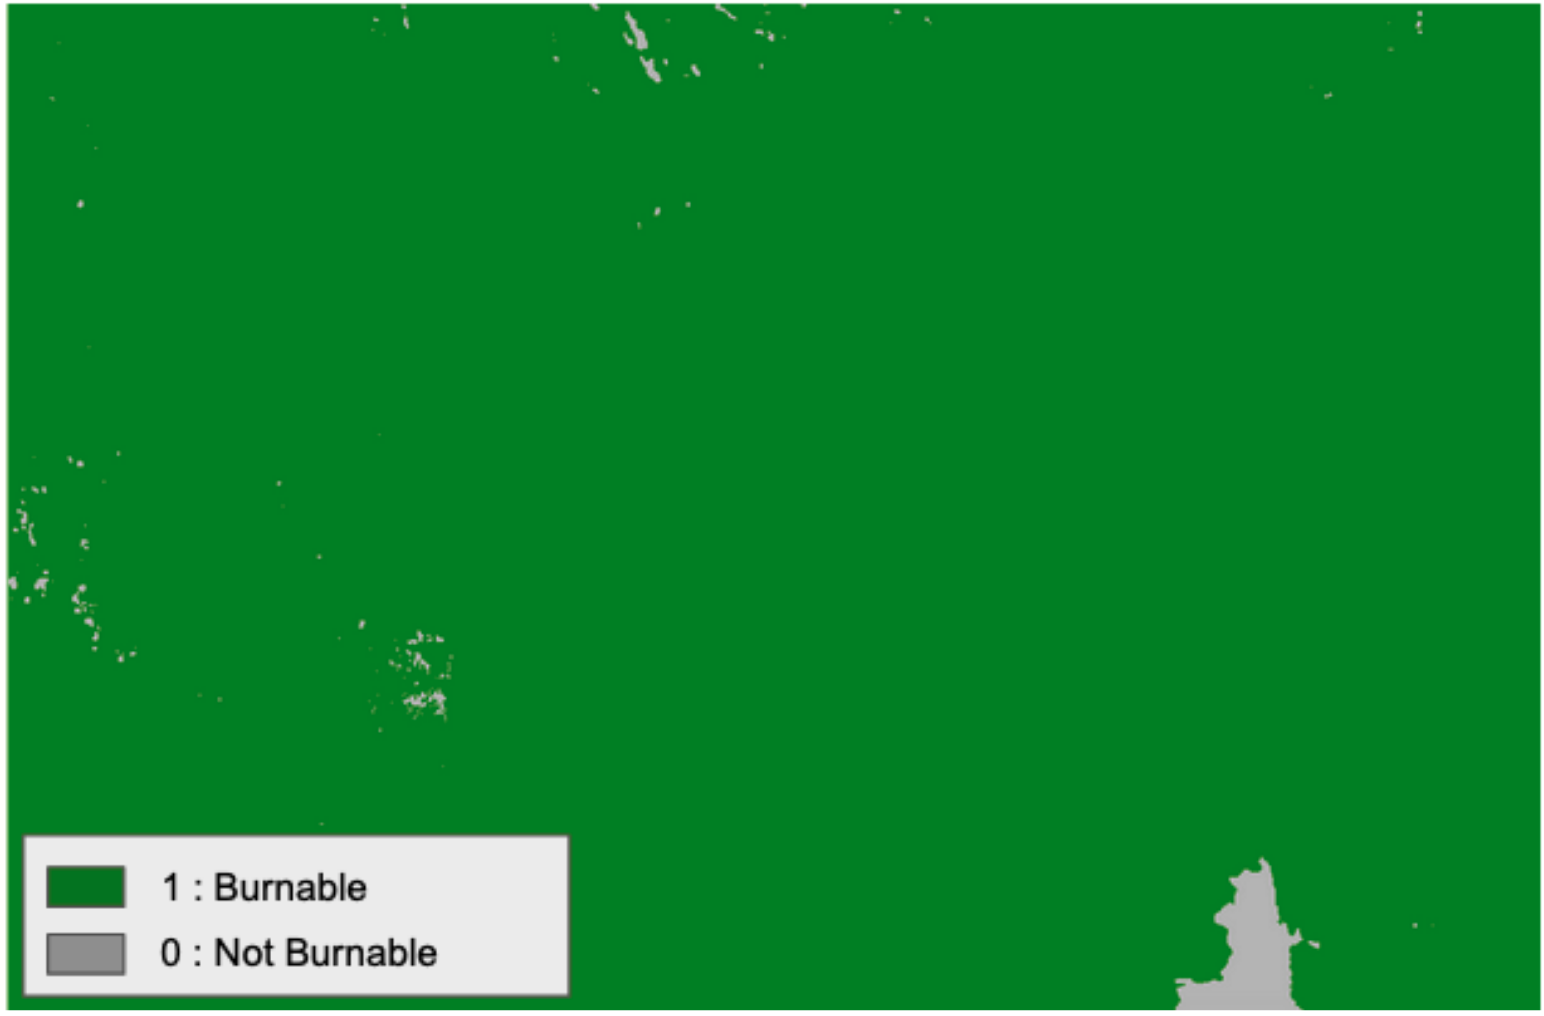
This step of the chain starts with the computation of the not-burnable mask from Sentinel-2 SCL assets before and after the event. A not-burnable mask is defined for each pair of images compared to MTM and the post-event image. A pixel of a Sentinel-2 scene is defined as burnable only if it is not classified as 0 (No data), 1 (Saturated or defective), 6 (Water), 8 (Cloud medium probability), 9 (Cloud high probability), 10 (Thin Cirrus), and 11 (Snow) in both the SCL assets of reference MTM and current calibrated dataset. For classes 8, 9 and 10 a dilation of 5 pixels is applied to exclude further SCL pixels along the edges of clouds. Low probability clouds and dark areas (SCL class 2) are not used because it would mask a very significant quantity of burned areas.
Note
The Burnable Mask product is not available for visualization in the GUI.
After the computation of the Burnable Mask and the masking of VIS/SWIR assets from both MTM and the post-event datasets, the Initial Burned Area product is derived from the pair of images using the criteria described in Roteta et al, 20211 that are listed in the below 6 rules.
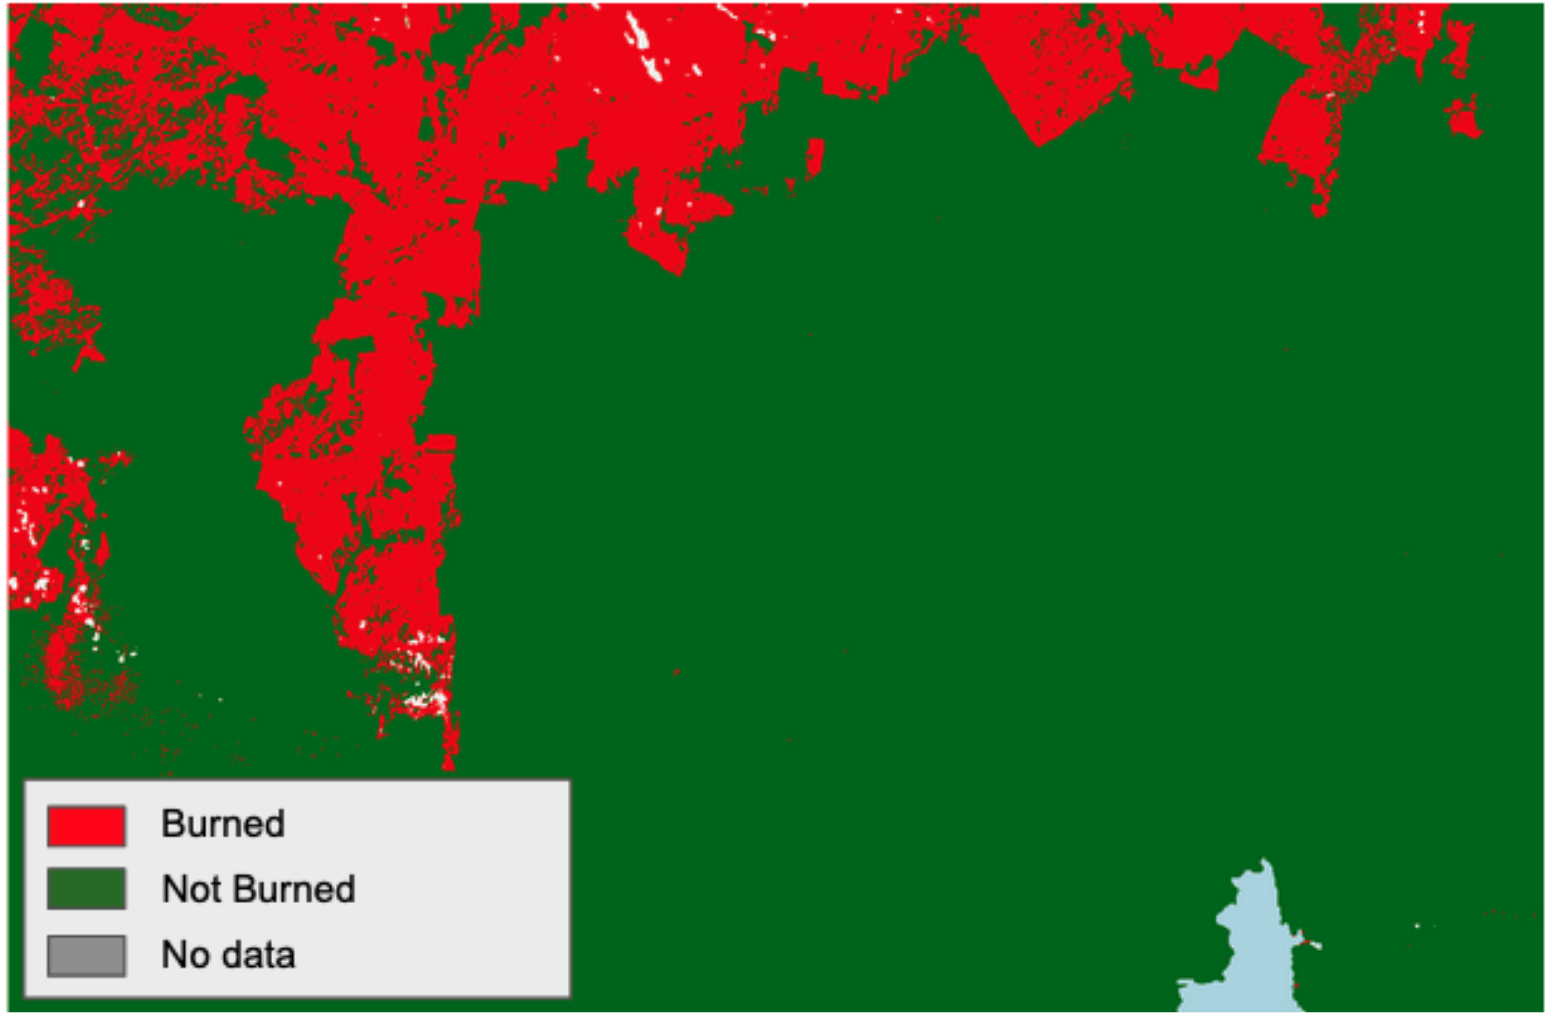
The Initial Burned Area product shows in red burned areas, in green burnable areas and in grey where no valid observations were available to run the algorithm. Raster values are: 0 – Unobserved, 1 - Not burned, 2 - Burned. More information about the layer derived from the Initial Burned Area product can be found here.
Burned Area Detection Confirmation
This step employs the Initial Burned Area and the rasterized VIIRS S-NPP active fires dilated at 1km resolution derived from NASA FIRMS. Initially Burned Areas are then crossed with the aggregated VIIRS hotspot raster in order to have a confirmation that those regions are really burned, obtaining the Initial Burned Area Confirmed product.
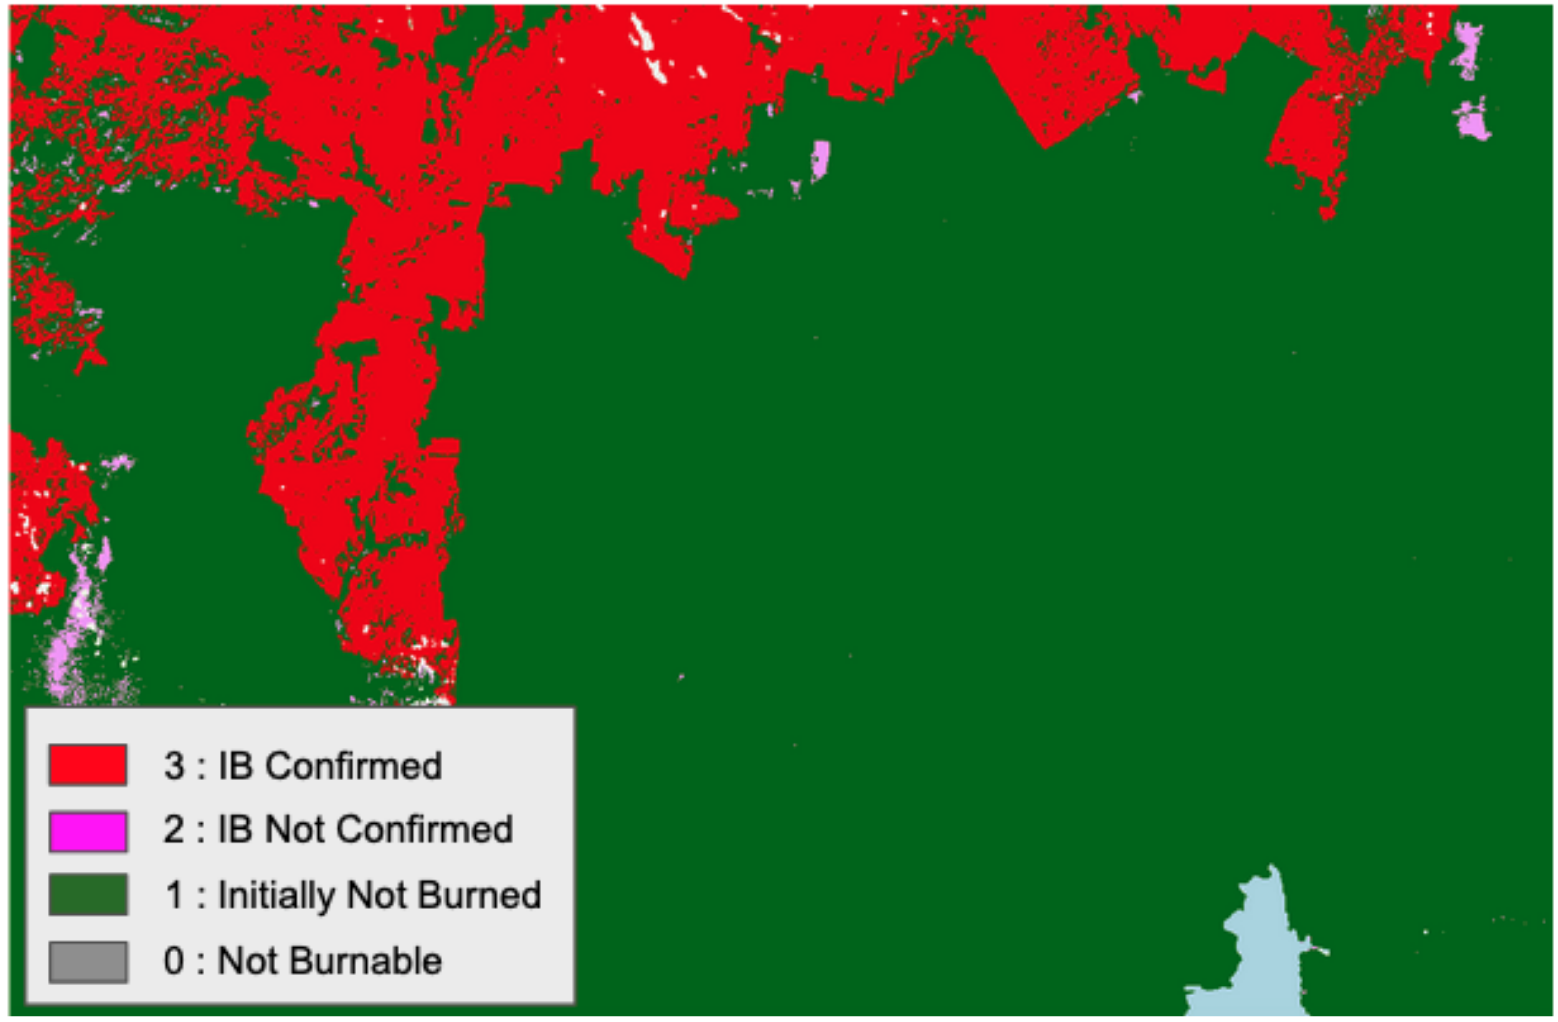
Warning
The Initial Burned Area Confirmed product is not available for visualization in the GUI.
Second Stage Probability of burn
After the confirmation of burned areas, a two-phase strategy based on the statistics from the Initial Burned Area, and the Initial Burned Confirmed Area products is then applied to balance omission and commission errors (Bastarrika, et al., 2011)12. The first one is about the identification of Burned seeds, and later the employment of a Second Stage Probability of Burn (SEPB) to derive the final product. In this step of the chain, burned seeds are computed using basic statistics derived from the Initially Burned Confirmed regions.
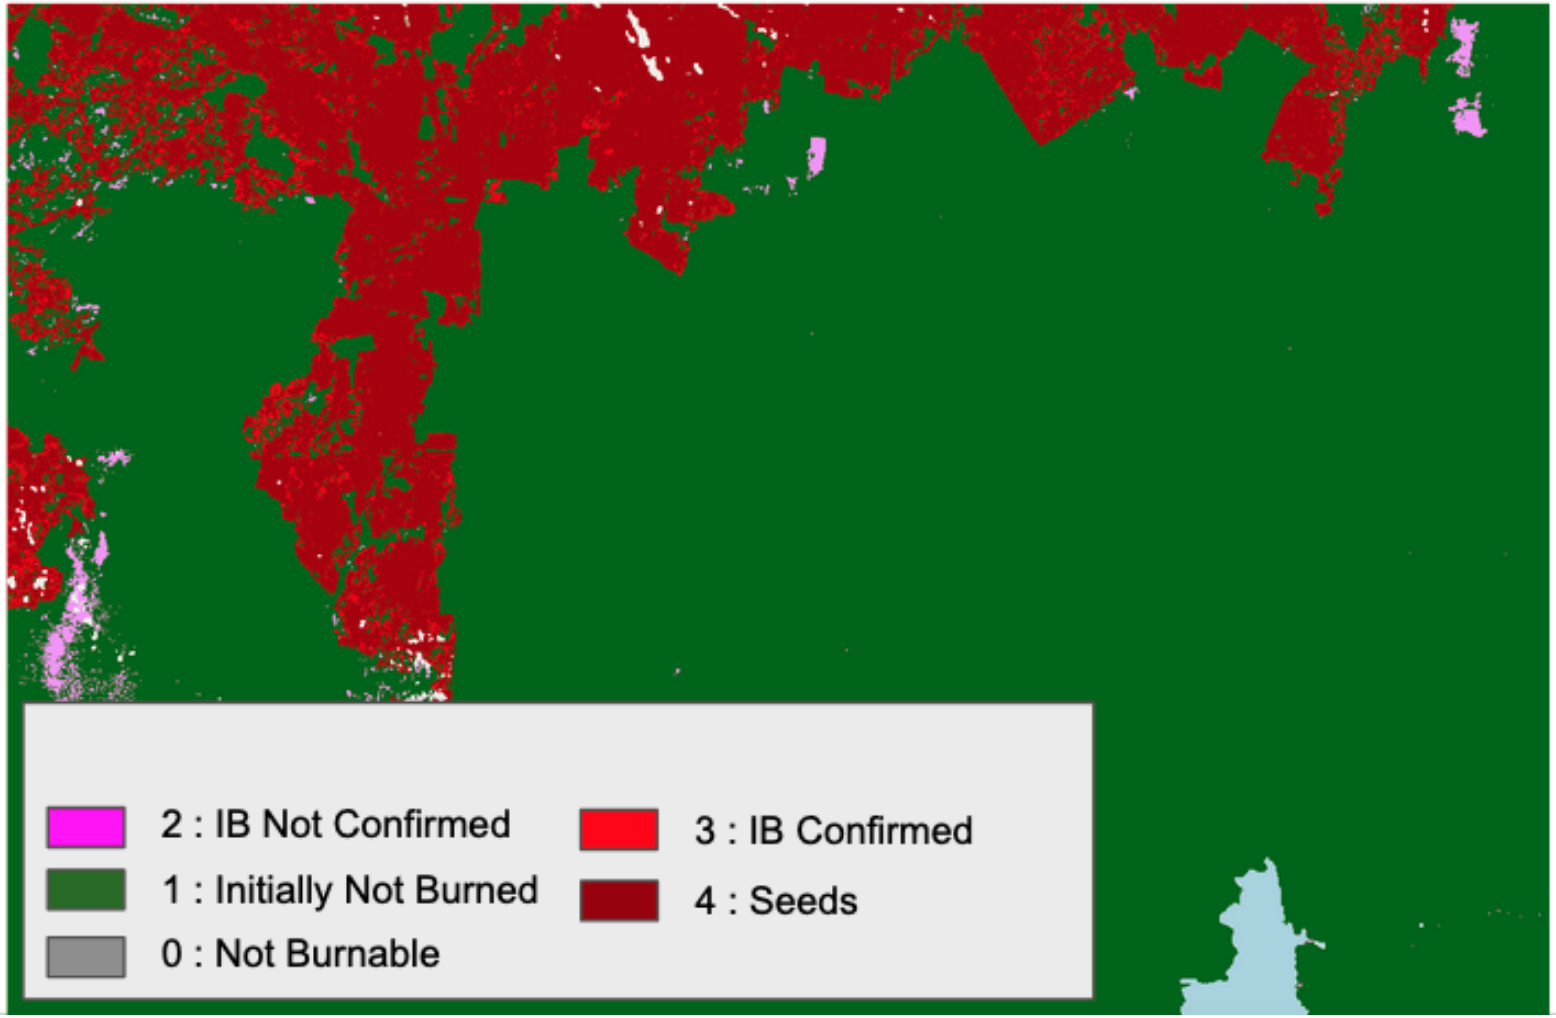
Warning
The burned seeds product is not available for visualization in the GUI.
As described in Roteta et al. 2021 1: the 5th percentile for the variables whose burned values are higher than the not burned ones, and the 95th percentile for the opposite case. This approach relies on two variables, the MIRBI and NBR2 multi-temporal difference, where a sigmoid membership function is computed based on Inital Burned Area, and Inital Burned Area Confirmed. The multiplication of both probability functions, called SEPB, is used to derive the Burned Area Probability product. Find more information in Roteta et al. 2021 1.
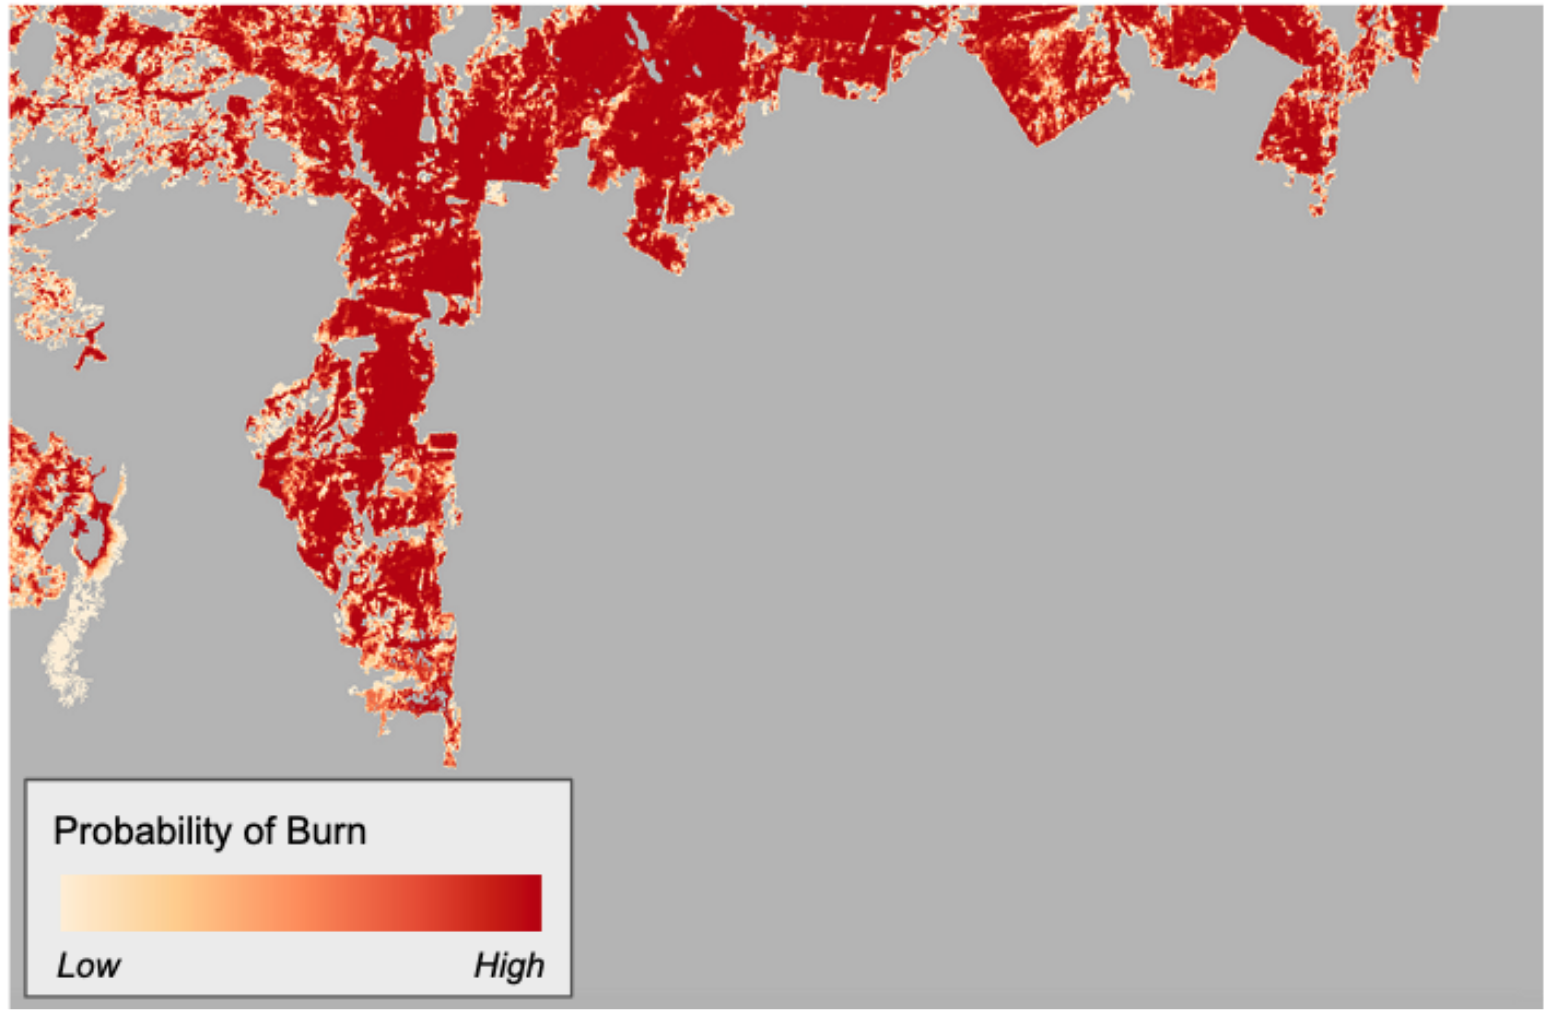
The Burned Area Probability product is shown in the UI using a green to red color gradient map applied to its percentage values. More information about the layer derived from the Burned Area Probability product can be found here.
Note
Burned Area Probability provides a level of confidence reached by the burned area mapping (pixels having a moderate to high Burned Area Probability value are more likely to be really burned).
Burned area probability binarization
The final product is derived from the binarization of the Burned Area Probability and provides the Burned Area Extent. Pixels having a Burned Area Probability above 50% are mapped as burned in the Burned Area Extent product.
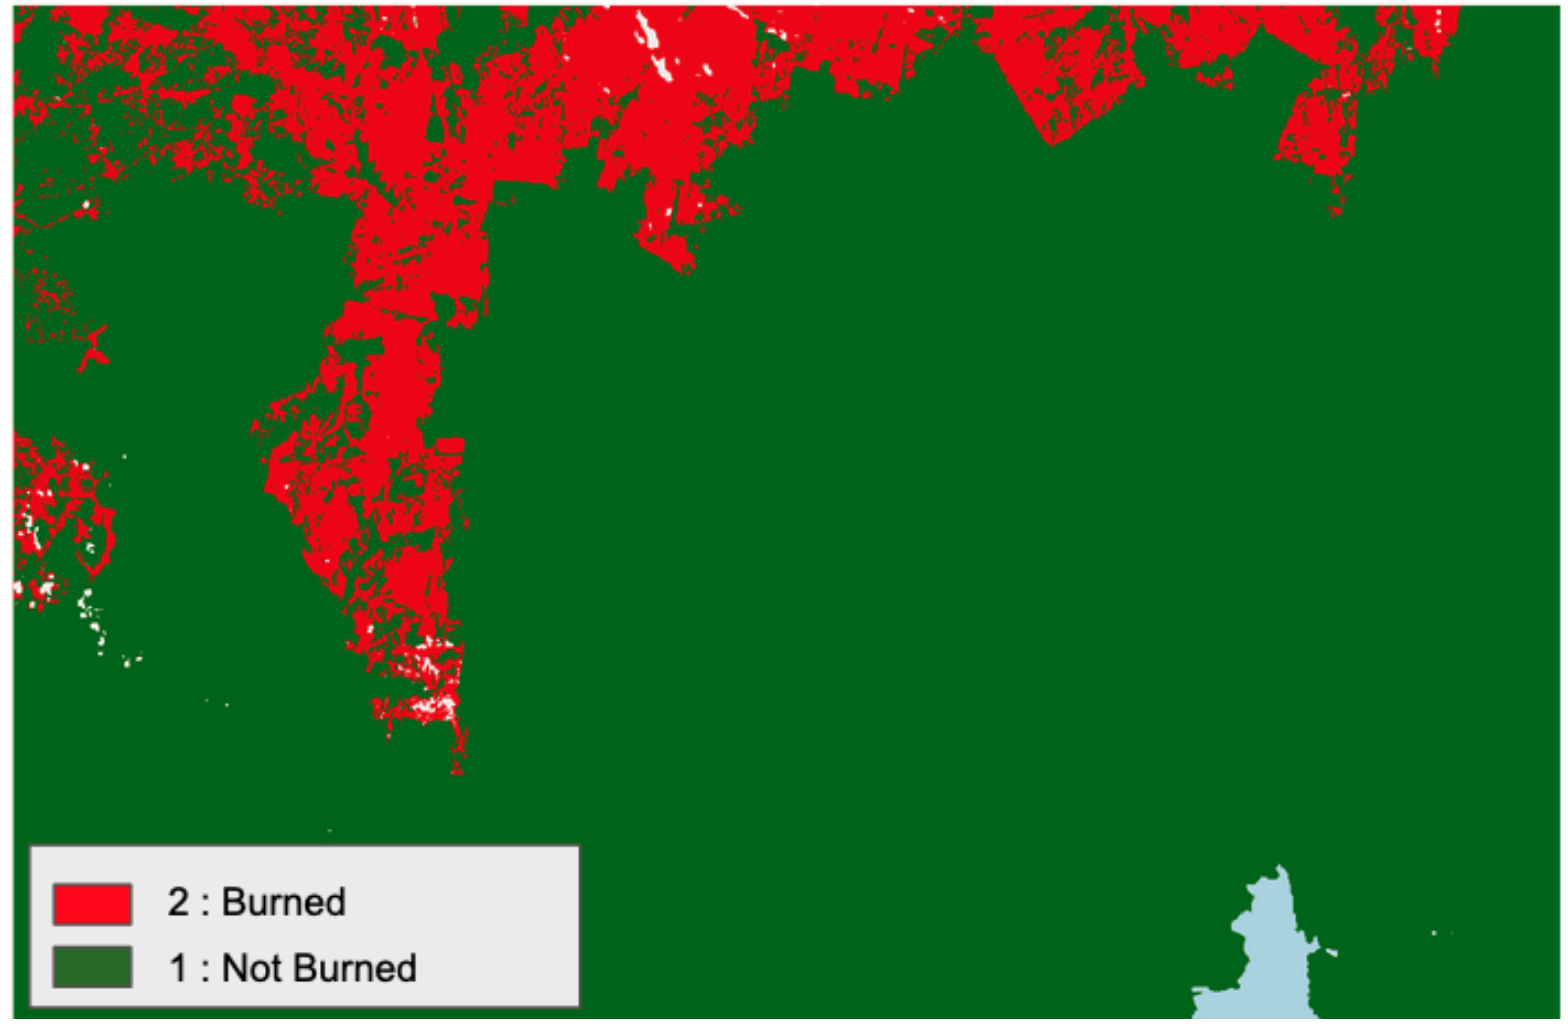
The BAM service derives two types of Burned Area Extent products:
-
the Current Burned Area Extent product,
-
and the Total Burned Area Extent product.
The first product represents the Burned Area Extent at 10m resolution derived from the current post-event Sentinel-2 L2A calibrated data. The second product is the result of the temporal aggregation of the Current Burned Area Extent with all the previous ones derived by the BAM algorithm obtained since the beginning of the wildfire monitoring. Both of them are generated at each overpass of Sentinel-2 data over the monitoring tile and are given at 10m resolution.
As for the Initial Burned Area, the Burned Area product shows in red burned areas, in green burnable areas and in grey where no valid observations were available to run the algorithm. Raster values are: 0 – Unobserved, 1 - Not burned, 2 - Burned.
More information about the layer derived from the Current Burned Area product can be found here.
More information about the layer derived from the Total Burned Area product can be found here.
Burned Area Severity generation
This step computes the Burned Area Severity (BAS) over the pixels classified as burned in the Burned Area Extent product. The BAS product consists of a raster with a color gradient based on RBR values. The burn severity describes how the fire intensity affects the functioning of the ecosystem in the area that has been burnt. The observed effects often vary within the area and between different ecosystems (Keeley, 2009) 13. The burn severity can also be described as the degree to which an area has been altered or disrupted by the fire 14. The Burned Area Severity Analysis methodology integrated into this service is based on the Normalized Burn Ratio (NBR) index (Key and Benson, 2006) 15,
the delta Normalized Burn Ratio (dNBR) from Miller and Thode, 201416,
and the Relativized Burn Ratio (RBR) from Parks et al., 20142.
Similarly to the Burned Area Extent, the BAM service derives two types of Burned Area Severity products:
-
the Current Burned Area Severity product,
-
and the Total Burned Area Severity product.
The first product represents the Burned Area Severity at 10m resolution derived from the current post-event Sentinel-2 L2A calibrated data. The second product is the result of the temporal aggregation of the Current Burned Area Severity with all the previous ones derived by the BAM algorithm obtained since the beginning of the wildfire monitoring. Both of them are generated at each overpass of Sentinel-2 data over the monitoring tile and are given at 10m resolution.
The Burned Area Severity product consists of a yellow to red color gradient based on RBR values above 0.3. Yellow colors represent low burned area severity values, whereas red colors represent high ones.
More information about the layer derived from the Current Burned Area Severity product can be found here.
More information about the layer derived from the Total Burned Area Severity product can be found here.
Warning
In the BAM service the masking of water and clouds are based on the related classes contained in the SCL product of Sentinel-2 L2A product.
Input
The BAM service requires in input:
-
Sentinel-3 SLSTR L1 RBT data: all available daytime and nighttime acquisitions acquired over the ROI.
-
Sentinel-2 MSI L2A data: a time series of ingested Sentinel-2 L2A acquisitions acquired over significant clusters of hotspots before and after the event from t to t-n, where “t” is the sensing time of the latest available Sentinel-2 acquisition over an area and “n” is the number of days of distance from the oldest reference pre-event image (e.g. n=15 if the oldest pre-event image is acquired 15 days before the event image).
-
VIIRS S-NPP NRT hotspots: all VIIRS hotspots detected over the footprint of each ingested Sentinel-2 image gathered from the NASA FIRMS service under the VIIRS Suomi-NPP Near Real-Time collection.
Parameters
The BAM service requires a specified number of mandatory parameters. Table 1 describes these parameters. These are not defined by the user via the GUI but can be defined by the service operator within a configuration file before the triggering of the BAM service workflow.
| Parameter | Description | Required | Default |
|---|---|---|---|
| Date | Date from which the service shall be triggered. It can be a present, past or future date. From the inserted date a calendar will trigger the automatic ingestion of Sentinel-3 SLSTR data and therefore all the following steps in the chain. | YES | |
| Area of interest | Area of interest to be covered by the service in WKT (e.g. extent of all Colombia) | YES | |
| Orbit direction for S3 SLSTR | Orbit direction/s for Sentinel-3 SLSTR acquisition to be ingested. Options are: ASC, DESC, or ALL. | NO | ASC |
| Number of pre-event images for MTM | Maximum number of pre-event images used for the creation of multi-temporal mosaic | NO | 4 |
| Max cloud coverage of pre-event images | The maximum percentage of cloud coverage in the valid pre-event images to be used for MTM | NO | 20 |
| Minimum number of burnable pixels | A minimum number of burnable pixels required for SEPB | NO | 12500 |
| CLM classes for the burnable mask | Employing the thin CLM cirrus class in the computation of the burnable mask | NO | YES |
| Minimum IBAD area considered | A threshold size in hectares defining the minimum area of burned area patches considered in the burned area confirmation | NO | 30 |
| S3 hotspot spatial filtering | A threshold size in pixels to be used in the Sieve Spatial Filtering of Sentinel-3 hotspots to derive aggregated hotspots (significant clusters of hotspots) | NO | 3 |
| BAM spatial filtering | A threshold size in pixels to be used in the Sieve Spatial Filtering of burned pixels in the output BAM for the computation of the total extent in hectares | NO | 30 |
| BAM binarization threshold | The threshold value as percentage to be used when doing the binarization of the Burned Area Probability product and generate the Burned Area Extent map | NO | 50 |
| S2 ingestion duration for VRM | How long Sentinel-2 data shall be ingested to monitor vegetation recovery. This parameter is expressed as the number of days after the end of the event. | NO | 365 |
| S2 ingestion frequency for VRM | Frequency in number of days to be used when ingesting Sentinel-2 L2A data over a tile after the wildfire event is ended | NO | 15 |
| Wildfire status check | After how many days without a detected hotspot it is required to stop the BAM workflow over a tile on fire | NO | 15 |
Output
The BAM service provides in output the 13 products listed in the below sections.
Main BAM products
-
PRODUCT A - Sentinel-3 SLSTR aggregated hotspots: spatial aggregation of detected hotspots at 1km resolution derived from Sentinel-3 SLSTR RBT calibrated data. This product provides binary single band raster having the following values: 1=clusters-of-aggregated-hotspots, 0=other. Format: COG. Frequency: daily.
-
PRODUCT B - Areas with fires: vector file mapping the portions of the land where the Burned Area Mapping (BAM) service is currently active to monitor a fire event. The areas contained in this product correspond to Sentinel-2 image footprints intersecting aggregated Sentinel-3 SLSTR hotspots. This product can be used to quickly identify the areas with active fires for which burned area products are or will be generated by the BAM. Frequency: 5 days.
-
PRODUCT C - Total Burned Area Extent: temporal aggregation of Burned Area Extent since the beginning of the event at 10m resolution derived from pre- and post-event Sentinel-2 L2A calibrated data. Burned areas are derived using an adapted version of the FireCCISFD20 algorithm (Roteta et al, 2021) employing Mid-Infrared Burn Index (MIRBI), and Normalized Burned Ratio 2 (NBR2) indexes from Sentinel-2 and VIIRS S-NPP hotspots. This product is the synthesis of all burned area extent products derived by the BAM algorithm since the beginning of the wildfire monitoring. The Total Burned Area Extent product provides single band raster having the following values: 0 – Unobserved, 1 - Not burned, 2 - Burned. Frequency: 5 days.
-
PRODUCT D -Total Burned Area Severity: temporal aggregation of Burned Area Severity since the beginning of the event at 10m resolution derived from pre- and post-event Sentinel-2 L2A calibrated data. This product is the synthesis of all burned area severity products derived by the BAM algorithm since the beginning of the wildfire monitoring. BAS is derived using the Relativized Burn Ratio (RBR) index and is computed only over the pixels classified as burned in the total burned area product. This product provides single band raster with RBR values above 0.3. Frequency: 5 days.
Additional BAM products
-
PRODUCT E - VIIRS Hotspots: detected hotspots at 1km resolution obtained from a daily composite of Near Real Time (NRT) active fires from the VIIRS S-NPP satellite offered by the NASA FIRMS service. This product provides a map showing hotspots in red. This product provides binary single band raster having the following values: 1=hotspot, 0=other. Format: COG. Frequency: daily.
-
PRODUCT F - Sentinel-3 SLSTR Hotspots: detected hotspots at 1km resolution derived from Sentinel-3 SLSTR RBT calibrated data. The fire detection algorithm evaluates both absolute values of brightness temperature at 3.74μm and significant increases of these values in comparison to the one observed at 10.85μm. This product provides binary single band raster having the following values: 1=hotspot, 0=other. Format: COG. Frequency: daily.
-
PRODUCT G - Current Burned Area Extent: burned Area Extent at 10m resolution derived from pre- and post-event Sentinel-2 L2A calibrated data. Burned areas are derived using an adapted version of the FireCCISFD20 algorithm (Roteta et al, 2021) employing Mid-Infrared Burn Index (MIRBI), and Normalized Burned Ratio 2 (NBR2) indexes from Sentinel-2 and VIIRS S-NPP hotspots. The Current Burned Area Extent product provides single band raster having the following values: 0 – Unobserved, 1 - Not burned, 2 - Burned. Format: COG. Frequency: 5 days.
-
PRODUCT H - Current Burned Area Severity: burned Area Severity (BAS) at 10m resolution derived from pre- and post-event Sentinel-2 L2A calibrated data. BAS is derived using the Relativized Burn Ratio (RBR) index and is computed only over the pixels classified as burned in the current burned area product. The burned area severity map employs a yellow to red color gradient based on RBR values above 0.3. Format: COG. Frequency: 5 days.
-
PRODUCT I - Burned Area Probability: burned Area Probability at 10m resolution derived from pre- and post-event Sentinel-2 L2A calibrated data. The burned area probability is derived using an adapted version of the FireCCISFD20 algorithm (Roteta et al, 2021) employing Mid-Infrared Burn Index (MIRBI), and Normalized Burned Ratio 2 (NBR2) indexes from Sentinel-2 and VIIRS S-NPP hotspots. This product provides a level of confidence reached by the burned area mapping. Thus, pixels having a Burned Area Probability above 50% are mapped as burned in the Current Burned Area Extent product. The Burned Area Probability product provides a single band raster having percentage values from 0% (low) to 100% (high). Format: COG. Frequency: 5 days.
-
PRODUCT J - Initial burned area: initial Burned Area Extent from Sentinel-2 L2A calibrated data at 10m resolution. This is an intermediate product derived in the initial stage of the FireCCISFD20 algorithm (Roteta et al, 2021) based only on Mid-Infrared Burn Index (MIRBI), and the Normalized Burned Ratio 2 (NBR2) indexes. The Initial Burned Area product provides a single band raster having the following values: 0 – Unobserved, 1 - Not burned, 2 - Burned. Format: COG. Frequency: 5 days.
EO data products
-
PRODUCT K - Sentinel-3 SLSTR L1B: TOA radiances and Brightness temperature at 500m and 1km resolution derived from Sentinel-3 SLSTR RBT calibrated data. Multiple single band raster file, one for each CBN visualized in the layer seen in the map. Format: COG. Frequency: daily.
-
PRODUCT L - Sentinel-2 MSI L2A: BOA reflectances at 10m resolution from Sentinel-2 L2A calibrated data acquired before or after a wildfire event. Multiple single band raster file, one for each CBN visualized in the layer seen in the map. Format: COG. Frequency: 5 days.
-
PRODUCT M - Sentinel-2 L2A Multitemporal mosaic: BOA reflectances at 10m resolution from an image mosaic at 10m resolution derived from multiple calibrated Sentinel-2 L2A datasets acquired before the wildfire event. This product is the result of an artificial reconstruction of a pre-fire image to mitigate the effects of persistent cloud cover. Multiple single band raster file, one for each CBN visualized in the layer seen in the map. Format: COG. Frequency: once per wildfire event over the S2 tile.
Service Provider
The service is developed by Terradue.
References
-
ESA (2021), "FireCCISFD20 Algorithm Theoretical Basis Document (ATBD) – Sentinel-2 Sub-Saharan Africa", Version 1, Nov. 3, 2021. Available at: https://climate.esa.int. ↩↩↩↩↩
-
Parks S. A., Dillon G. K., Miller C. A. (2014) "A New Metric for Quantifying Burn Severity: The Relativized Burn Ratio" Remote Sens. 6, no. 3: 1827-1844. DOI: 10.3390/rs6031827 ↩↩
-
ESA OPT-MPC (2023), Sentinel-3-SLSTR-Land-Handbook, Doc. Ref: OMPC.ACR.HBK.002, Issue 1.3, April 2023. Available at: https://sentinel.esa.int/documents/247904/4598082/Sentinel-3-SLSTR-Land-Handbook.pdf ↩↩
-
ESA (2021), ESA CCI/C3S Global Land Cover product 2020 (v2.1.1) Available at: www.esa-landcover-cci.org. ↩↩
-
Giglio, Louis & Descloitres, Jacques & Justice, Christopher & Kaufman, Yoram. (2003). An Enhanced Contextual Fire Detection Algorithm for MODIS. Remote Sensing of Environment. DOI: 87. 273-282. DOI: 10.1016/S0034-4257(03)00184-6. ↩
-
Kings College London (2012), Sentinel-3 optical products and algorithm definition, SLSTR ATBD Fire Product, Doc. Ref: S3-L2-SD-03-T04-KCL-ATBD, Version: 3.2, October 2012. Available at: https://sentinels.copernicus.eu/documents/247904/0/SLSTR_Level-2_Fire_ATBD.pdf/77f452ea-ee65-4f84-a9cb-cc68d1c03c6f ↩
-
ESA Sentinel-2 L2A algorithm, Scene Classification specifications. Available at: https://sentiwiki.copernicus.eu. ↩
-
Rouse J., Haas R. H., Schell J. A., Deering D. (1973), “Monitoring vegetation systems in the great plains with ERTS”, NASA. Goddard Space Flight Center 3d ERTS-1 Symp., Vol. 1, Sect. A. Available at: https://ntrs.nasa.gov. ↩
-
Trigg, S.; Flasse, S., "An evaluation of different bi-spectral spaces for discriminating burned shrub savanna", Int. J. Remote Sens. 2001, 22, 2641–2647. DOI: 10.1080/01431160110053185. ↩
-
Storey E.A., Stow D.A., O’Leary J.F. (2016), "Assessing postfire recovery of chamise chaparral using multi-temporal spectral vegetation index trajectories derived from Landsat imagery". Remote Sens. Environ. 2016, 183, 53–64. DOI: 10.1016/j.rse.2016.05.018. ↩
-
NASA FIRMS, VIIRS Suomi NPP Fires and Thermal Anomalies Day and Night, 375m. Available at: https://firms.modaps.eosdis.nasa.gov. ↩
-
Bastarrika, A., Chuvieco, E., & Martin, M.P. (2011). Automatic Burned Land Mapping From MODIS Time Series Images: Assessment in Mediterranean Ecosystems. IEEE Transactions on Geoscience and Remote Sensing, 49, 3401-3413. ↩
-
Keeley, J. E. (2009), "Fire intensity, fire severity and burn severity: A brief review and suggested usage", International Journal of Wildland Fire, 18(1), 116–126. Available at: https://pubs.er.usgs.gov. ↩
-
Key, C. H. and Benson, N. C. (2006), “Landscape Assessment (LA): Sampling and Analysis Methods”, USDA Forest Service Gen Tech. Rep RMRS-GTR-164-CD. FIREMON Fire effects monitoring and inventory System. Available at: www.fs.usda.gov. ↩
-
Miller J. and Thode A. (2007), “Quantifying burn severity in a heterogeneous landscape with a relative version of the delta Normalized Burn Ratio (RdNBR)”, Remote Sensing of Environment, 109, 66-80. DOI: 10.1016/j.rse.2006.12.006. ↩