Burned Area Mapping (BAM) tutorial
Use case
The three services that constitute the Use Case 6 (Wildfires: mapping events, danger and recovery) can be triggered over a region of interest in the LAC and by defining a date from which the wildfire monitoring shall start.
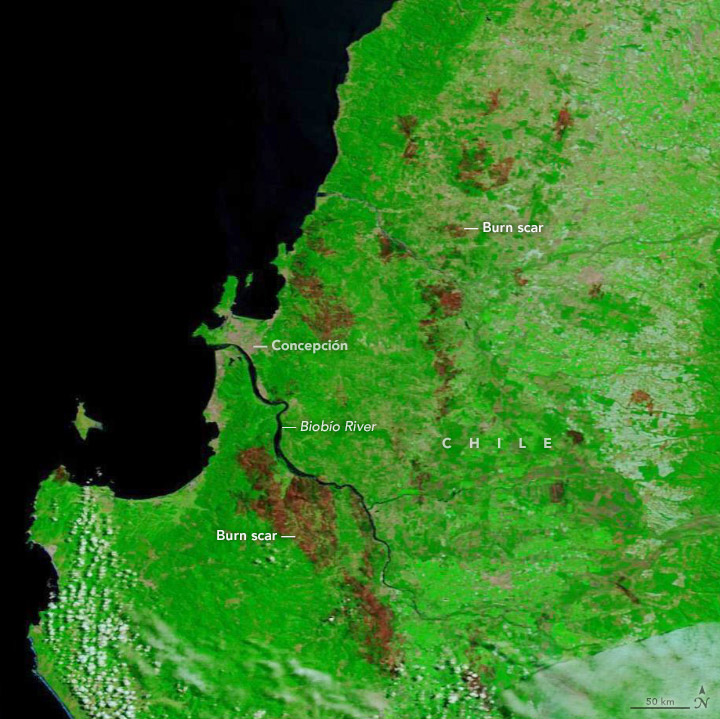
In this tutorial we take as example the case study of the large wildfire event that took place in central Chile in February 2023 (see article from the NASA Earth Observatory) and pre-executed the Burned Area Mapping (BAM) service to simulate the whole event in all its stages as if it had been a near-real-time monitoring. This tutorial aims to indicate a potential usage of the BAM service.
Getting familiar with the UI
Once inside the Wildfire Results Explorer of the CopernicusLAC Platform the user gets access to an essential and intuitive Graphic User Interface with a global map centered over the LAC region and with panels located on the right and on the left.
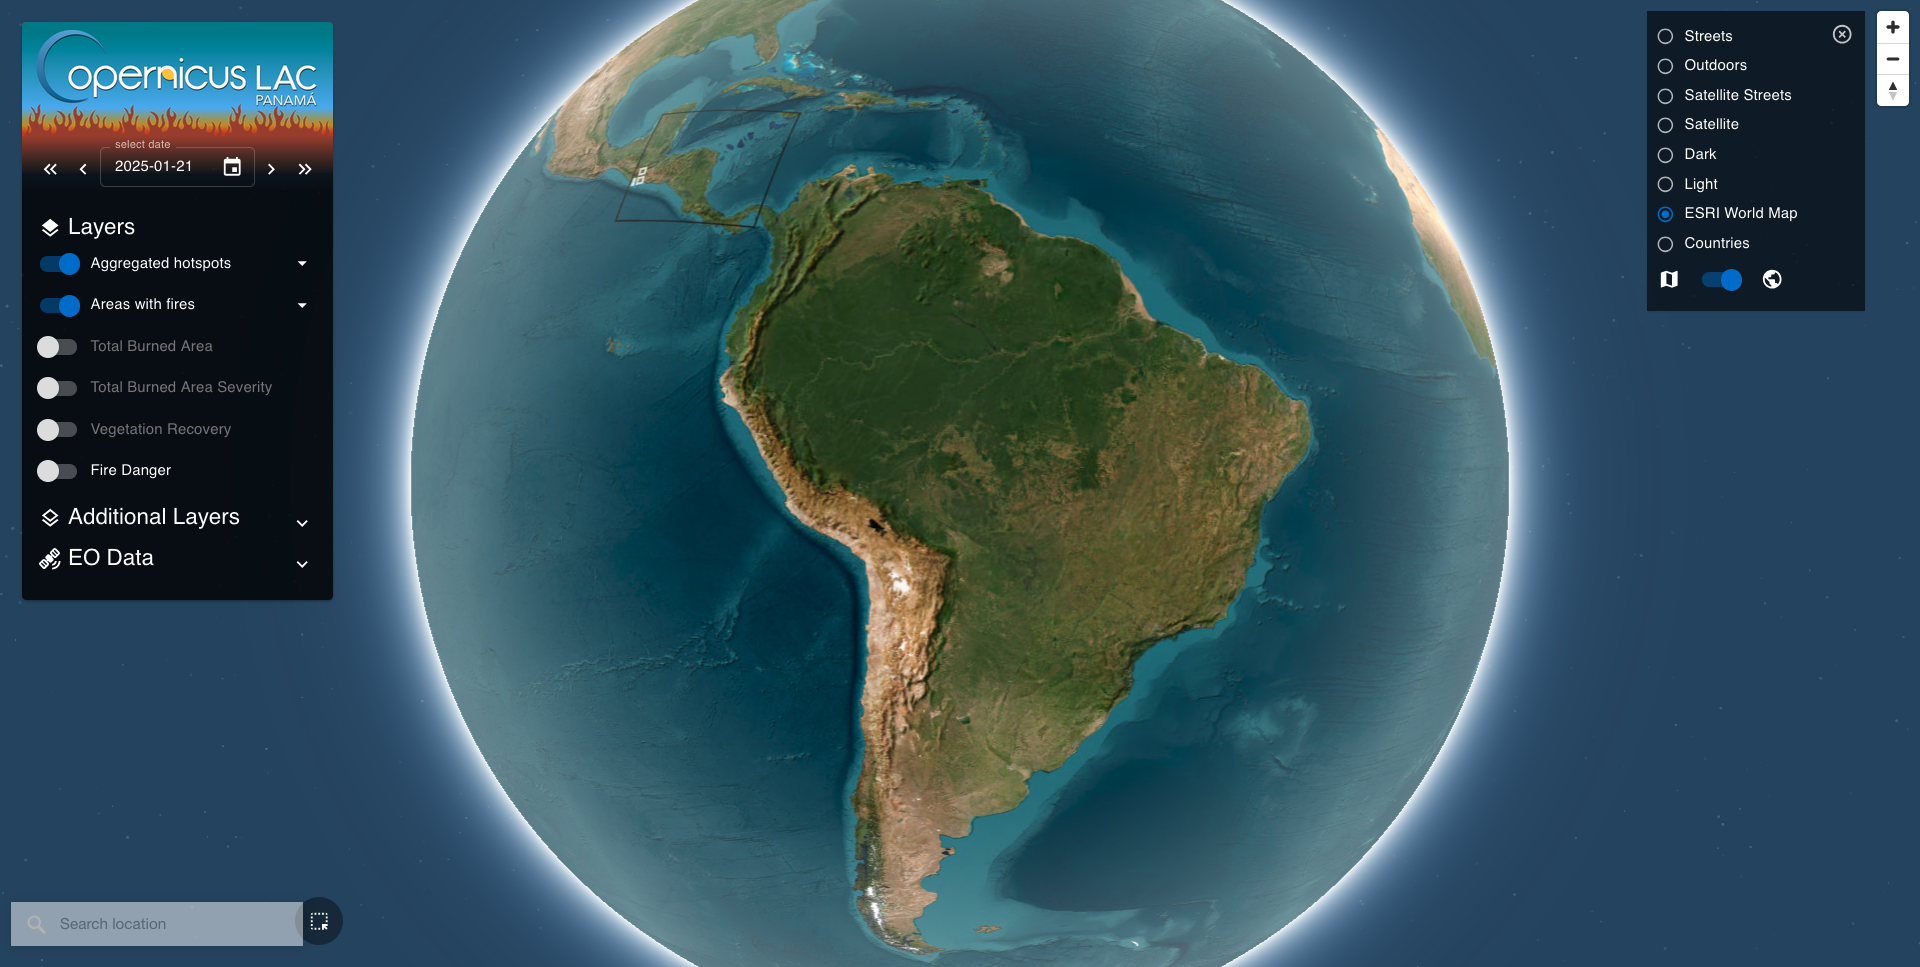
The left panel provides a Date Selector and a Layer List to be activated and shown on the map. Below is also available a Location Search widget that can be used to find a location of interest. On the right is located the Basemap and navigation panel where the user can change the base layer, switch between 3D and 2D views of the map, and find the Navigation control buttons.
Hint
Find more information about the Wildfire Results Explorer user interface here
Basemap Control Panel and Navigation Buttons
To navigate into the Wildfire Results Explorer the user can employ the Map Navigation buttons available in the Navigation Panel which is located in the upper right corner of the map. Alternatively, the user can also pan, zoom-in/out, rotate and tilt the 3D view also by using classical left click and mousewheel.
Hint
Find more information about the navigation controls of the Wildfire Results Explorer here
The 3D view is enabled by default in the Wildfire Results Explorer. To change to a plane view of the map click on the dedicated button located in the Basemap control panel.
Hint
The Basemap control panel is closed by default. To expand it click on 3 lines icon located next to the Map Navigation buttons
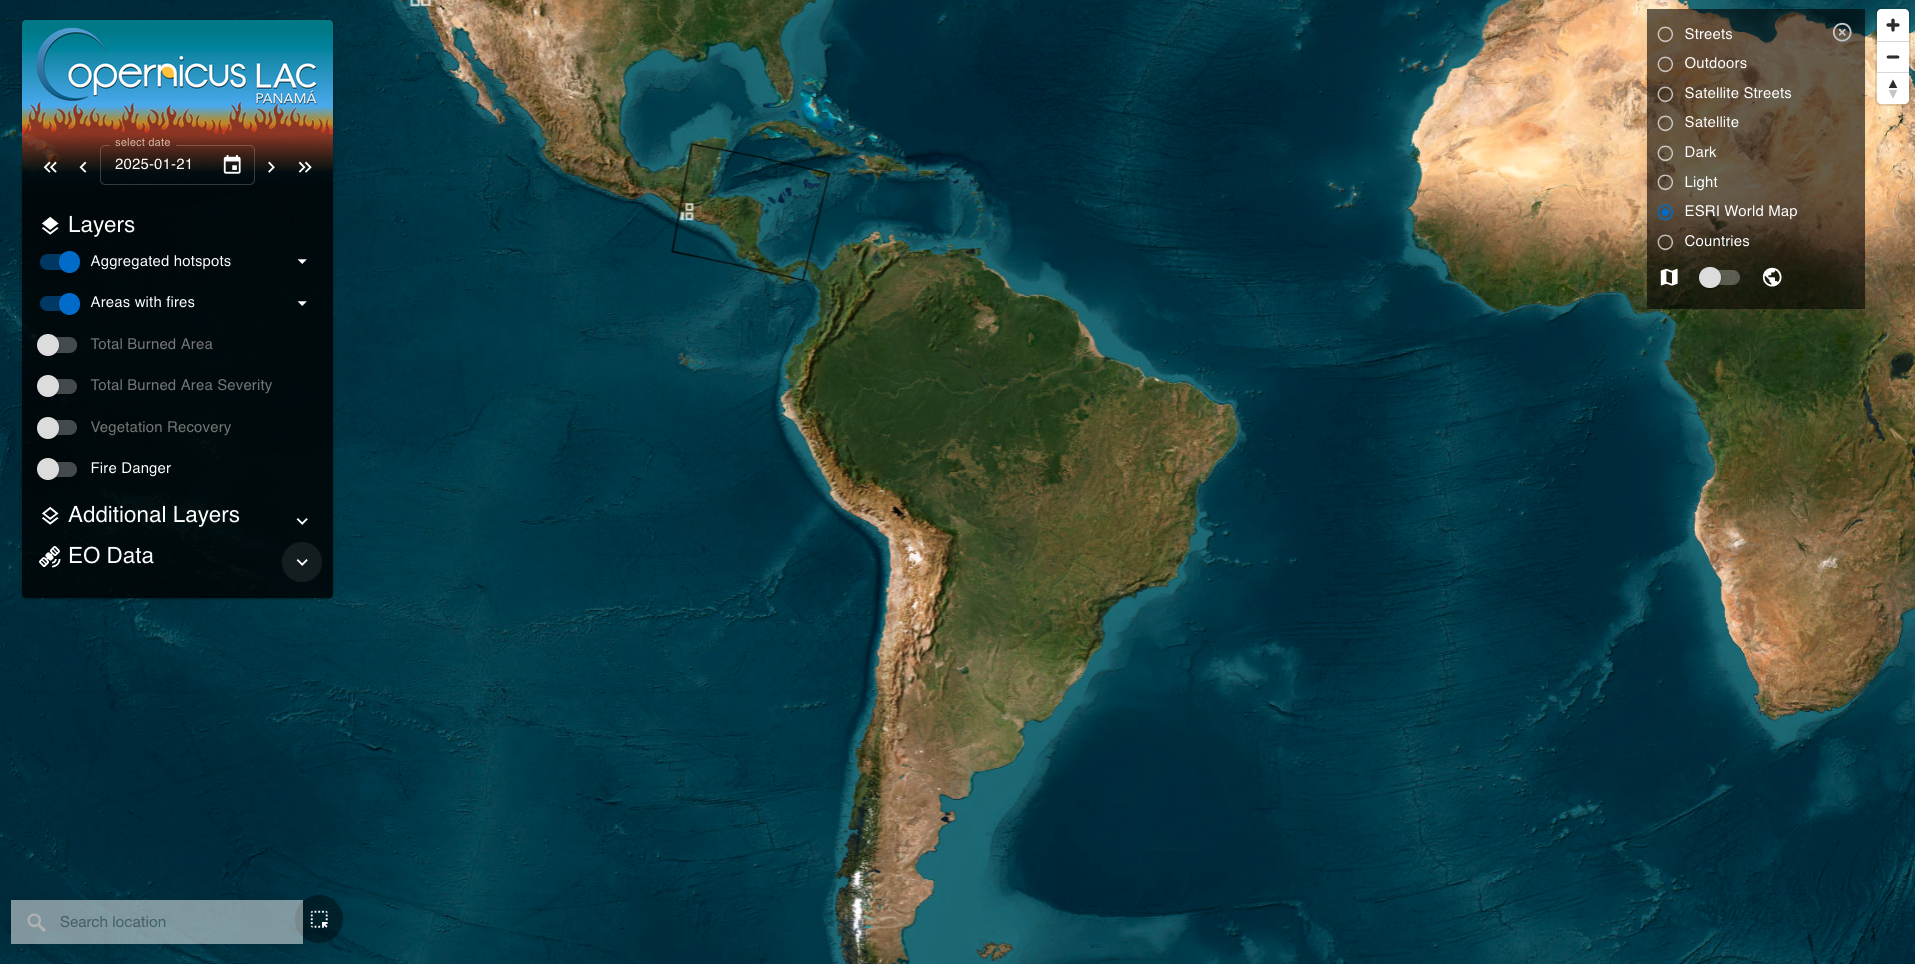
Try to switch among the 3D and 2D view of the map. The below image shows an example of the 2D view of the map.
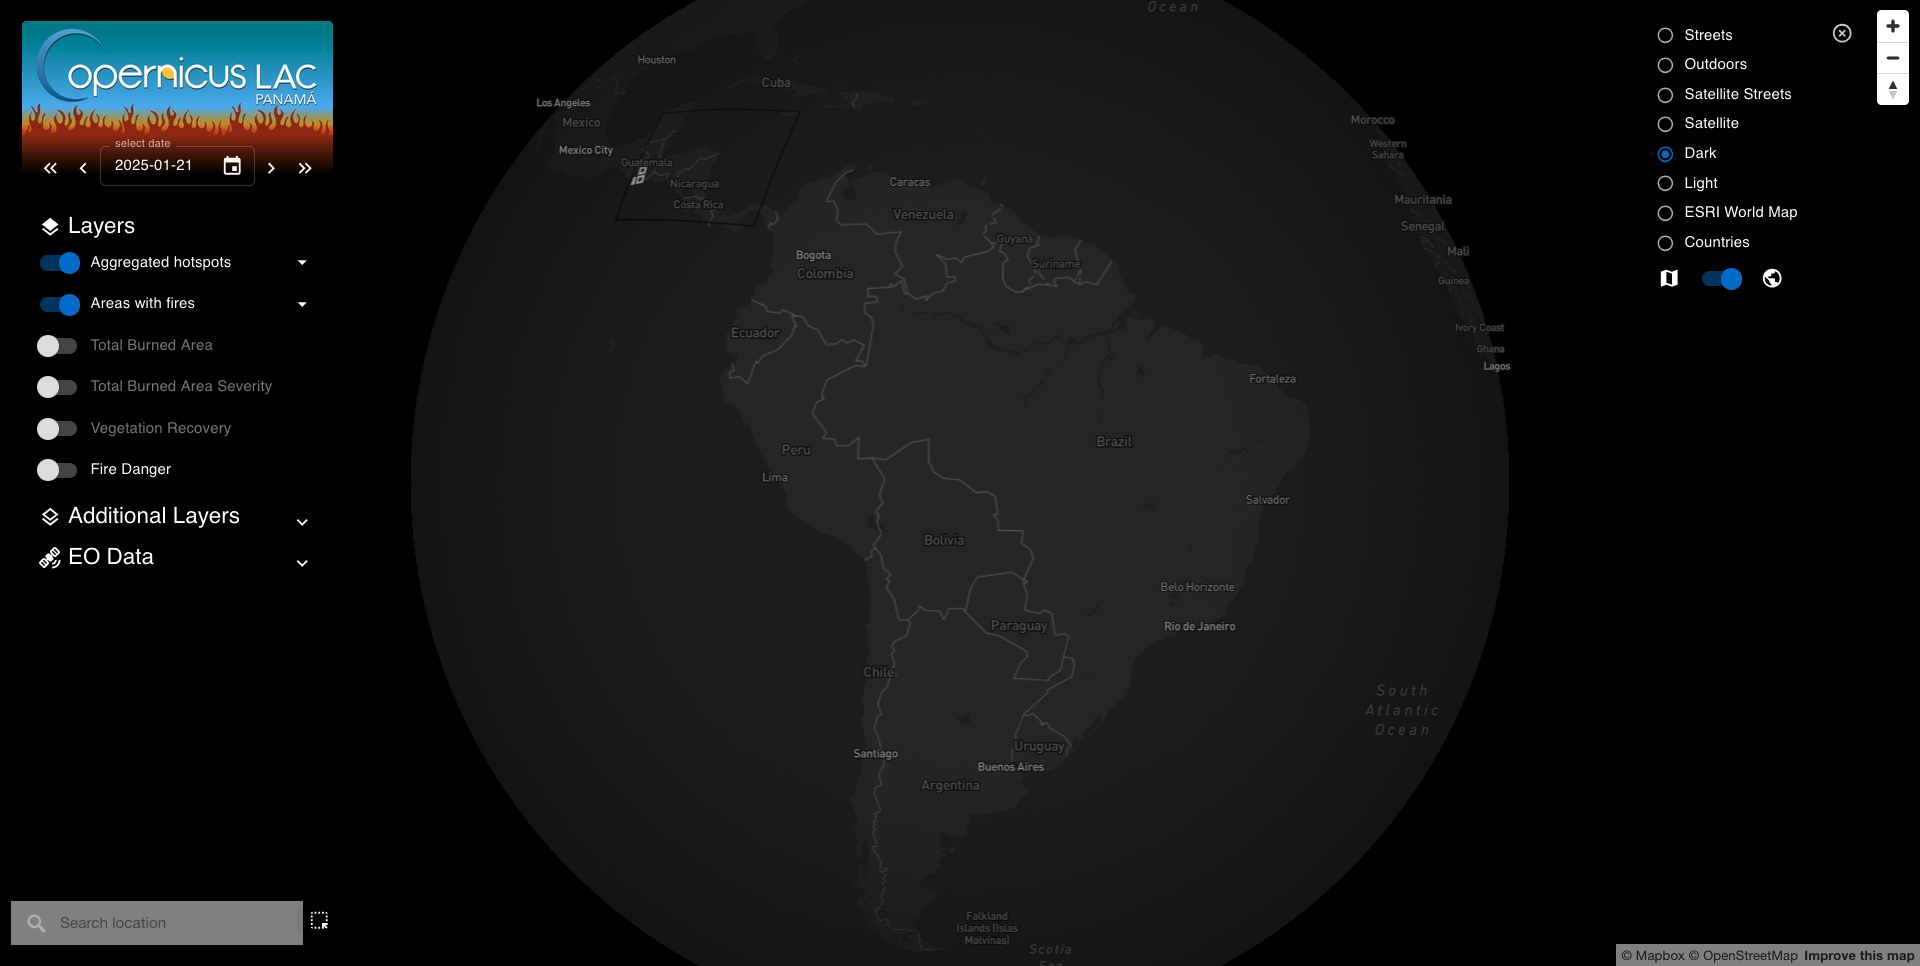
The user can also change the default basemap by selecting another one from the list available in the Basemap Control Panel. Get back to the 3D view of the map and switch the default baselayer, the ESRI World Map baselayer, with another one such as the Dark one. The map will appear as in the below image.
Layers
The BAM products can be seen on the map by activating one or more layers under the Layer list. These are grouped into: Layers, Additional Layers and EO data.
-
Hotspot layers: the Aggregated hotspots layer showing aggregated hotspots derived from calibrated Sentinel-3 SLSTR data, the Sentinel-3 hotspots additional layer showing hotspots derived from calibrated Sentinel-3 SLSTR data, and the VIIRS hotspots additional layer showing daily aggregated VIIRS hotspots from the NASA FIRMS service.
-
Areas under monitoring: the Areas with fires layer highlights the areas automatically identified by the chain where the Burned Area Mapping service has been triggered. This vector shows the portions of land covered by a Sentinel-2 tile that are intersecting with significant clusters of Sentinel-3 SLSTR hotspots.
-
Burned area layers: the Total Burned Area layer showing total burned areas mapped by the BAM algorithm since the beginning of the event, the Current Burned Area additional layer, showing the contribution for the selected date into the BAM computation, the Burned Area Probability additional layer which provides complementary information about the current burned area layer, and the Initial Burned Area additional layer which is a preliminary estimation of burn scars from which the current burned area layer is derived from.
-
Burned area severity layers: the Total Burned Area Severity layer showing total burned area severity mapped by the BAM algorithm since the beginning of the event, and the Current Burned Area Severity additional layer, showing the contribution for the selected date into the BAS computation.
In addition to that the user can also visualize true/false color composites or single band visual products, derived from multispectral or thermal calibrated EO data from the Sentinel-2 and Sentinel-3 missions, by activating one of the layers under the EO data group.
Find here a description of all other layers available in the Wildfire Results Explorer user interface.
Interact with layers
To show or hide a layer in the map you can click on the circular button located next to the layer title on the left.
The user can interact with the layers by using the Layer buttons: Info about the layer, Pan/Zoom, Set opacity, and Item list.
Concerning the layer order visualization, the last activated layer will be the top layer in the visualization of multiple layers in the map.
In the Wildfire Results Explorer it is possible to visualize in the map of brightness temperature (from the lwir11 CBN) from Sentinel-3 SLSTR RBT calibrated data from ascending or descending passes. Let's deactivate the default active layers: Aggregated Hotspots, and Areas with fires, and under the EO data group activate the Sentinel-3 SLSTR RBT ASC layer. The map will automatically show all the items included in the layer for the current date.
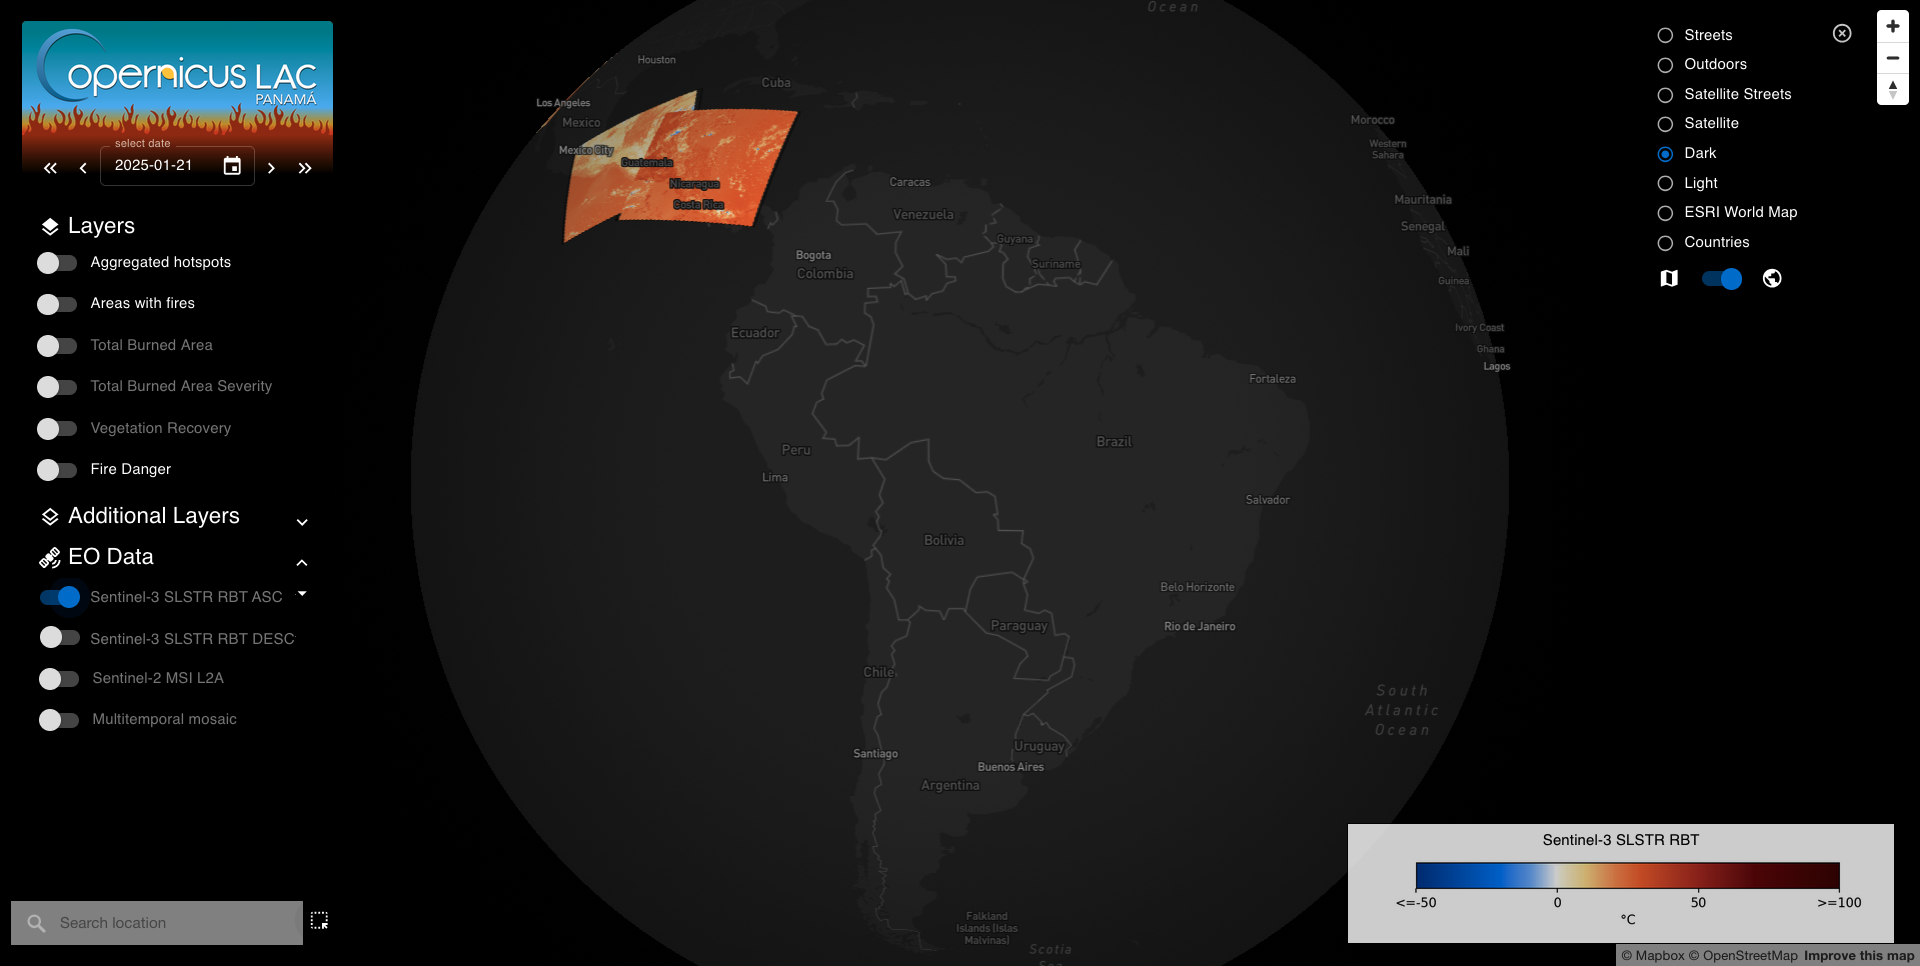
If available the platform shows the legend associated with the layer in the bottom right corner of the map.
To get more information about the items contained into a layer see:
-
the Item list panel,
-
the Item details panel,
-
and the Clicked items dialog.
Warning
When no items are available (e.g. no products are available for the selected date or area of interest) the layer title is instead shown in gray.
Temporal search
The Wildfire Results Explorer shows in the map EO data products as layers for a selected date. To select the date you shall employ the Date selector available in the Layers panel on the top left corner of the interface. After a selection the platform automatically does for each layer a search of items that are made available under that date.
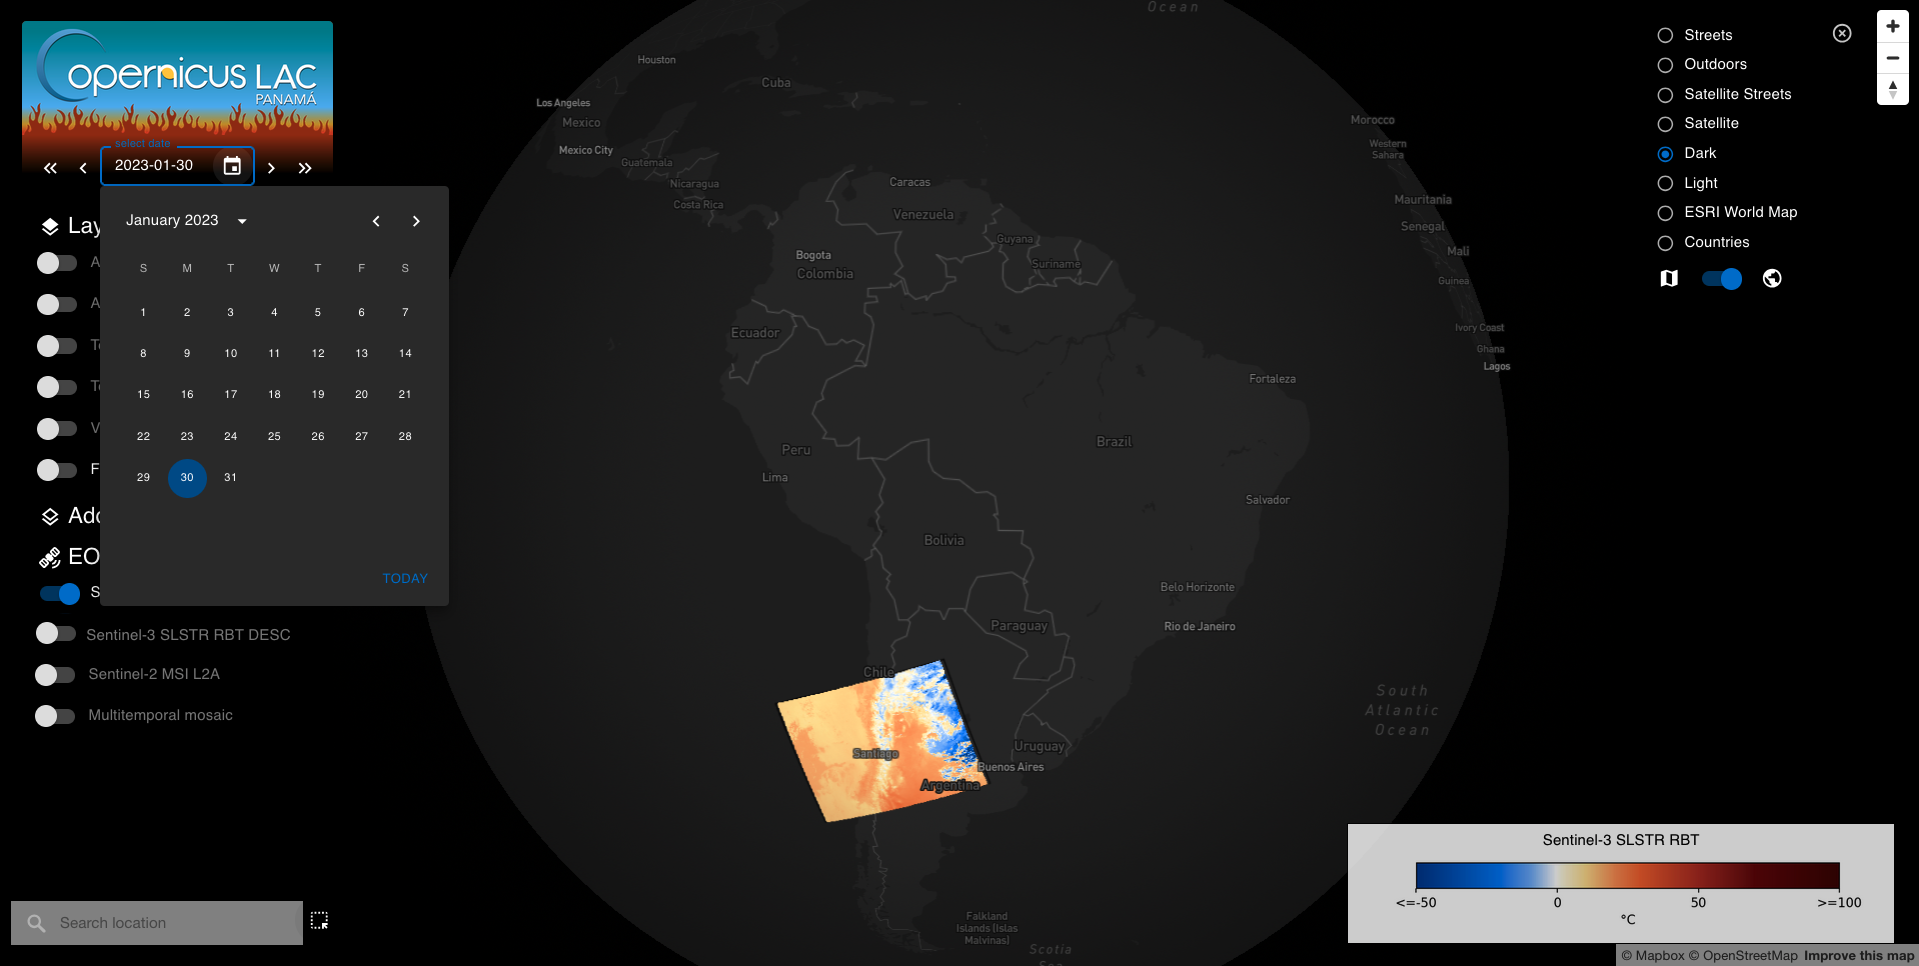
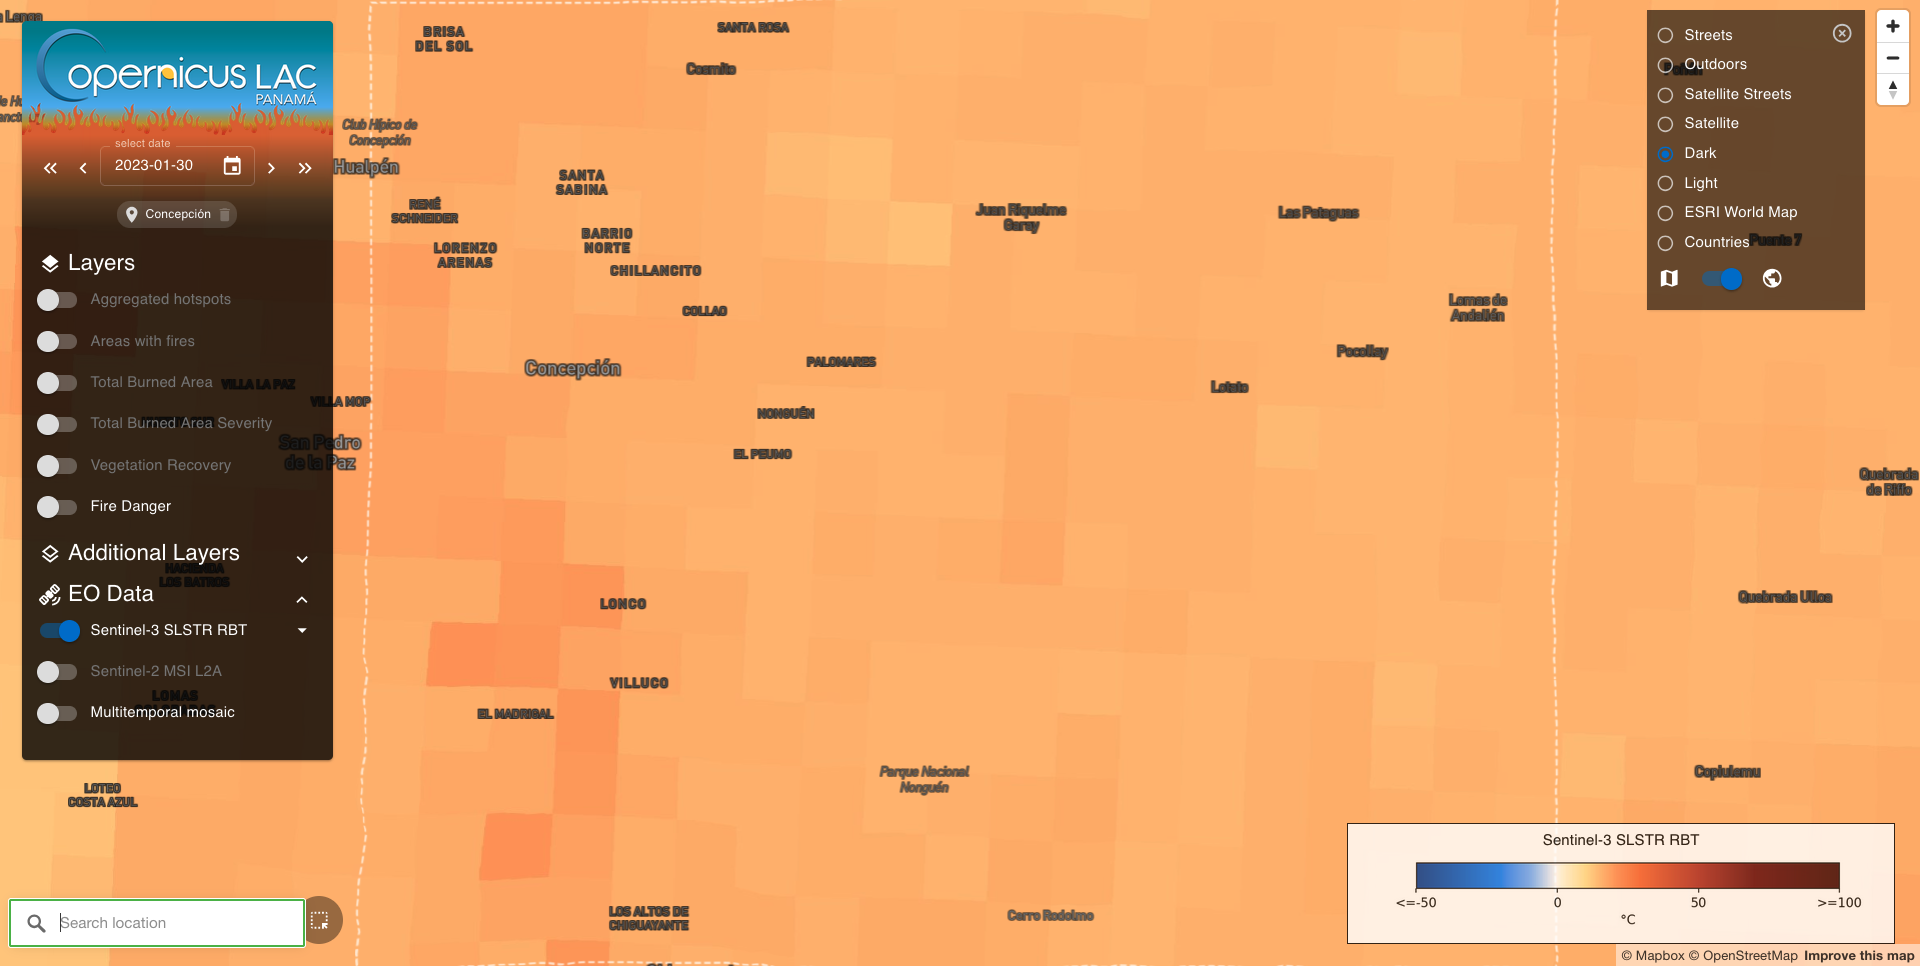
Let's use the Date selector to change the current date with another one in the past such as the 30 January 2023 (few days before the large Chile 2023 wildfire). You can either use the buttons available on the left of the selected date or by clicking on the calendar icon. After the change of the date the interface will show the following result.
Spatial search
To quickly zoom to the area of interest near Concepción in Chile you can employ the Search Location widget located in the bottom left corner of the map.
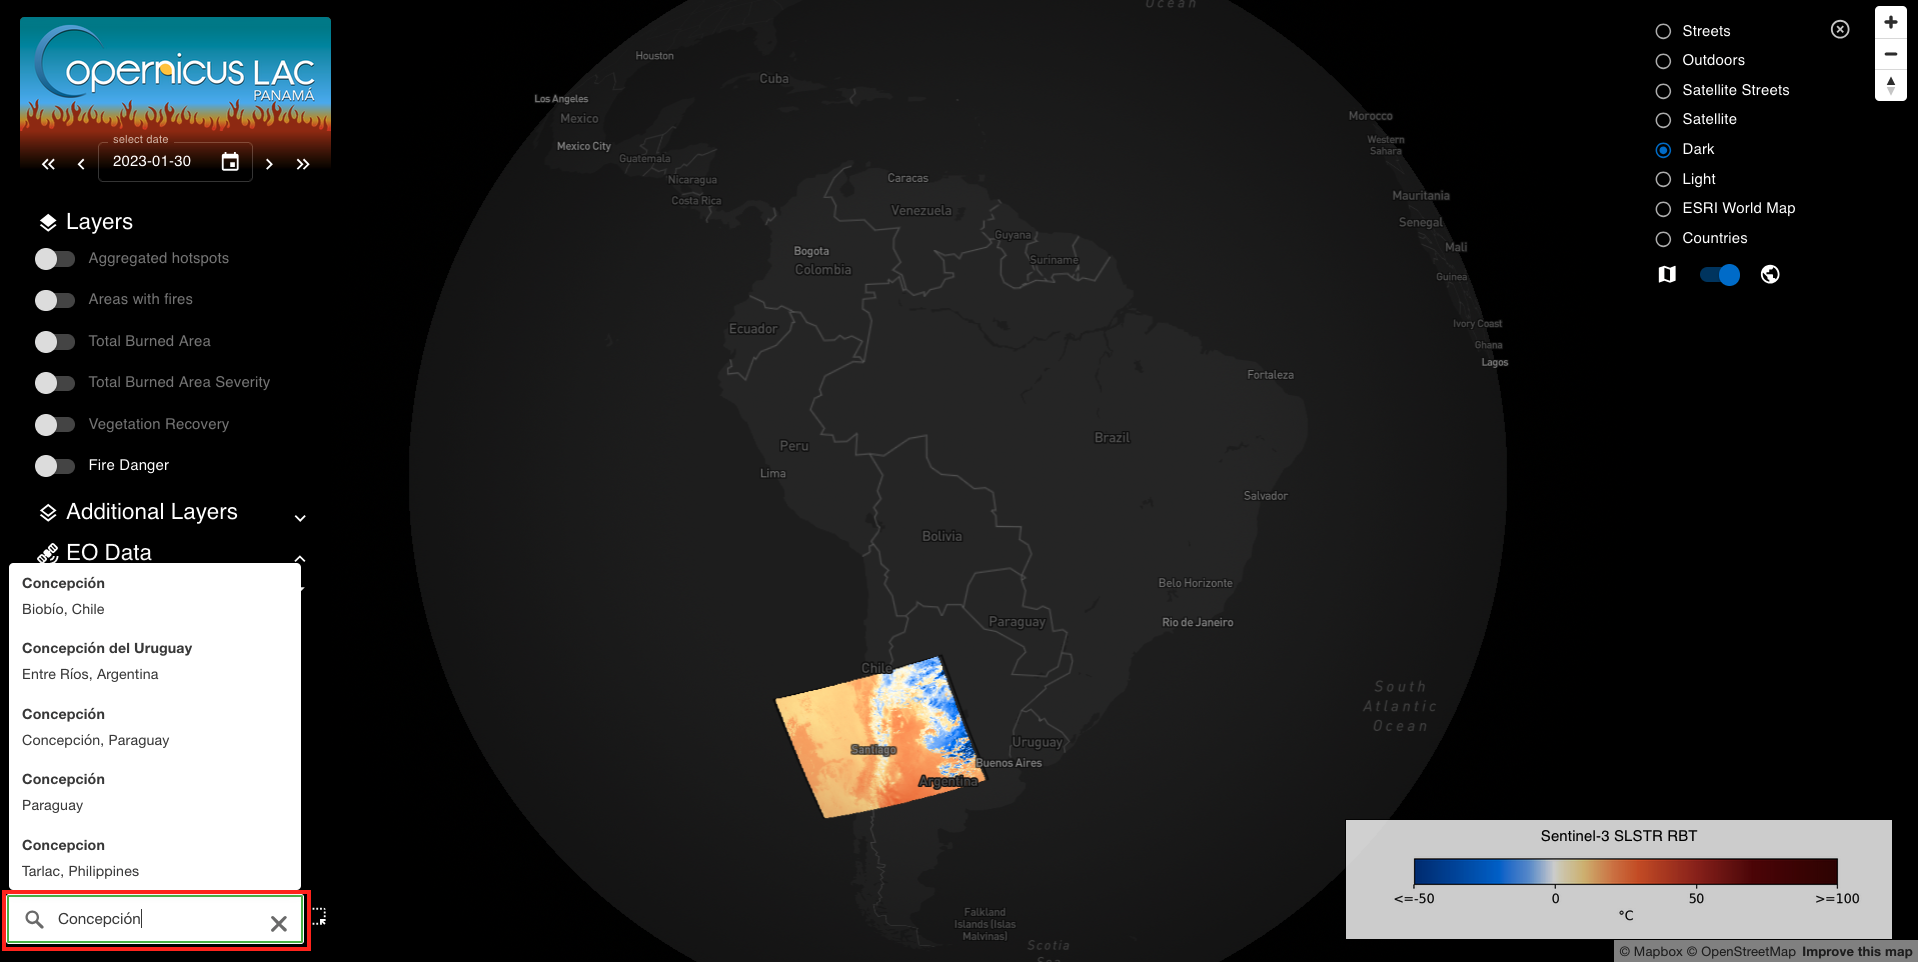
After clicking on Concepción, Biobio, Chile from the list of results from the search, the map will be automatically centered over the bounding box of the searched location, as shown in the below image.
Find and visualize EO products
Let’s keep inspecting the Sentinel-3 SLSTR RBT layer showing brightness temperature (fire1 CBN) from ascending and descending acquisitions that have been ingested over this area of interest in Chile.
To do this, first of all zoom out to a wider area to better see brightness temperature also over surrounding areas of Concepción, and then select another date: the 2 February 2023.
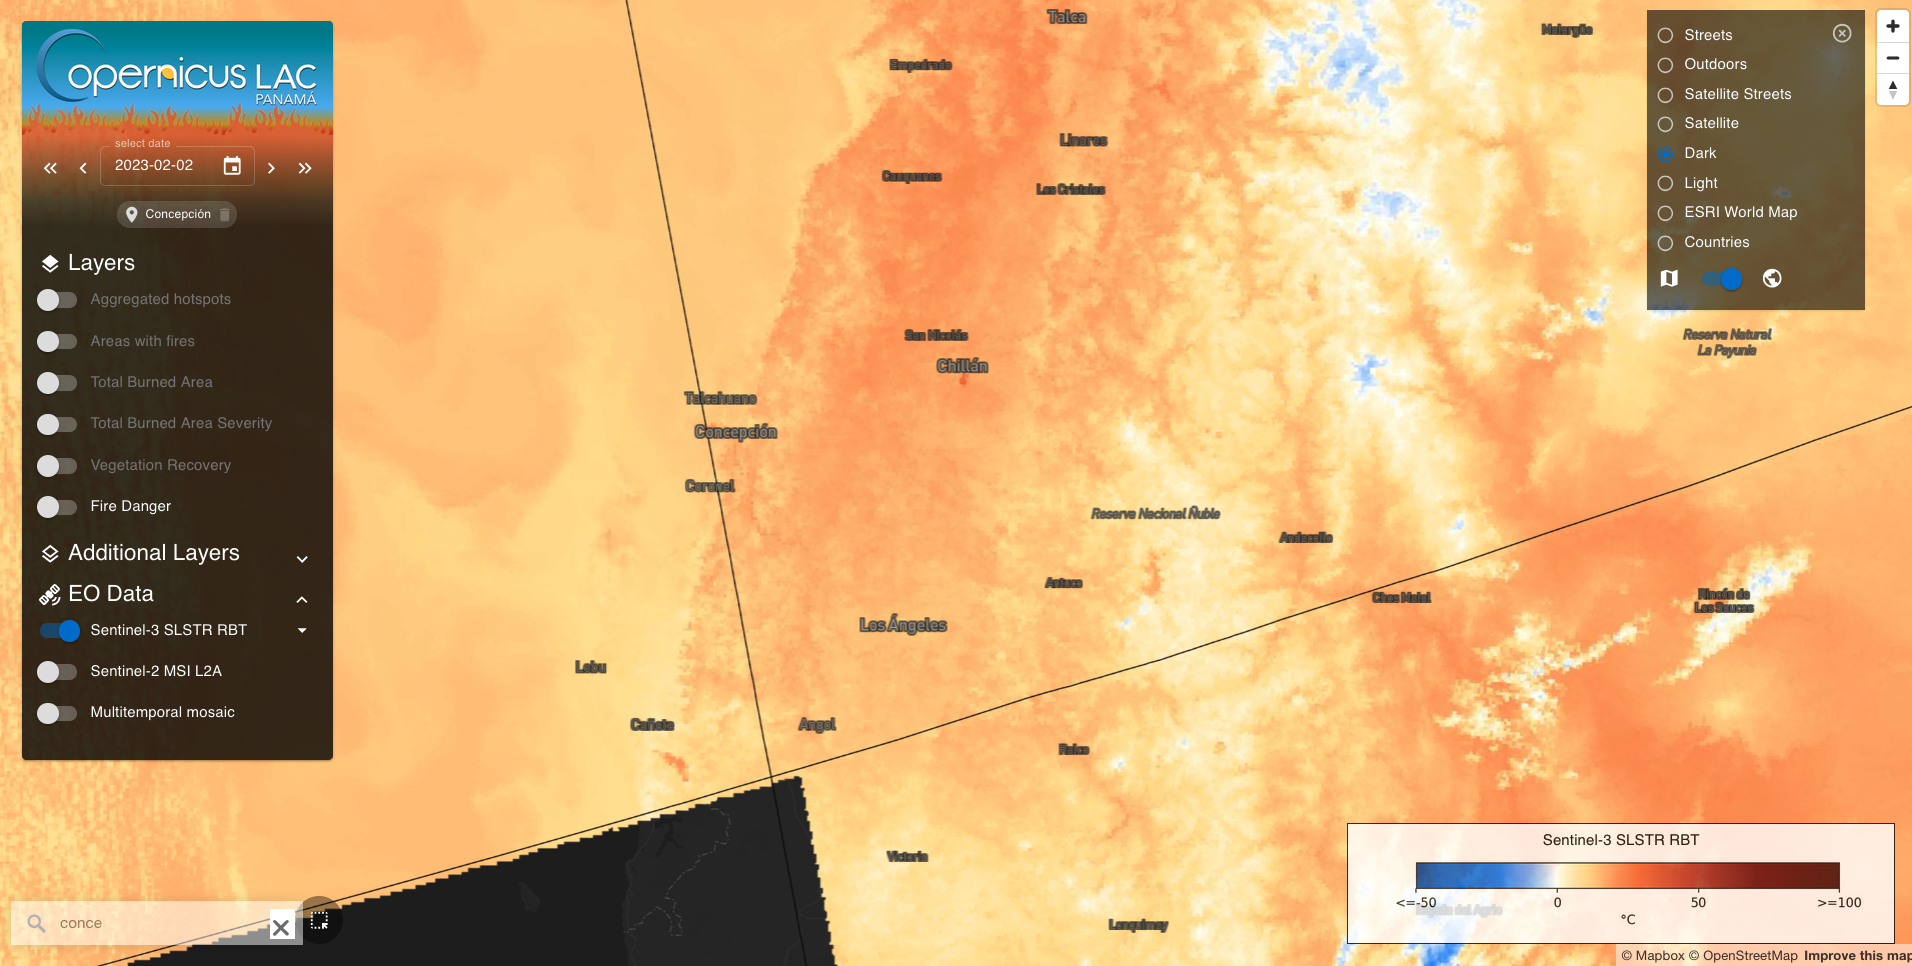
To better interpret the colors of this brightness temperature full resolution visual product, you can check the legend appearing in the bottom right corner of the map. Positive thermal anomalies are shown in red to dark red colors.

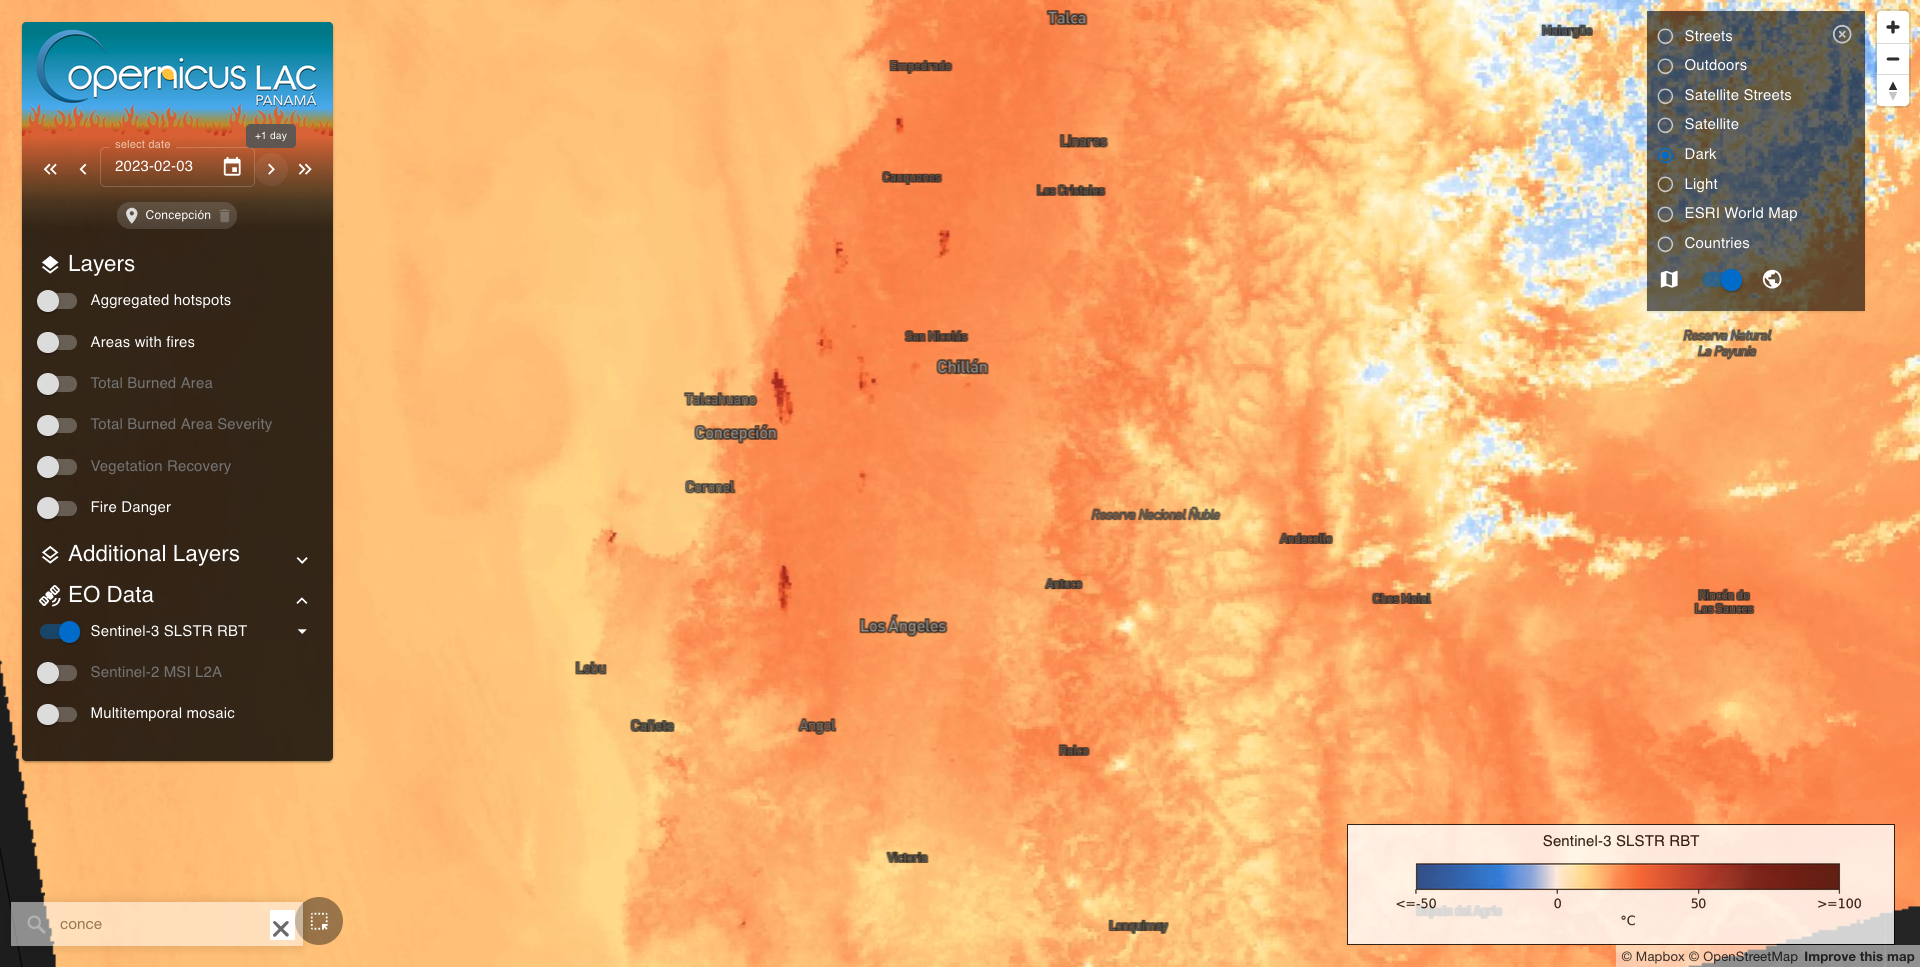
From the Select date functionality of the Date selector, change again the date to the 3 February 2023. Thermal anomalies identified are clearly visible on the map in dark red colors.
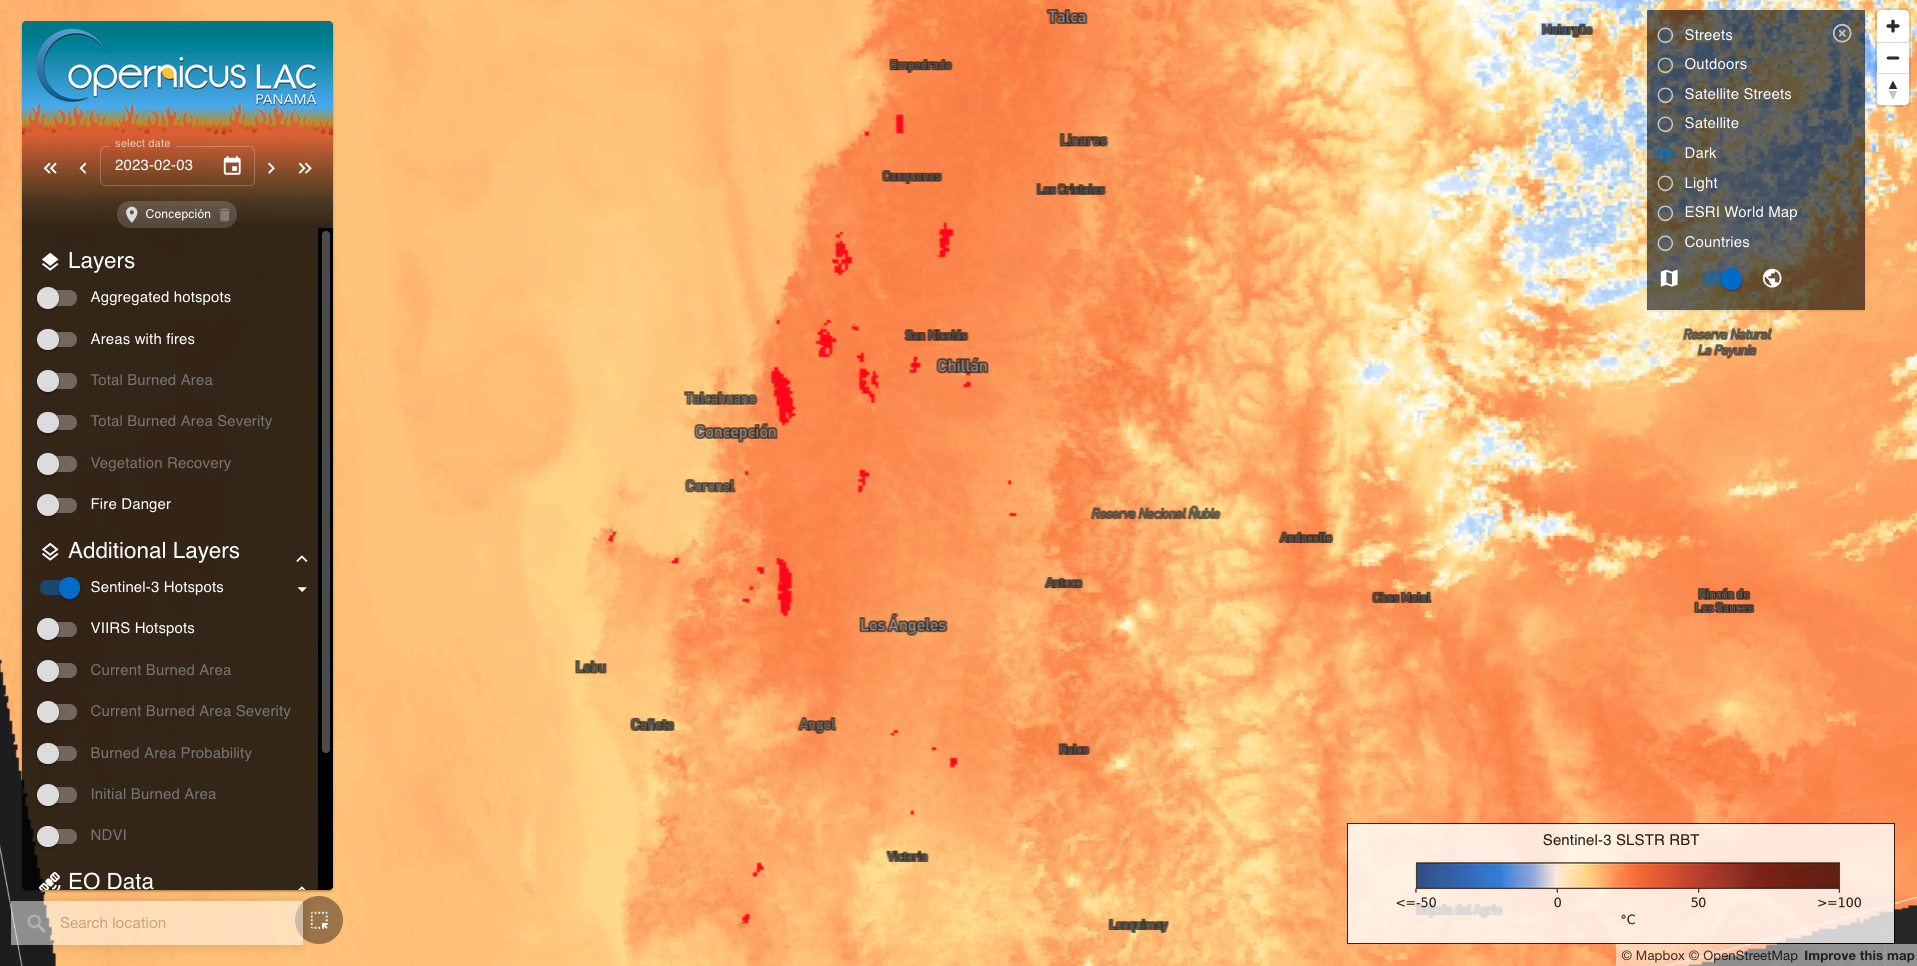
To visualize detected hotspots derived from Sentinel-3 SLSTR calibrated data acquired on the 3rd of February, turn on the Sentinel-3 Hotspots layer from the Additional Layers list.
Question
Am I properly visualizing two overlapping layers?
Figure 10 shows the visualization of 2 layers: the Sentinel-3 hotspot layer which is superimposed to the Sentinel-3 SLSTR RBT one. Thus hotspots in red are overlapping thermal anomalies from the Sentinel-3 brightness temperature layer. This is because the Sentinel-3 hotspot layer has been activated after the Sentinel-3 SLSTR RBT one.
The visualization of layers in the map is based on the sequence followed by the user in activating each layer. Therefore, the last activated layer will be the top layer in the visualization of multiple layers in the map.
In case something went wrong, to visualize the Sentinel-3 hotspot layer superimposed to the Sentinel-3 SLSTR RBT one repeat the following steps:
-
Deactivate all current active layers,
-
activate first the
Sentinel-3 SLSTR RBTlayer, -
and then the
Sentinel-3 hotspotone.
If step 2 is inverted with step 3 the user will see only the Sentinel-3 SLSTR RBT layer in the map being the Sentinel-3 hotspot layer underneath it.
Then, to visualize aggregated hotspots derived from the Sentinel-3 data of the 3rd of February 2023 turn off this time from the Layers list the Sentinel-3 SLSTR RBT layer, and activate only the Aggregated hotspots layer.
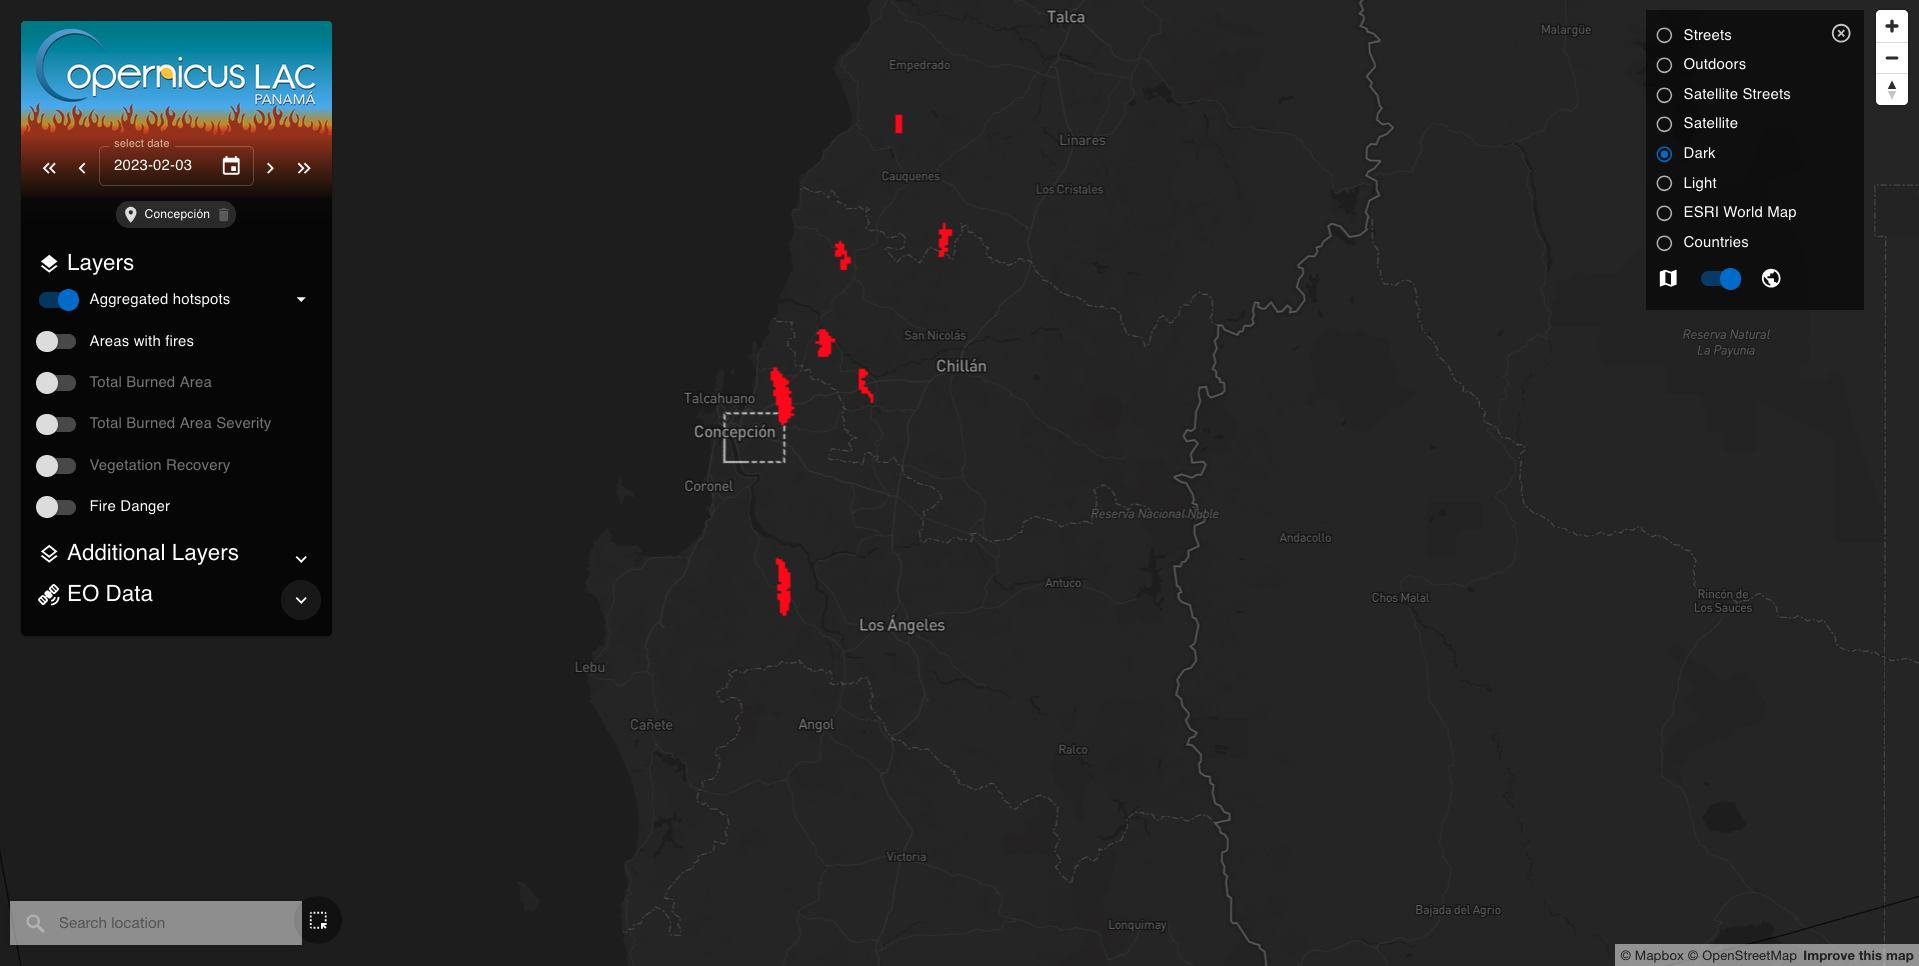
The map provides a view of significant clusters of significant hotspots in the area. Aggregated hotspots are then used in the workflow of the BAM service to trigger the ingestion of Sentinel-2 post-event data over the area.
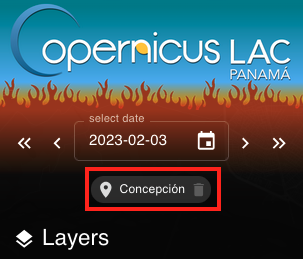
To visualize the footprint of Sentinel-2 tiles on fire, remove first the Spatial filter in place over the Concepción BBOX. This is possible by clicking on the bin icon next to the geo filter icon. The removal of the spatial filter allows to see in the map all the areas where the Sentinel-2 dat is currently in place to monitor wildfires in the region and not only the single area intersecting with the Concepción BBOX.
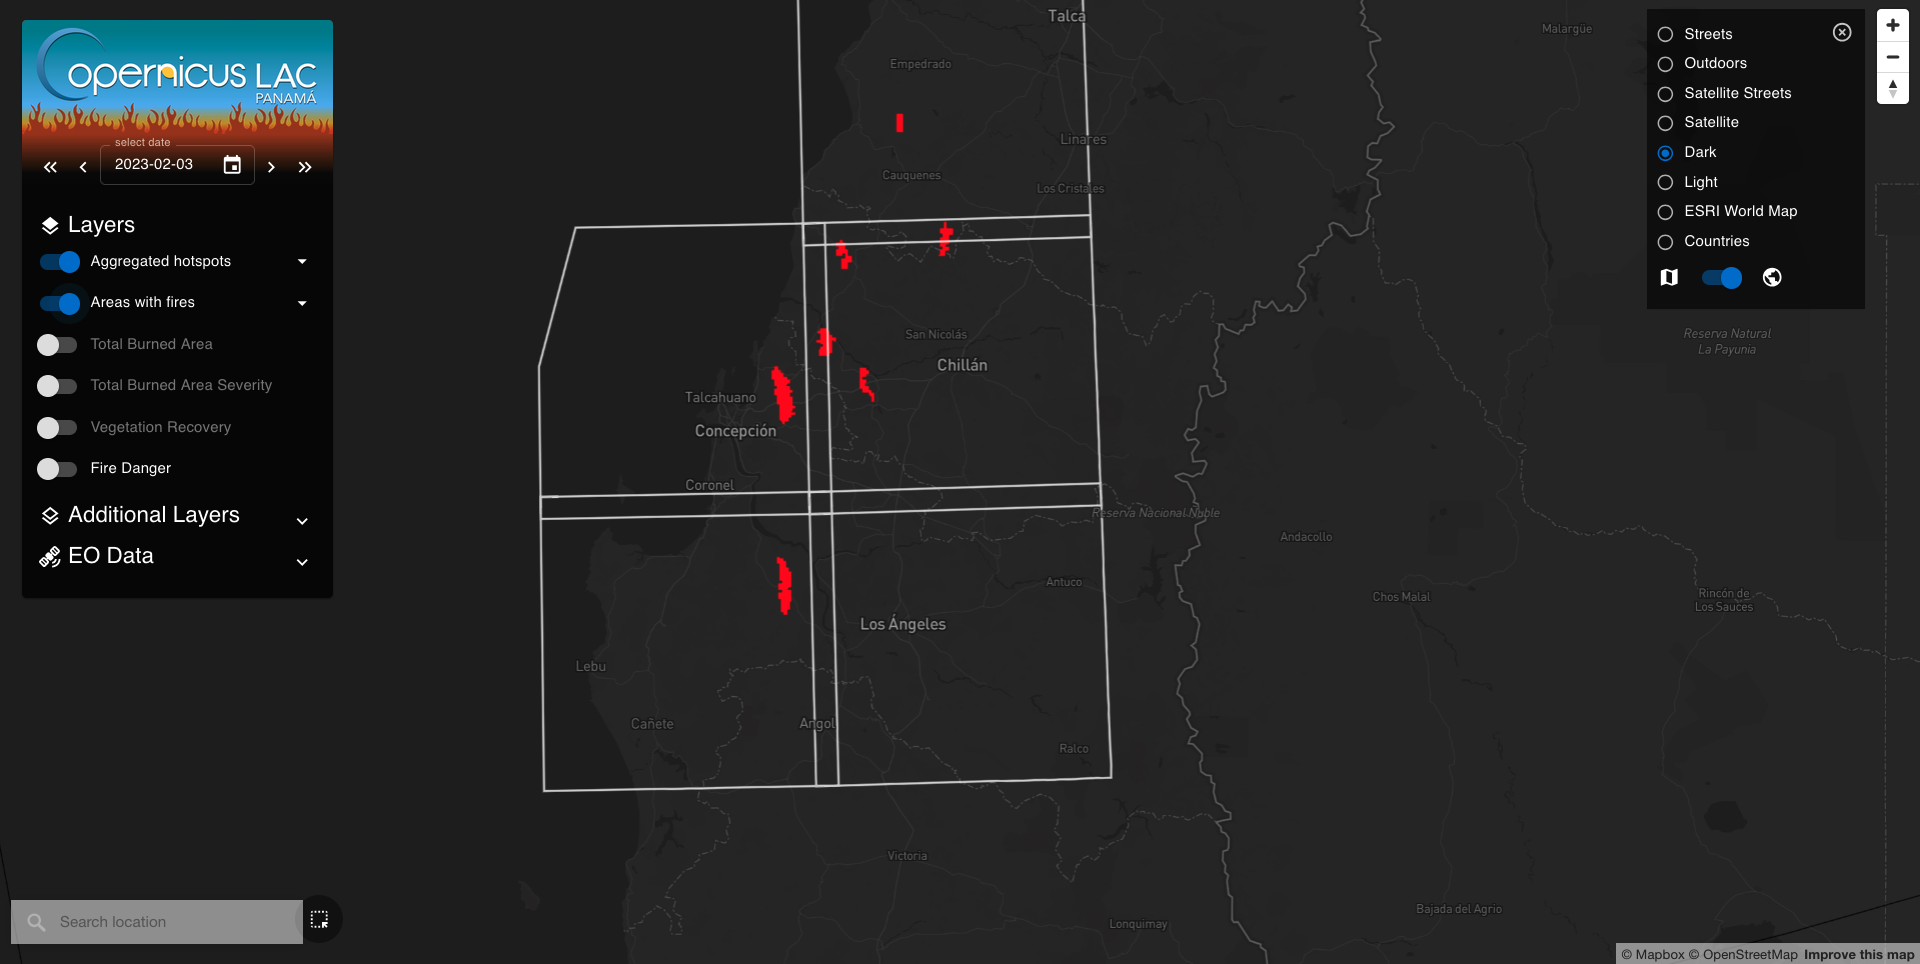
Then, turn on the “Area with fires” layer.
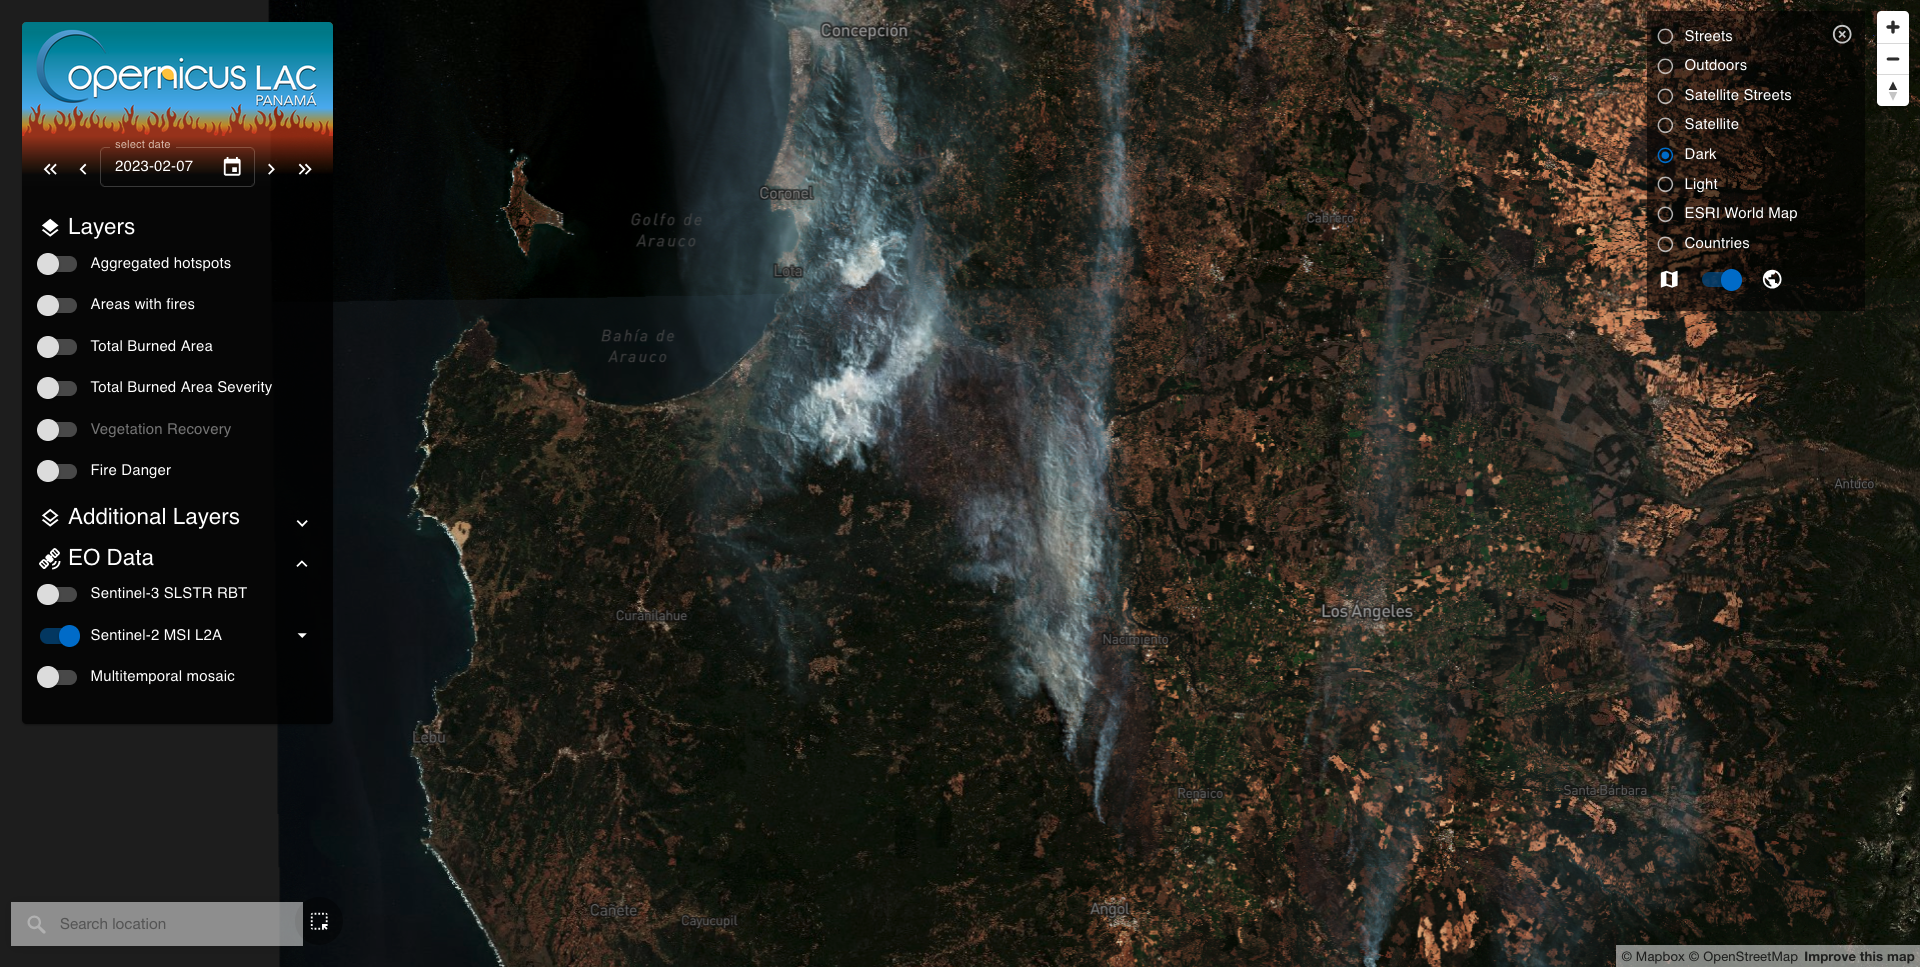
Use the Date selector to change the date the 3rd to the 7th of February 2023. This is the date of the first Sentinel-2 pass over the area after the beginning of the event. Then keep active Areas with fire Layer, turn off the Aggregated hotspots, and activate the Sentinel-2 MSI L2A one. The map will show a full resolution mosaic of the true color composite of ingested Sentinel-2 imagery.
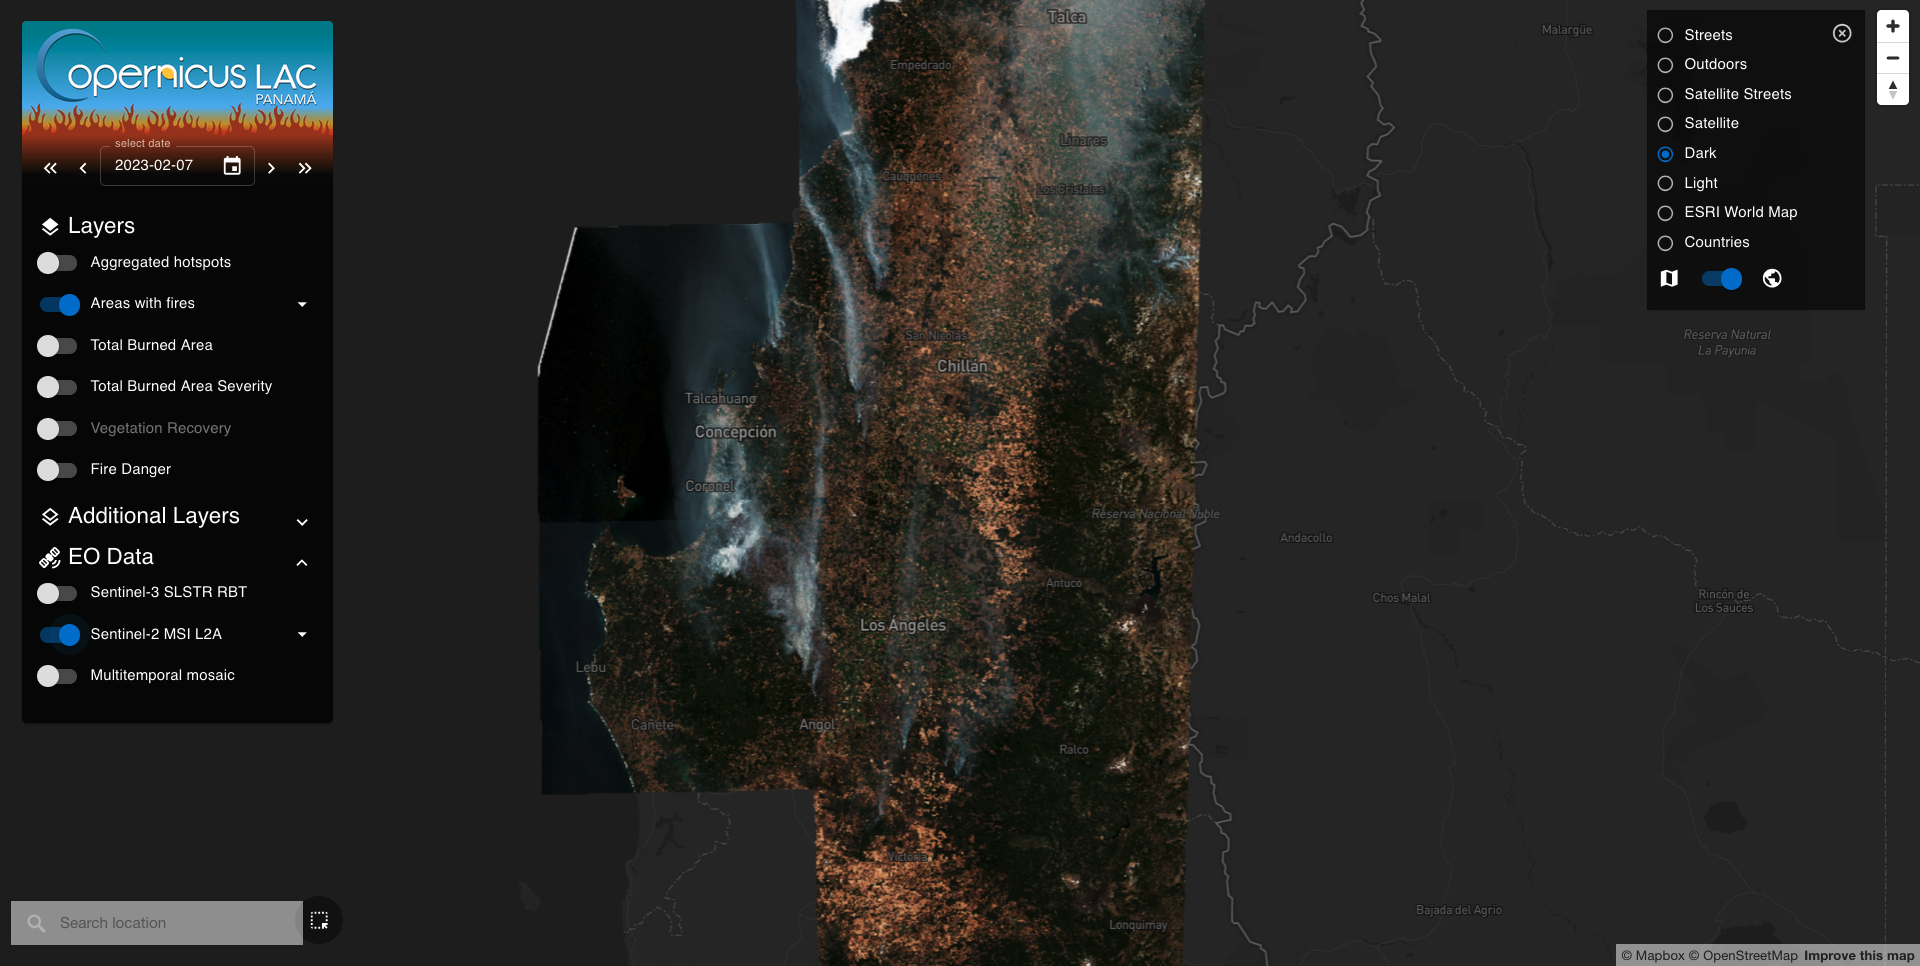
The smoke plumes are way visible. Zoom in over the wildfire event happening near Concepcion. Burned areas are slightly visible under the smoke plumes.
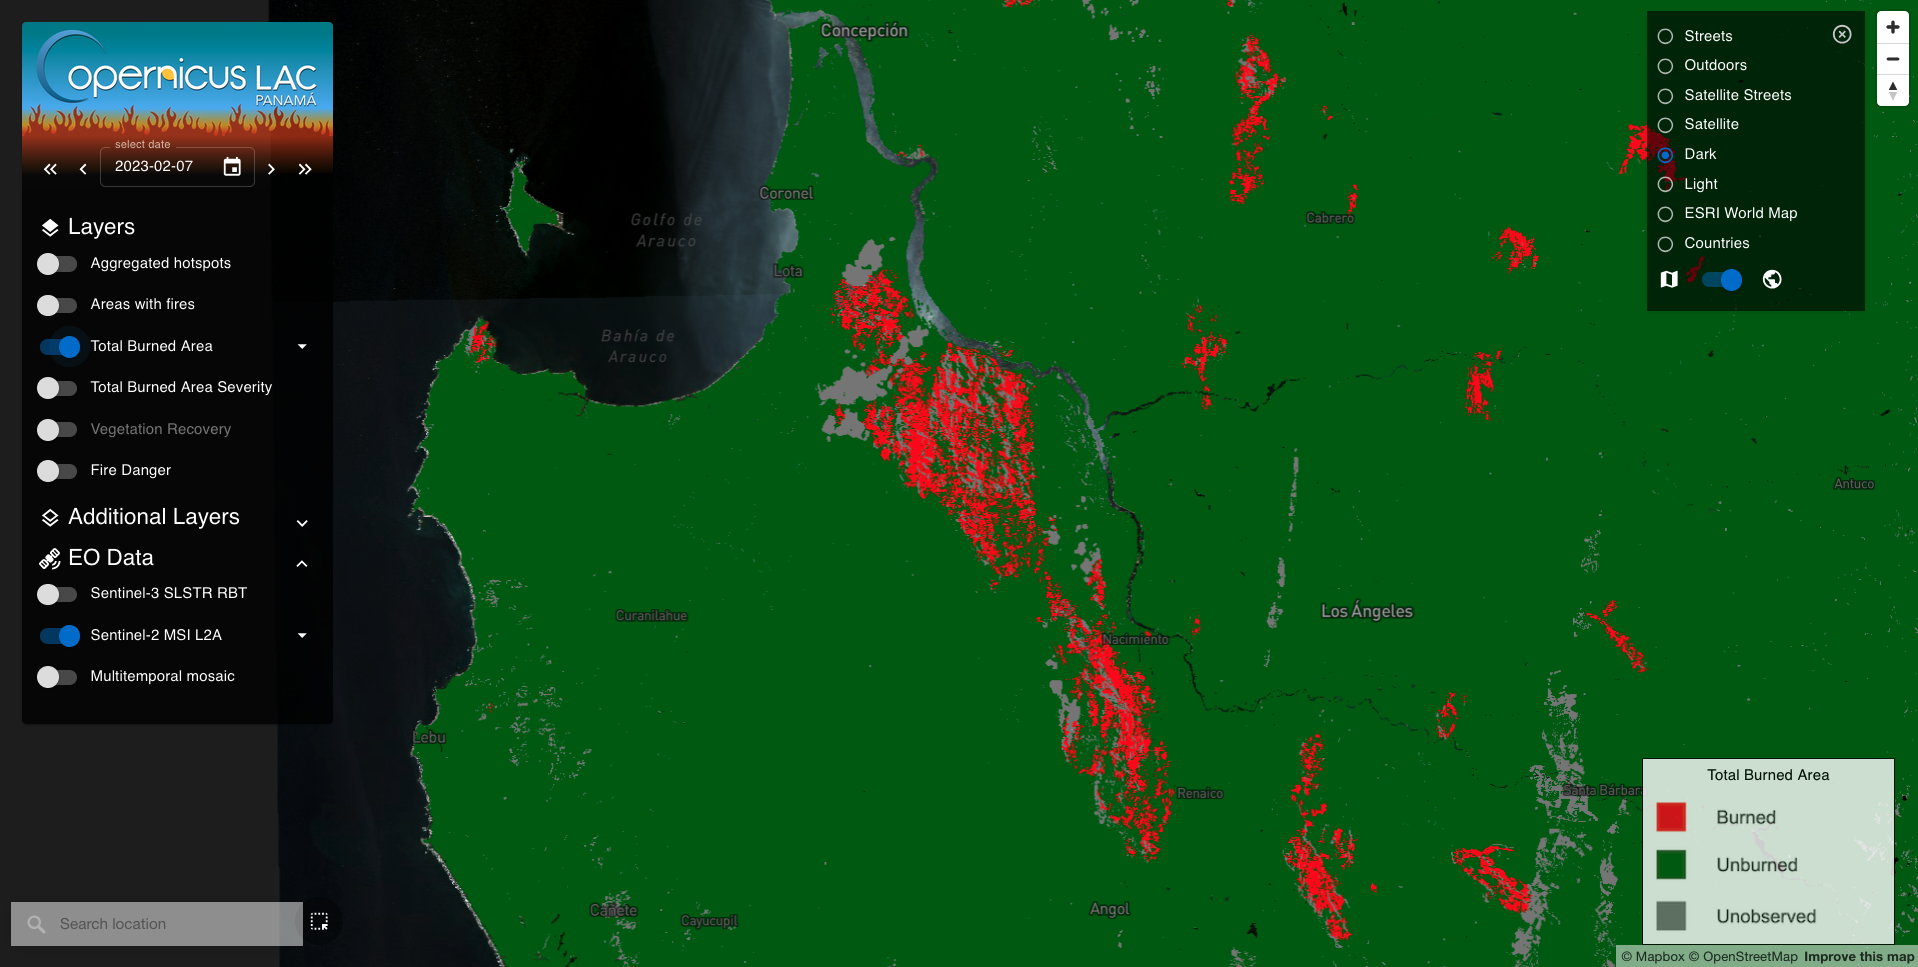
To visualize the Total Burned Area product at full resolution derived from pre- and post-even Sentinel-2 imagery, turn on from the Layers list the Total Burned Area layer. The legend of the Total Burned Area layer will appear in the bottom right corner of the map.
Tip
To visually compare the Total Burned Area layer with the underlying baselayer (e.g. the ESRI World Map) you can set the Opacity as 50% using the dedicated layer button.
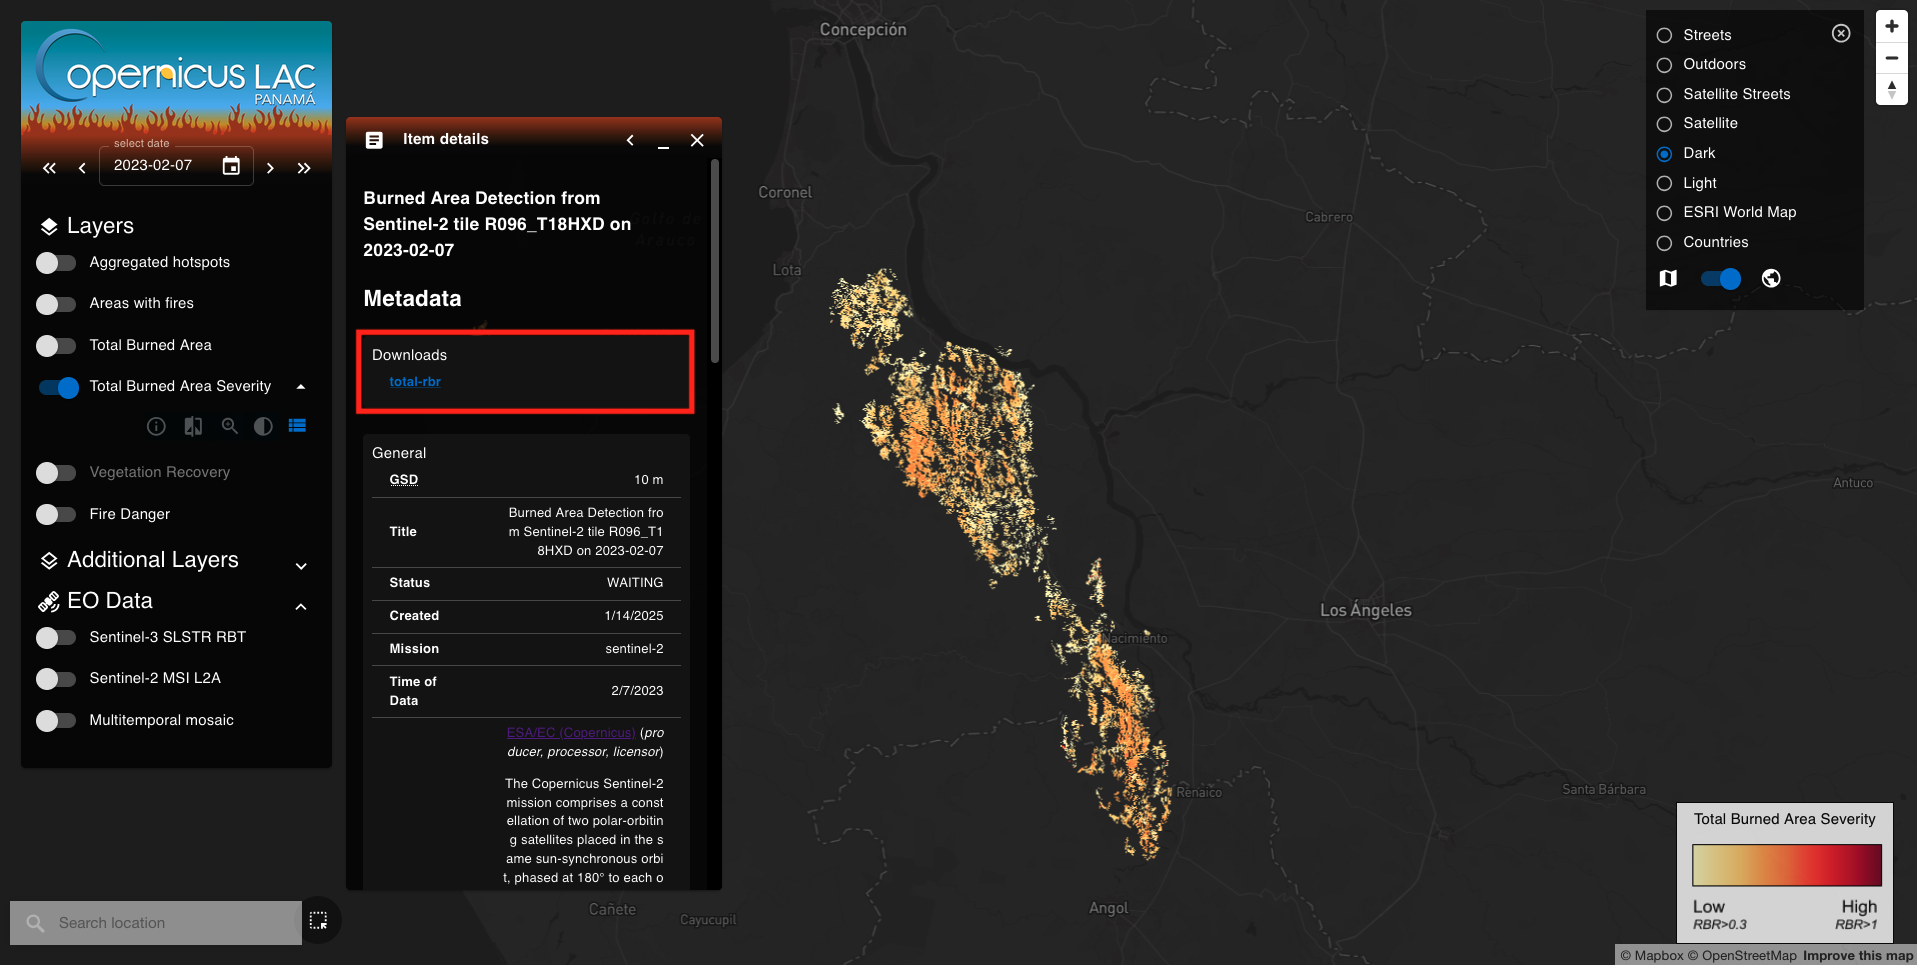
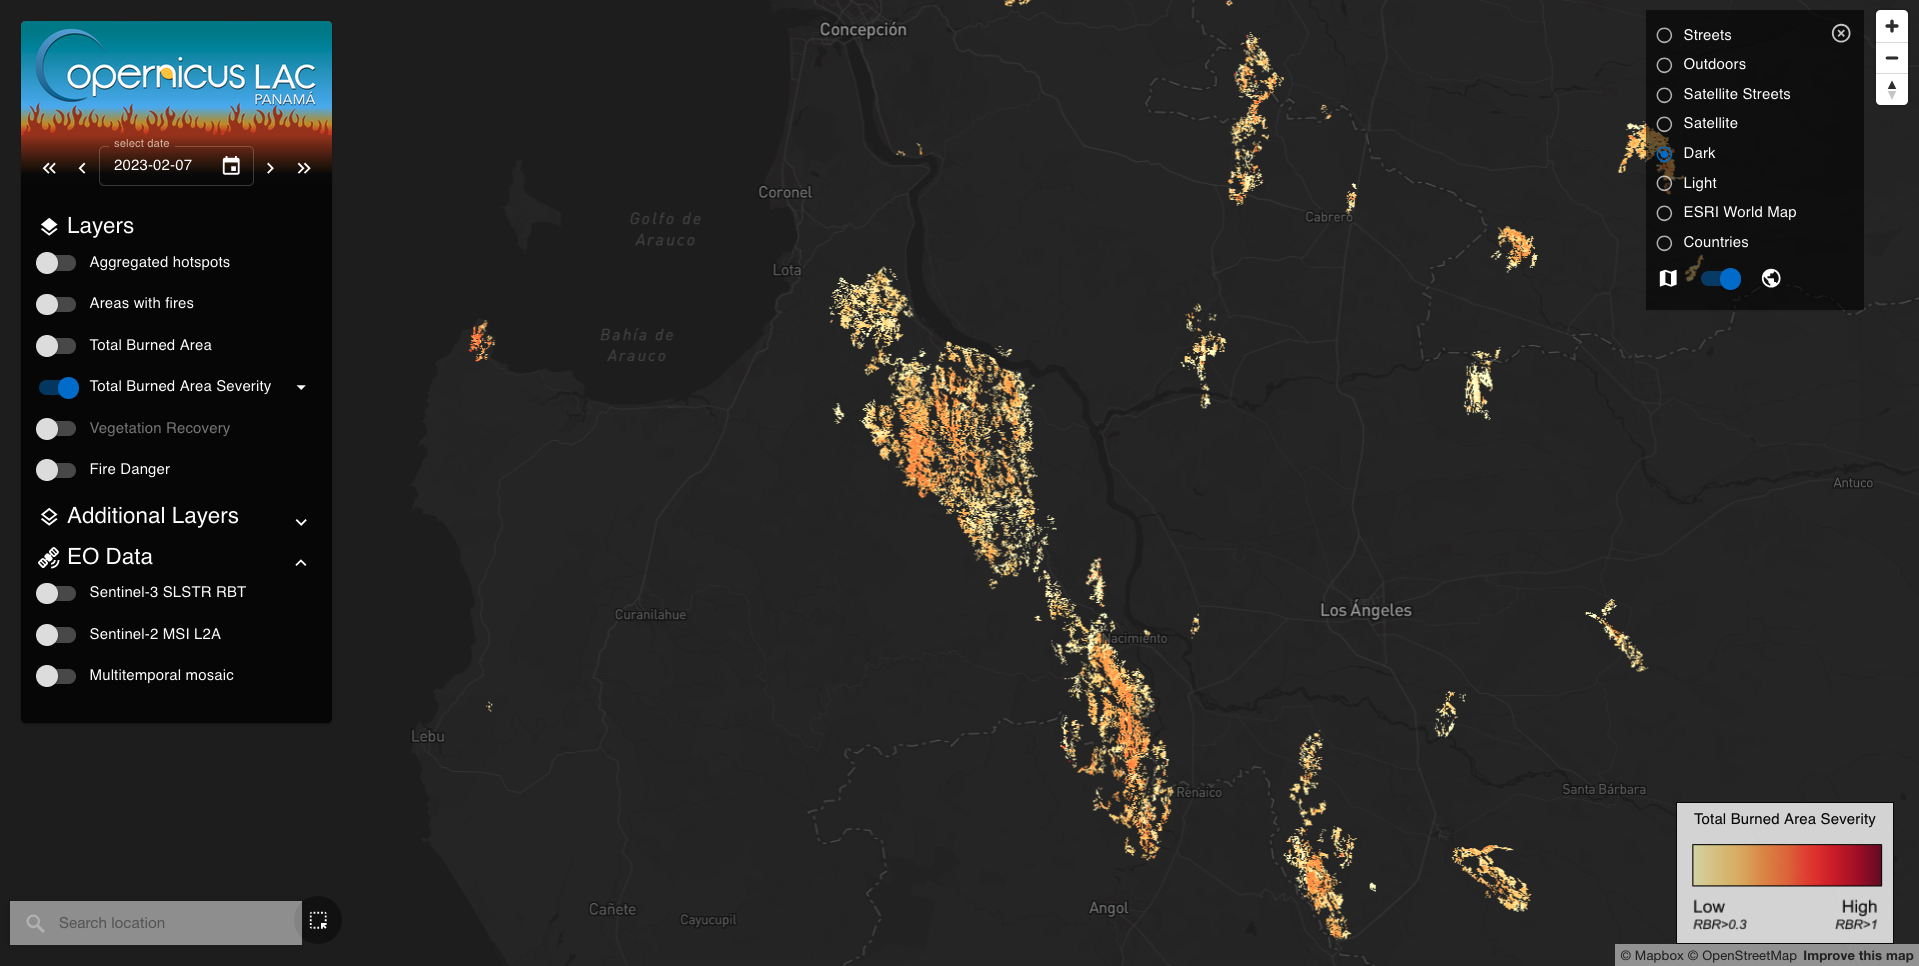
To visualize the Total Burned Area Severity product at full resolution derived from pre- and post-even Sentinel-2 imagery, turn off the Sentinel-2 MSI L2A layer, and turn on the Total Burned Area Severity layer. The legend of the Total Burned Area Severity layer will appear in the bottom right corner of the map.
Download the EO products
To access the Item list panel and find all the items available for the Total Burned Area layer click on the Item List from the available layer buttons.
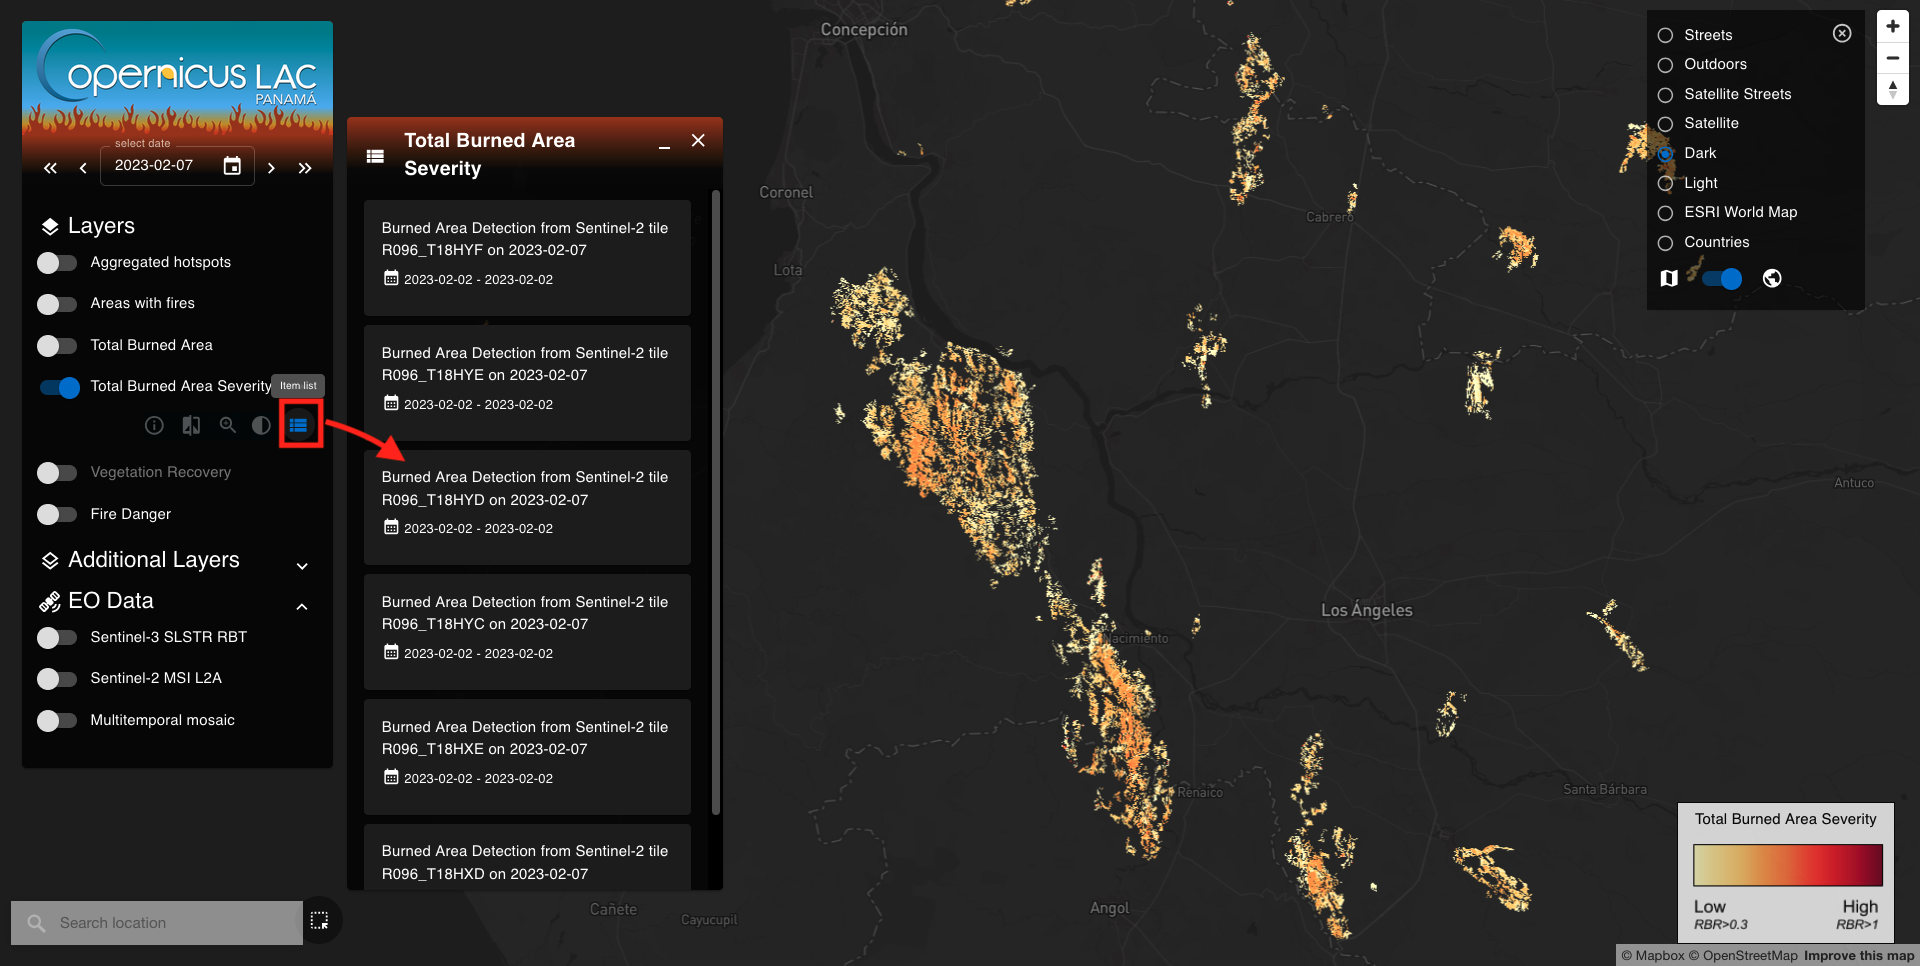
To download the BAS single band asset for a Sentinel-2 tile, click on one of the items in the list and then from the Item details panel click on the available hyperlink under the section Downloads of the metadata.