EVM service tutorial - local level mode
![]()
Find EVM service description and specifications here.
Select the processing service
The EVM service is exposed in all Workspaces of the platform. For the purposes of this tutorial, we will use the service exposed in the Geohazards Workspace.
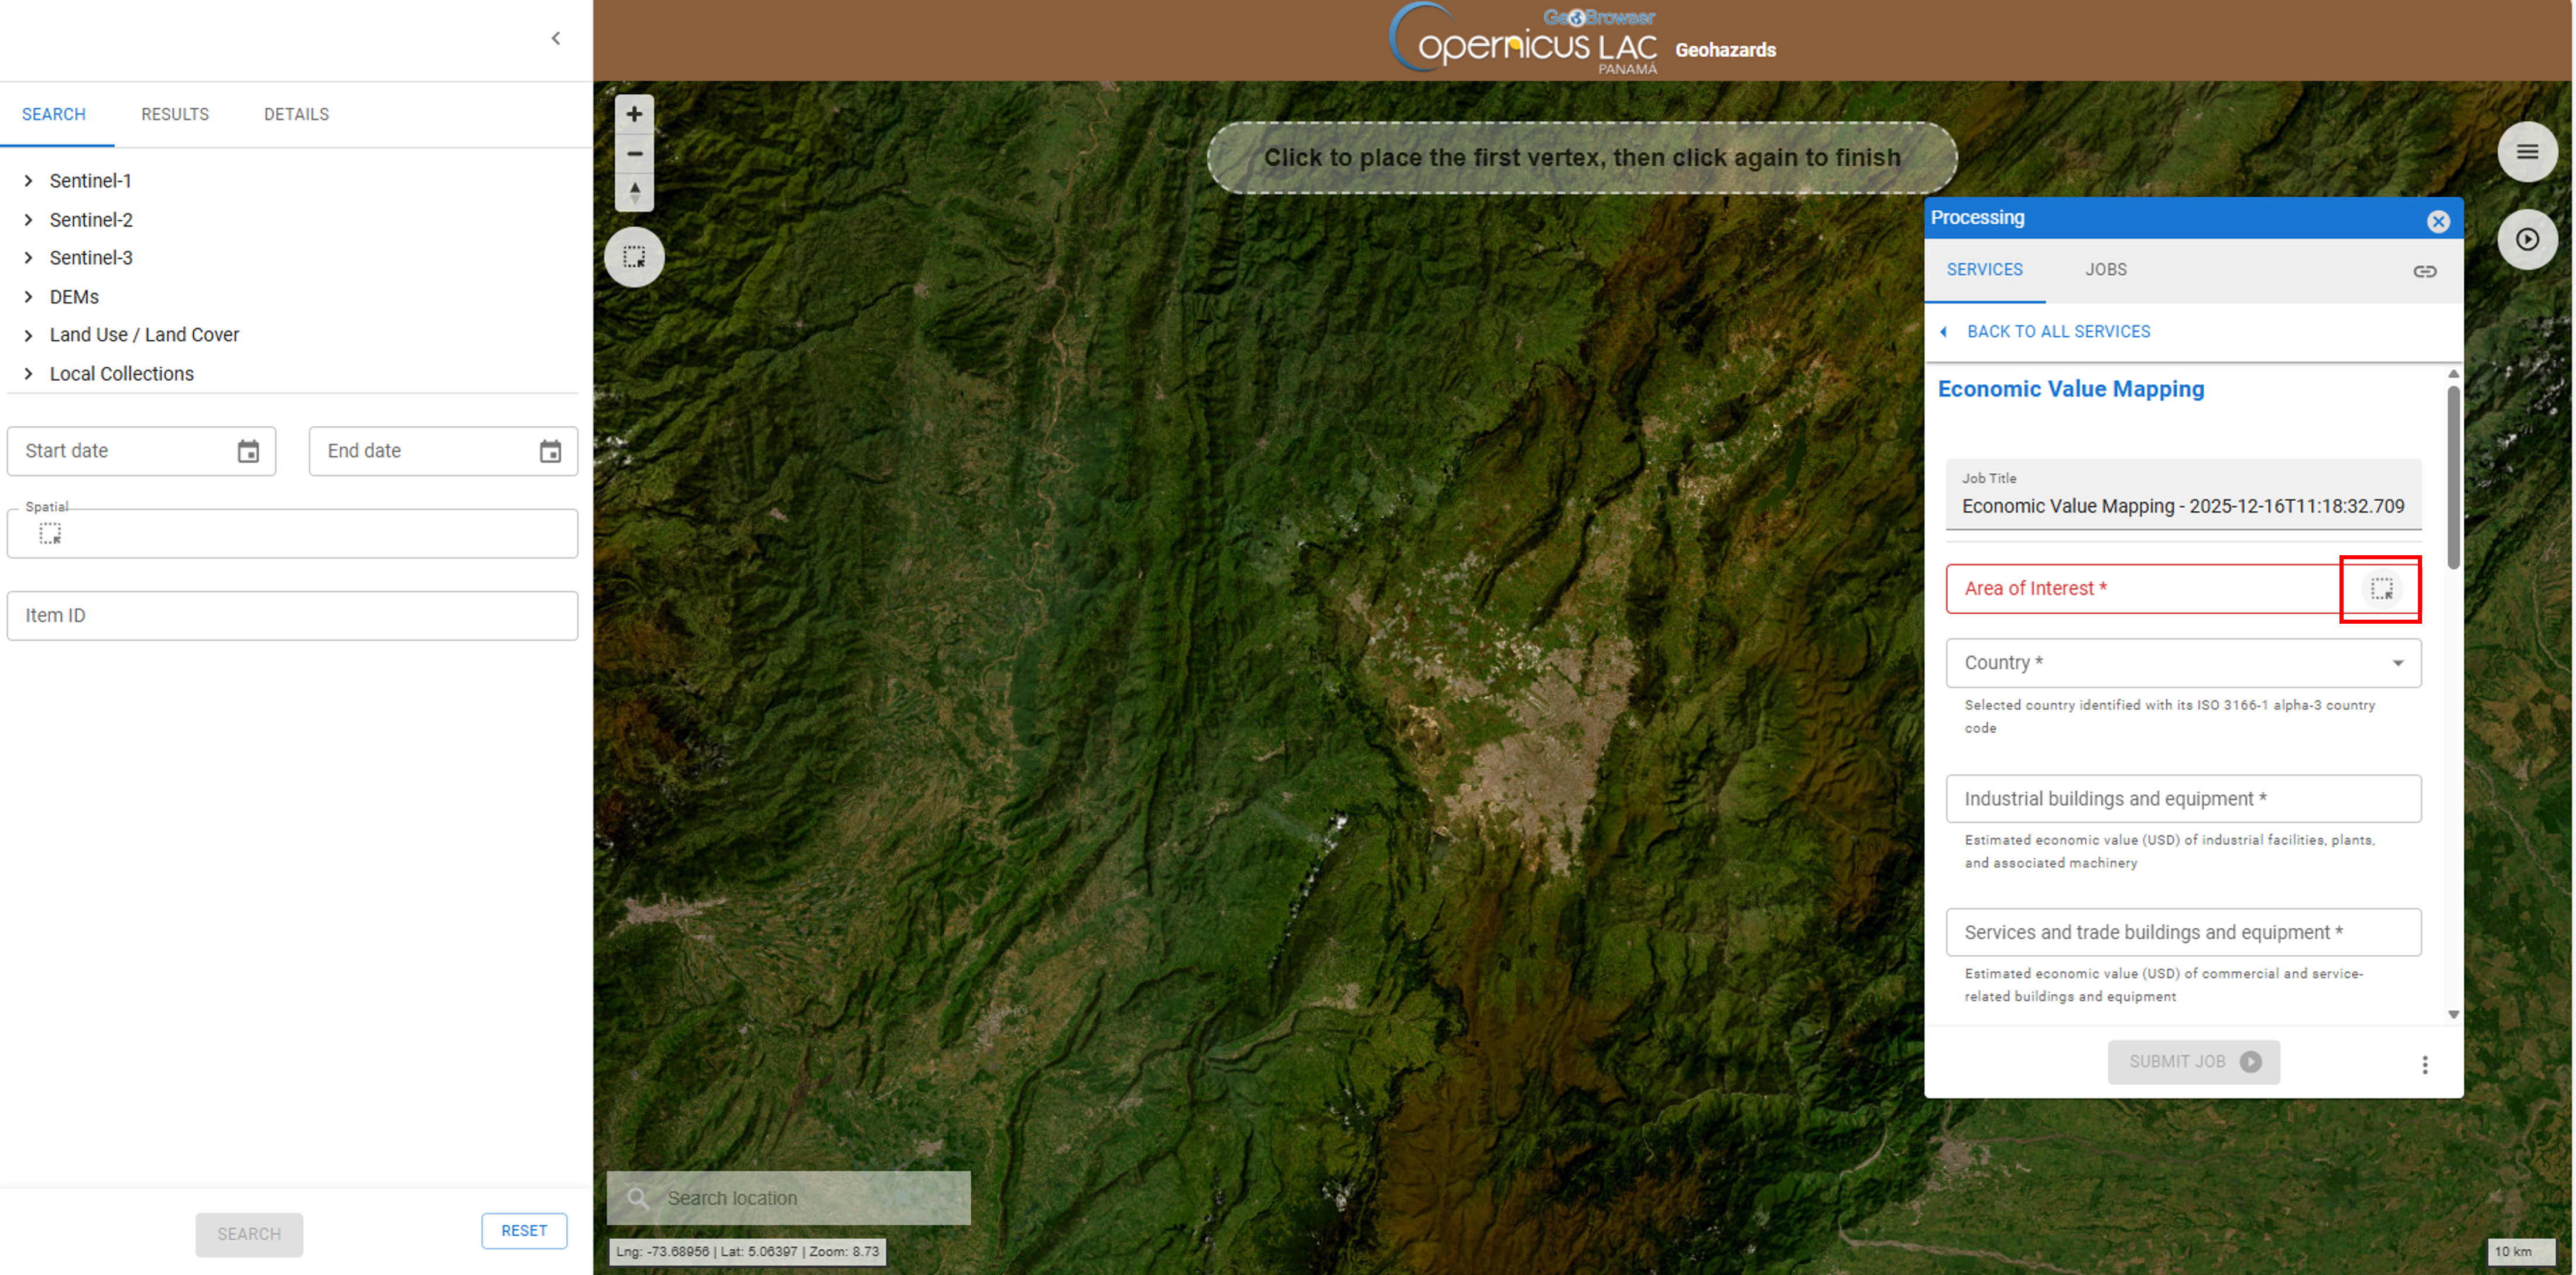
After the opening of the Geohazards workspace of the CopernicusLAC Platform open the Processing Services panel by clicking on the button located on the top right of the map.
The Processing panel will be displayed with the list of on-demand services available for this workspace.
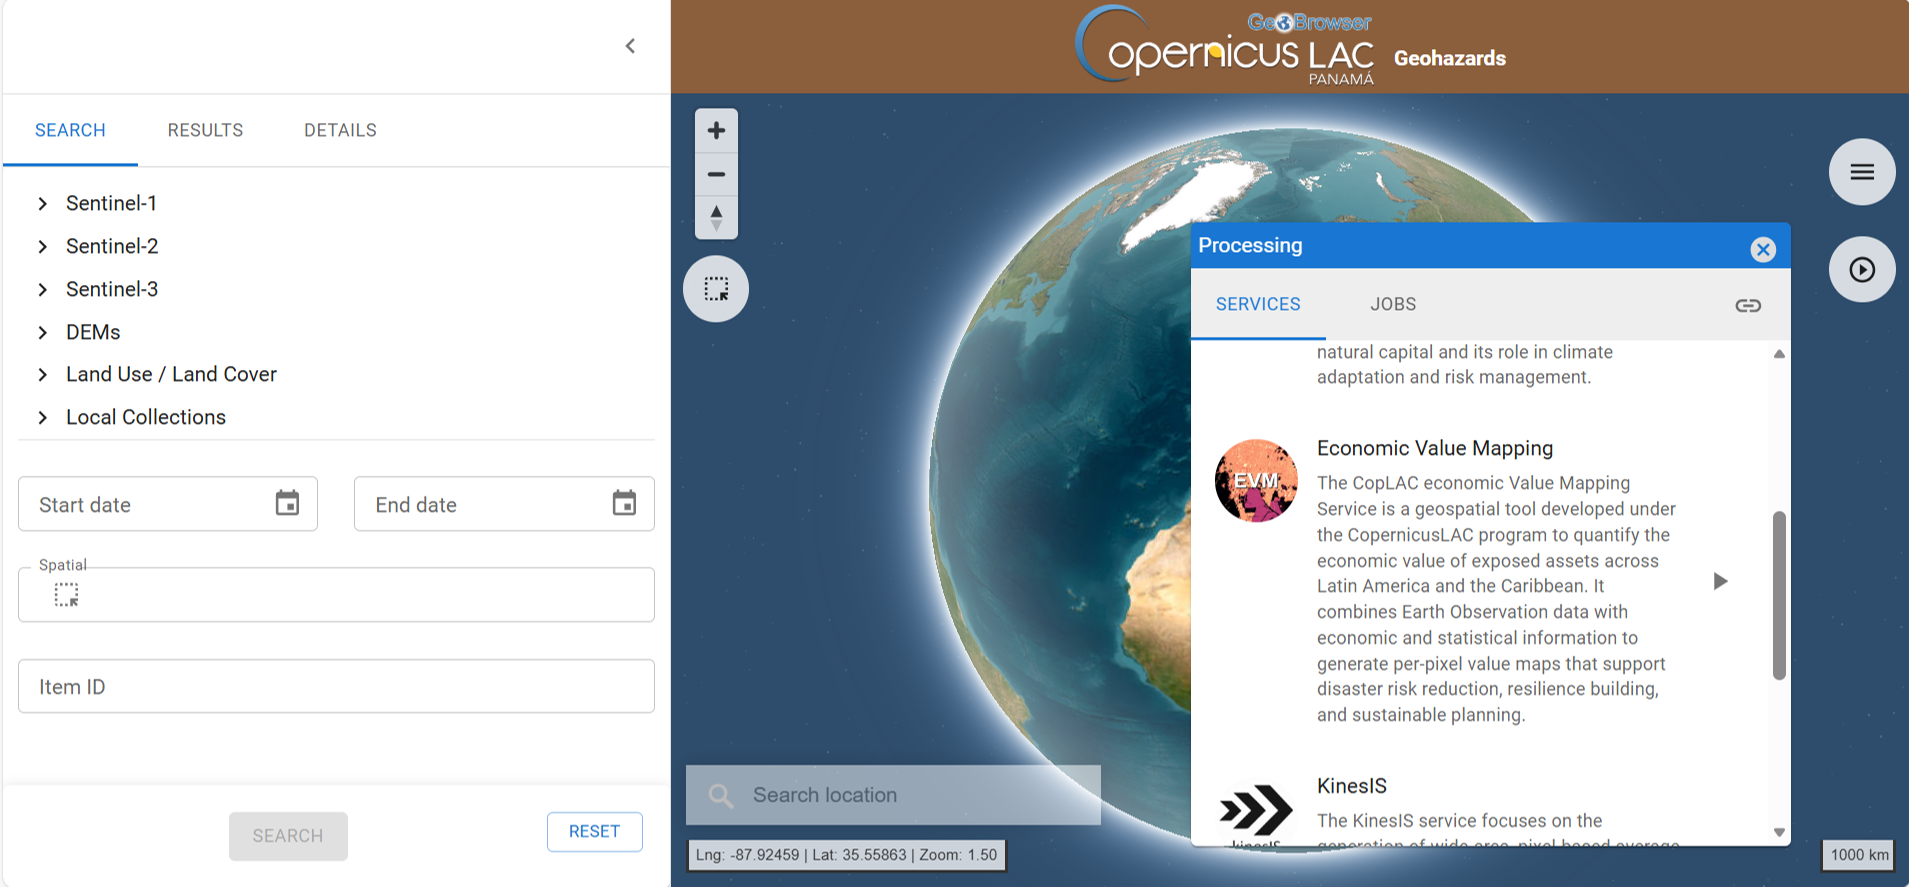
Find the Economic Value Mapping (EVM) service from the list and click on the button next to it.

An opening tab provides a quick description of the service. In the upper part of the tab are shown:
-
service full name,
-
service caption,
-
hyperlink to the online documentation
-
version of the service.
Below that are listed all mandatory and optional parameters that the user must define when submitting the on-demand processing. Each parameter is described with:
-
a grey circle on the left indicating the format of input value required for the parameter. As an example if the parameter is a string (e.g. catalog reference) or a number (e.g. a threshold),
-
the identifier of the parameter,
-
a brief description of the parameter.
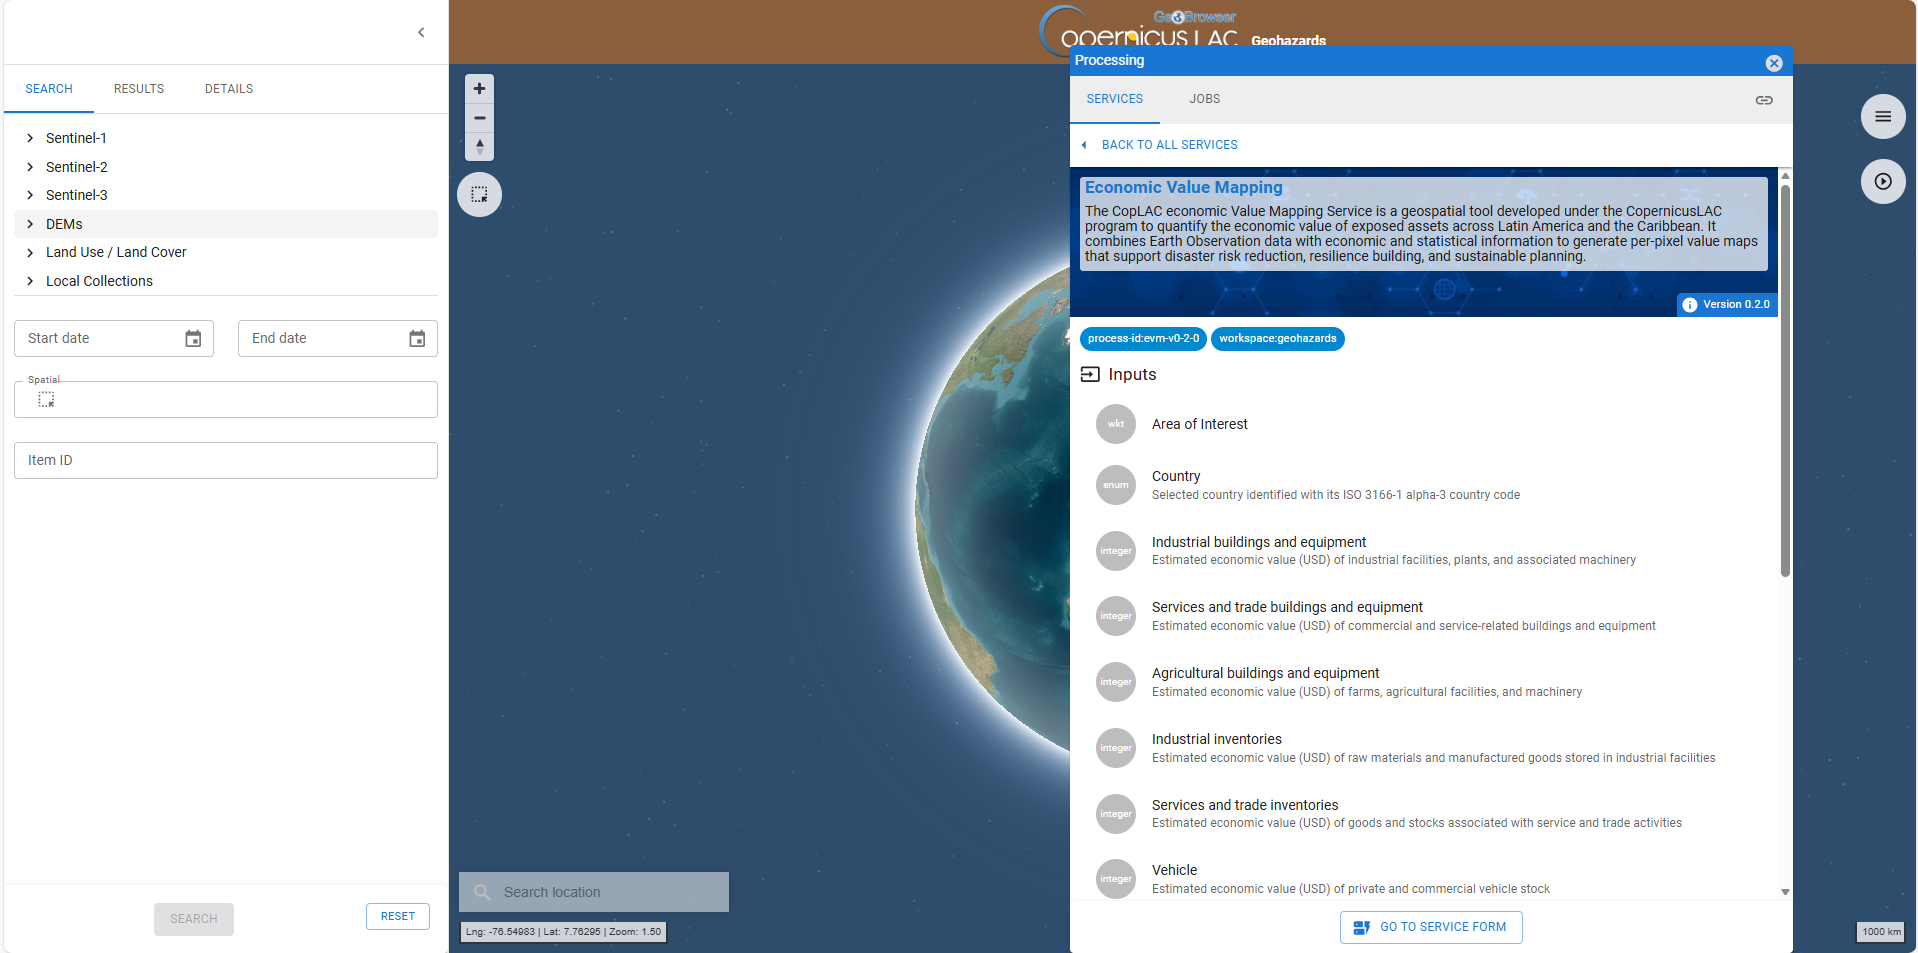
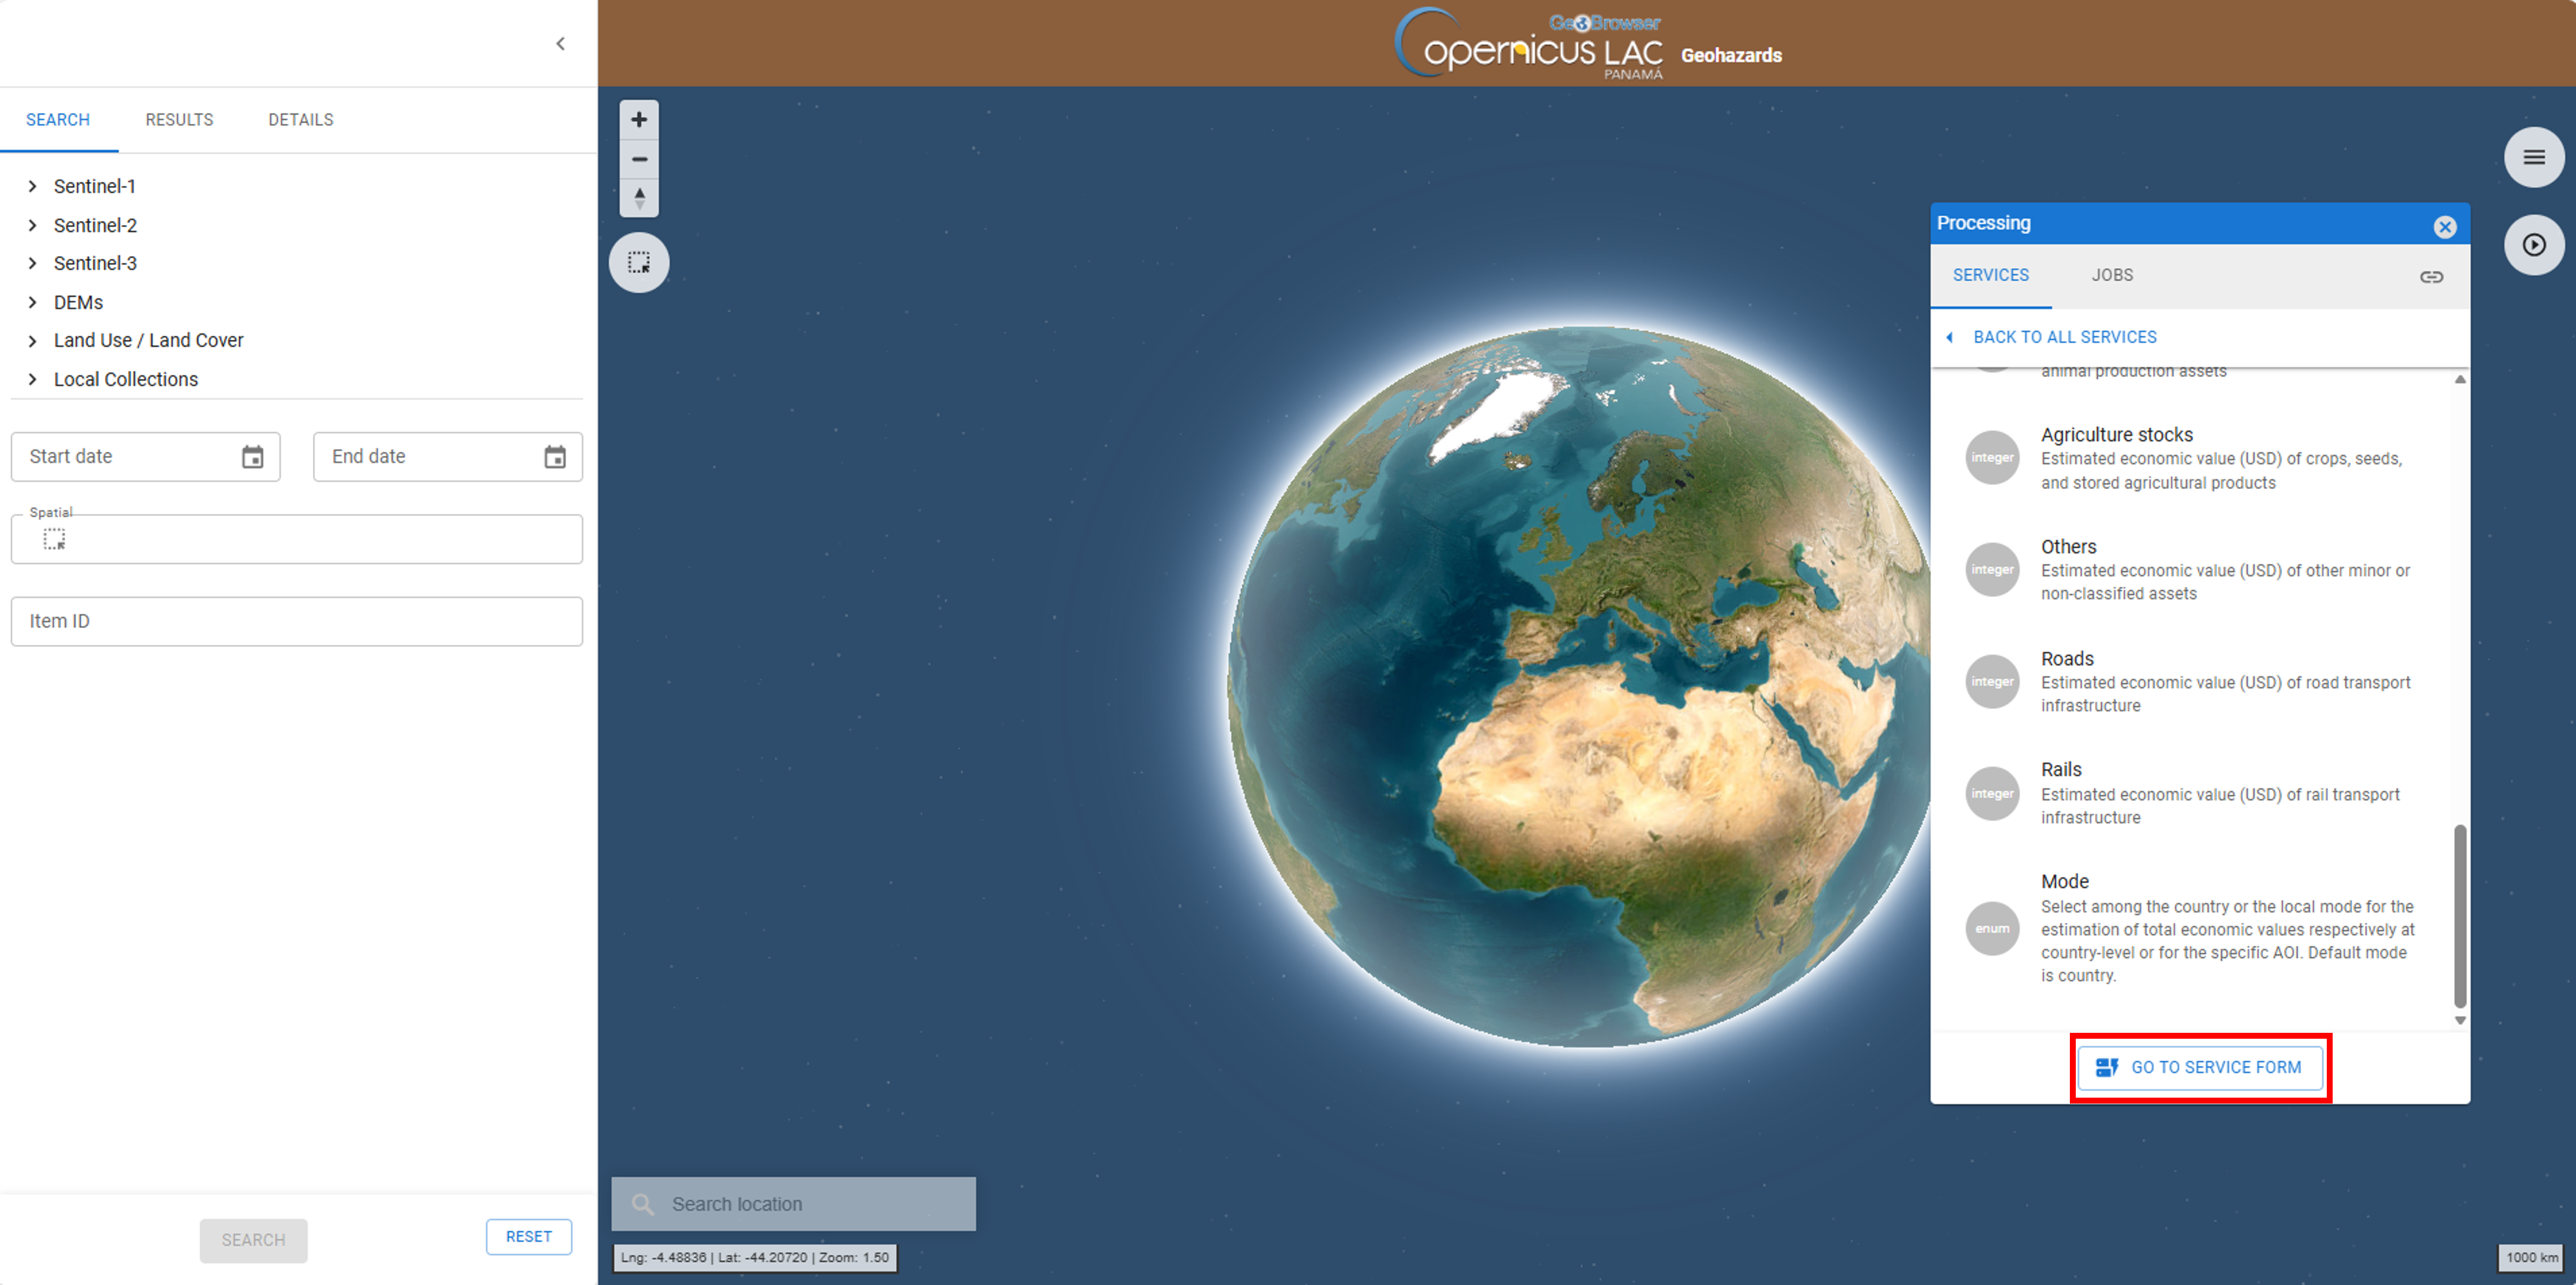
At the bottom of the tab is located the GO TO SERVICE FORM button. Click on it to move to the next tab where the user can fill-in all service parameters and submit the on-demand job.
Hint
To go back to the service panel click on the BACK TO ALL SERVICES button.
Fill the parameters
To start the Economic Value Mapping service, you need to define input parameters. Access the EVM service form and then fill-in the parameters as described in the following sections.
Hint
In case you can't find anymore the EVM service form:
-
open the Processing panel by clicking on the button on the top right of the map,
-
find the EVM service from the list of services,
-
click on the button next to it,
-
and then click on the GO TO SERVICE FORM button.
Job Title
First of all you can assign a name to the on-demand job you are launching. A predefined title is generated by the platform. Modify this title and assign the title you prefer. For instance, insert as Job title:
EVM - Bogotá Colombia 2025-12-10
Note
If you don’t specify a name, the system automatically assigns one using the service name Economic Value Mapping and the date and time of job creation.
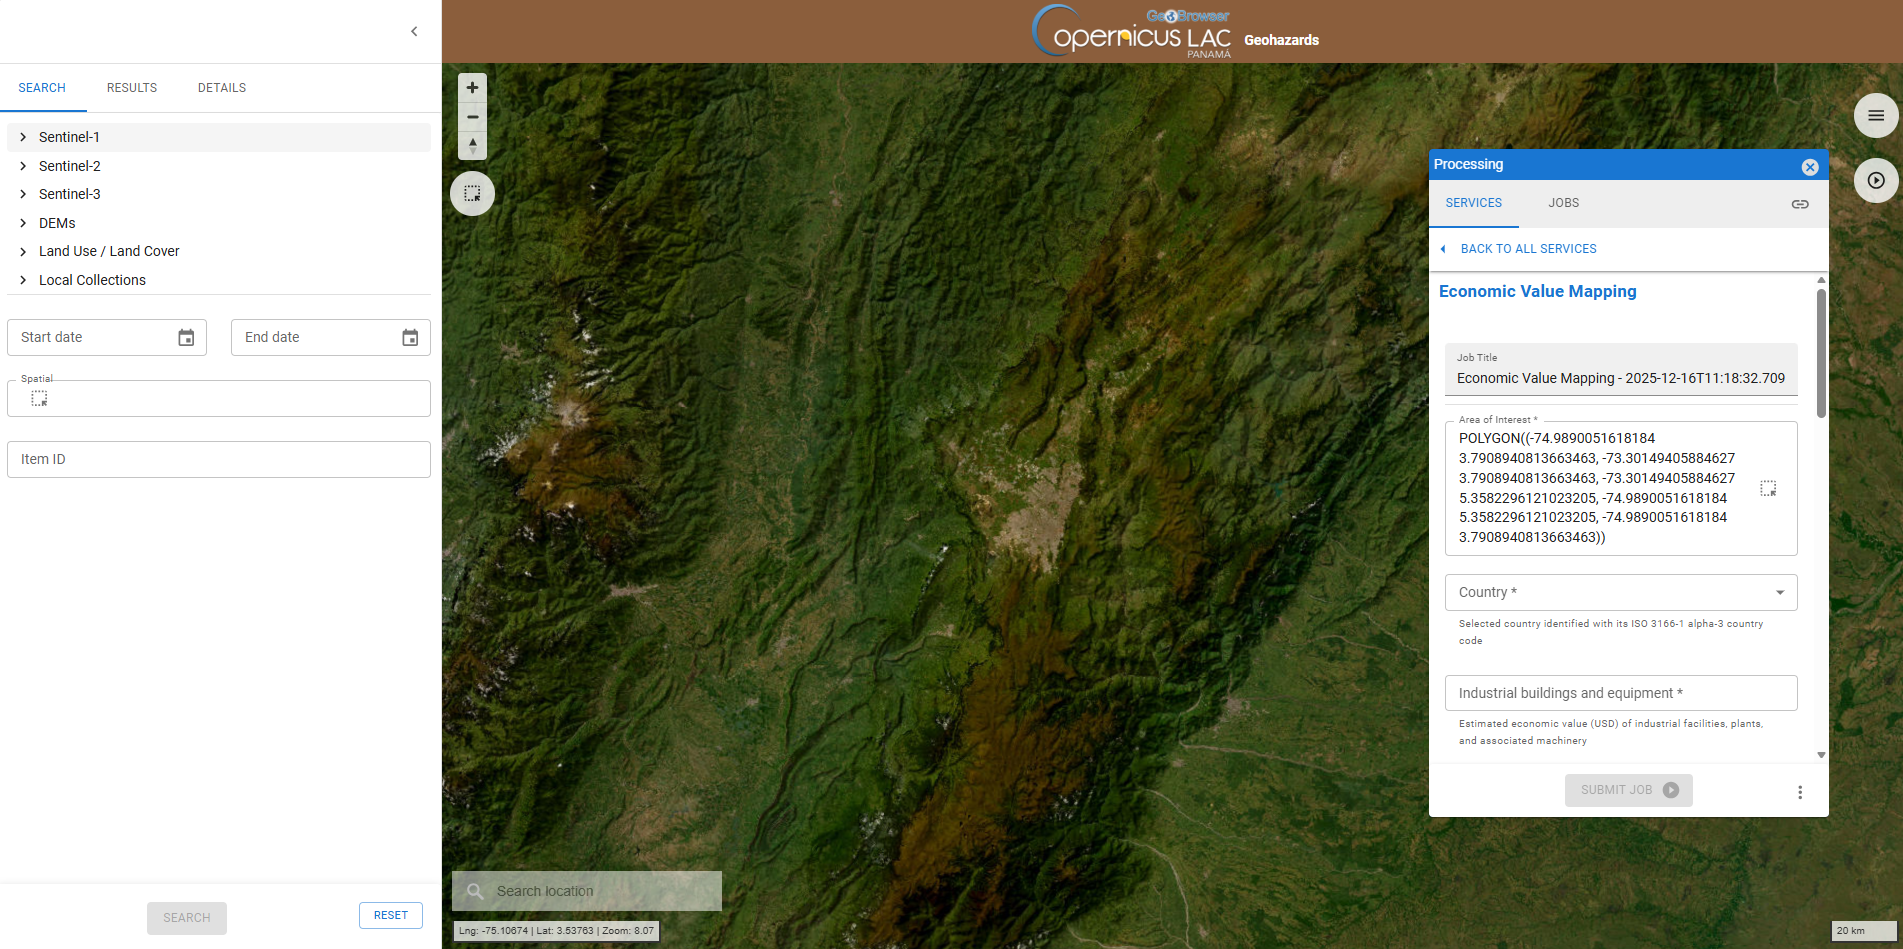
Area of interest
This mandatory parameter allows you to specify the geographic area where you want to estimate the assets' value, and thus will be the area where the economic value maps will be produced by the service. The AOI must be provided as a WKT string representing the geometry of the area (polygon).
To define the AOI through the platform:
- Navigate the map to your AOI (e.g. Bogotá, Colombia).
Hint
Navigation controls are located on the top left of the map. From these buttons the user can:
-
Zoom in (+): left click on the button
-
Zoom out (-): left click on the button
-
Change the viewing angle by setting inclination and orientation: left click and hold the compass button while you drag left and right or up and down.
-
Reset bearing to the north: left click on the compass button
In the 3D view the user can tilt the map in any direction. The 3D tilt control is useful to view hills and mountains.
Hint
To see labels change to another baselayer as an example the Streets one.
Hint
For a quick search of a place of interest you can type the name of the location using the Search Location tool available in the lower left corner of the map.
After the search the map will be automatically zoomed to a BBOX covering the location of interest.
- On the service form, use the drawing tool “Filter by bbox” to draw a polygon describing your AOI.
Hint
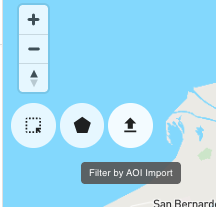
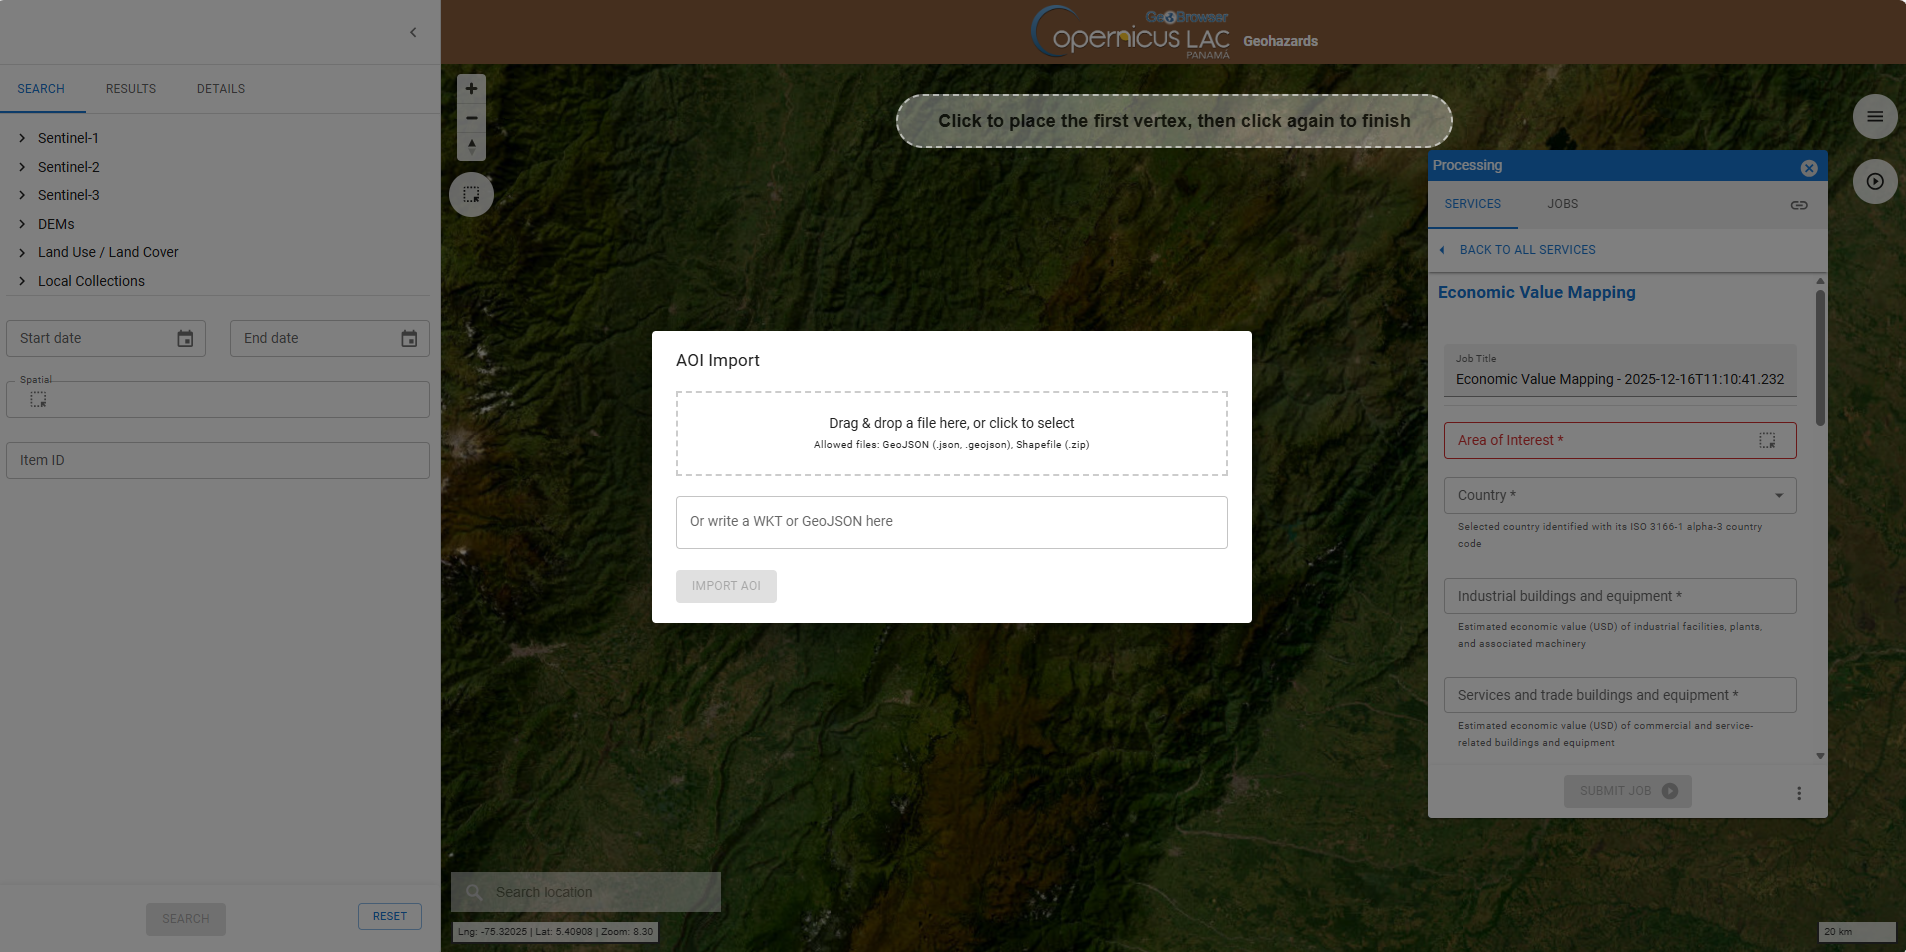
Do you already have a geometry as WKT string or a GeoJSON file and you want to employ it as AOI in your job? There is the option to import your AOI by clicking on Filter by AOI import button located in the upper left corner of the map under the navigation toolbar.
After that paste your WKT value in the dedicated field and click on IMPORT AOI button
-
Once you finish drawing a polygon, a popup box will appear providing the options to SEARCH BY AOI or REMOVE AOI. Click on SEARCH BY AOI to employ this polygon in the search.
-
When you use the "Filter by bbox" tool inside the service form, simply click to place the upper left vertex, and click again on the lower right vertex to finish.
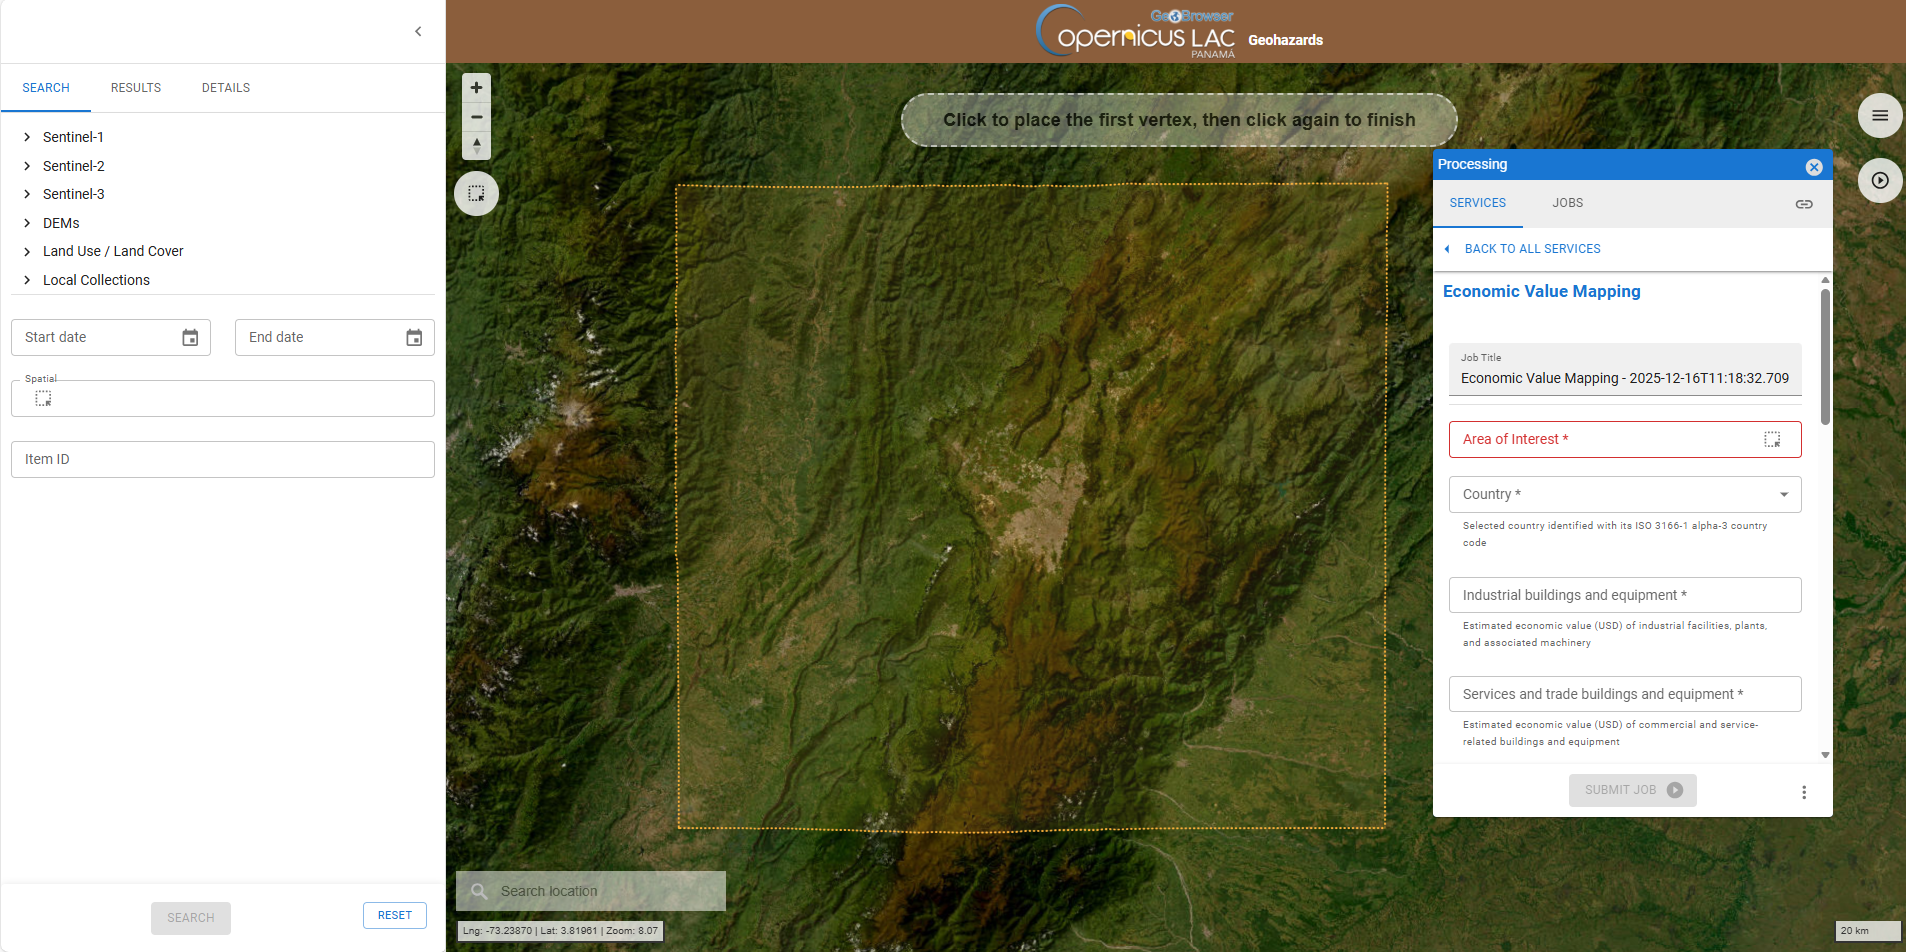
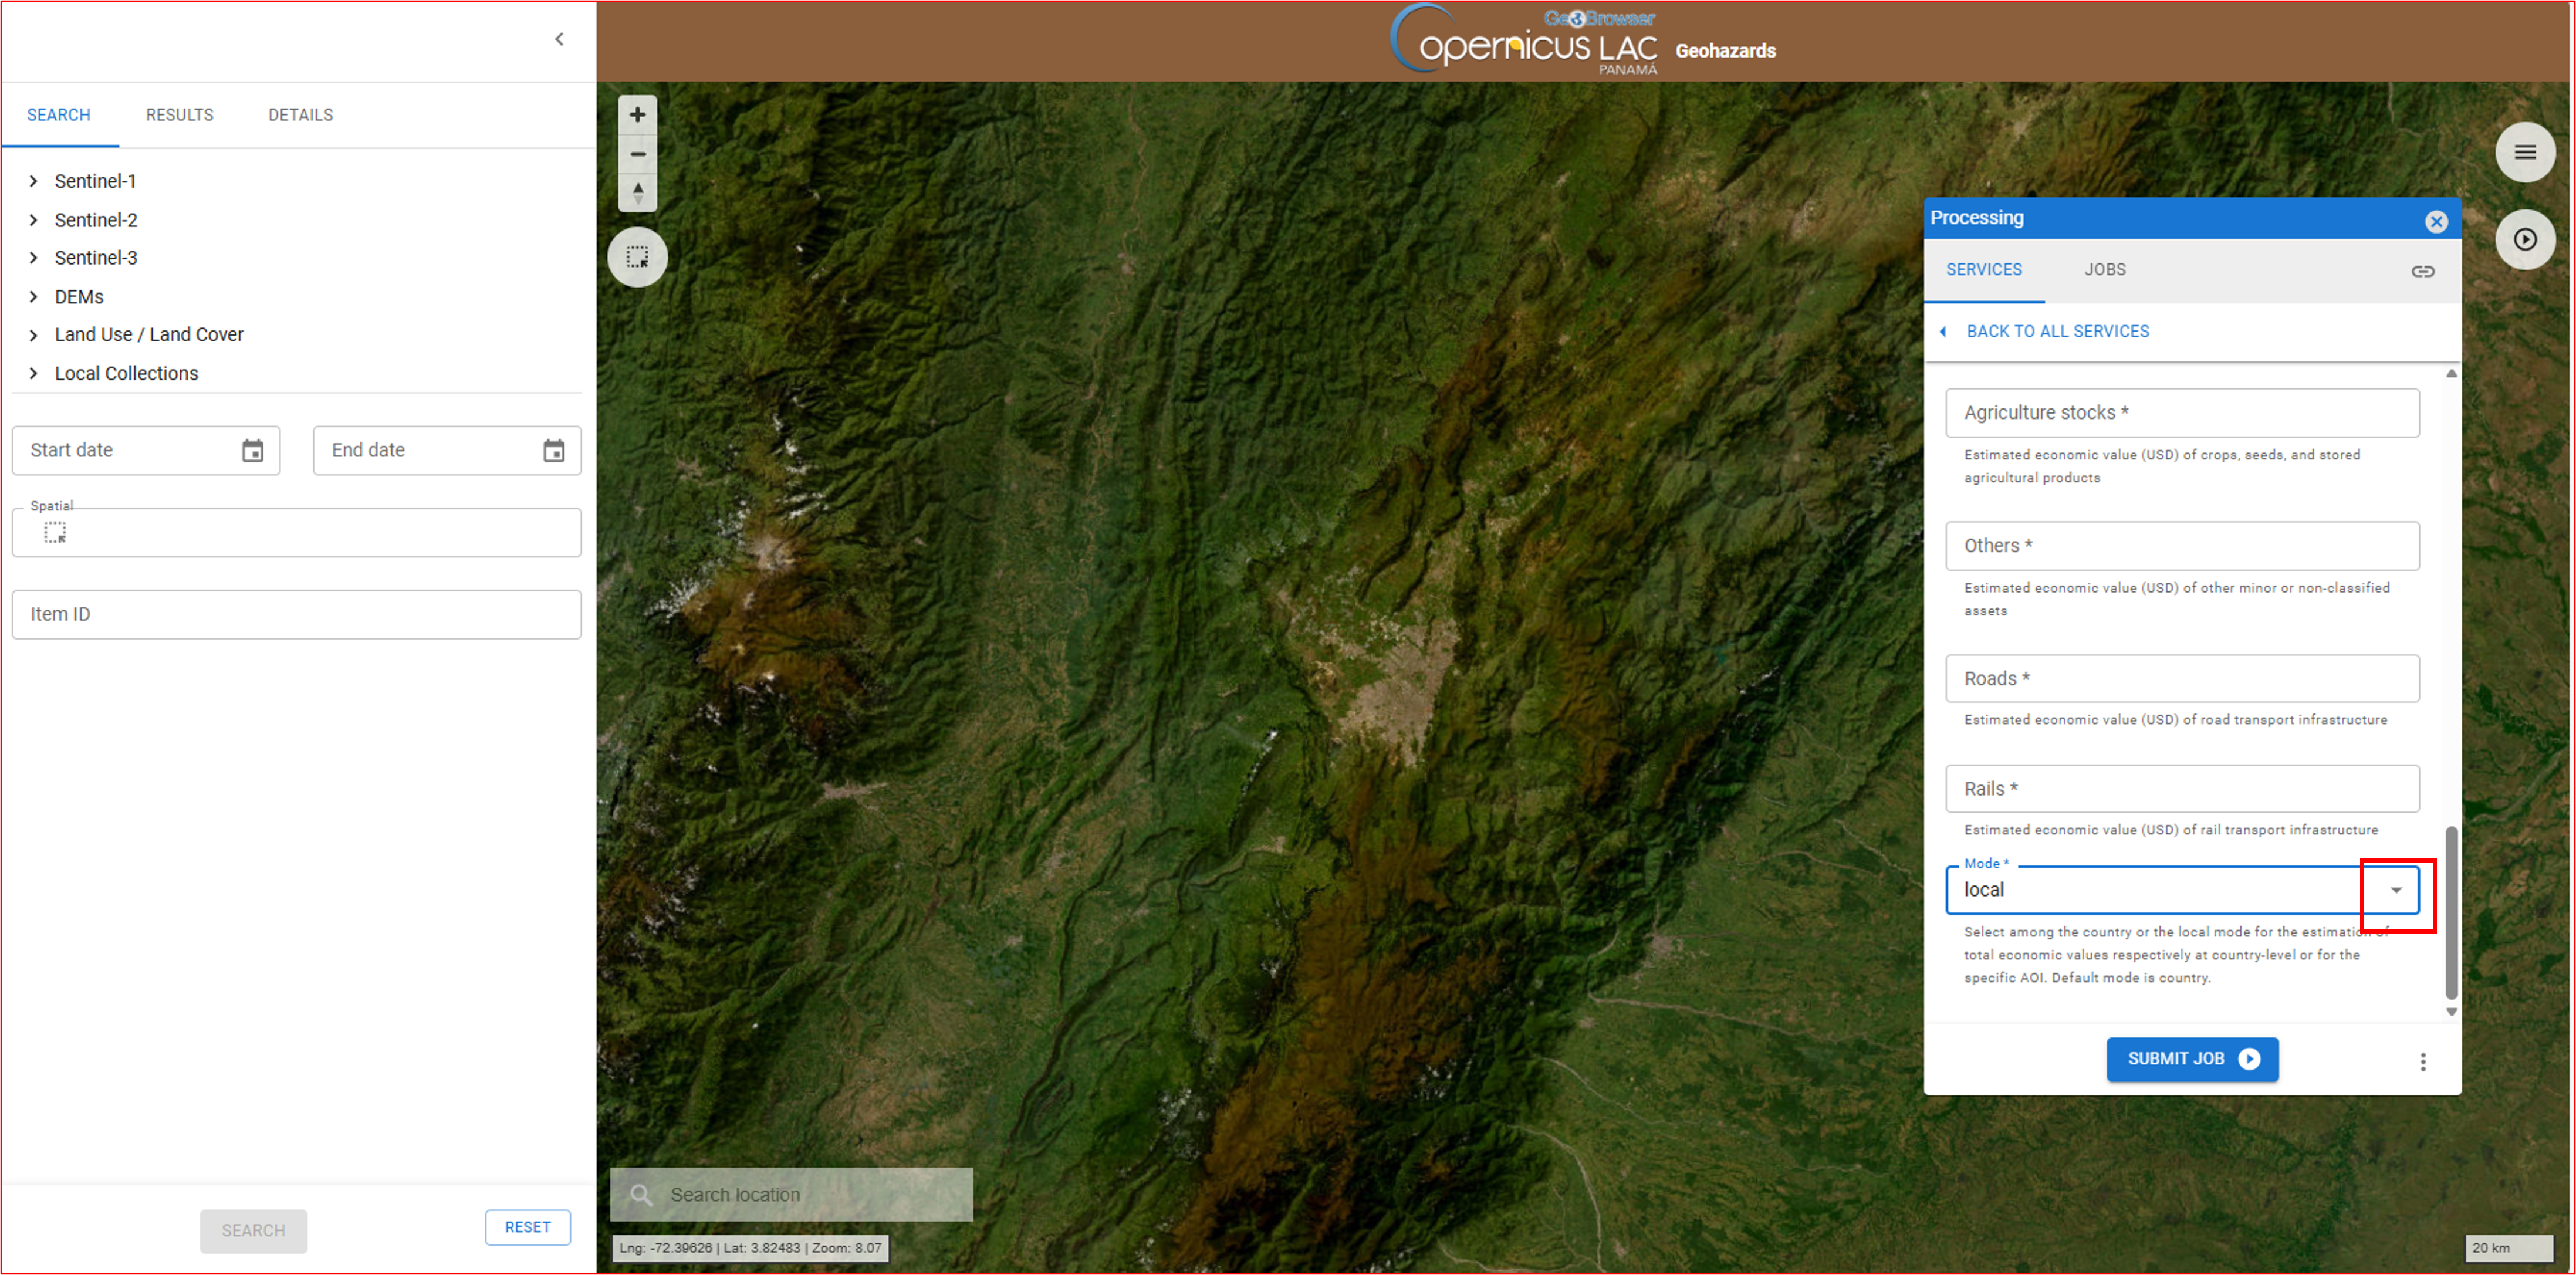
- After that the coordinates of your polygon will automatically appear in the Area of Interest field in your form, as a WKT string like the one appearing in the image.
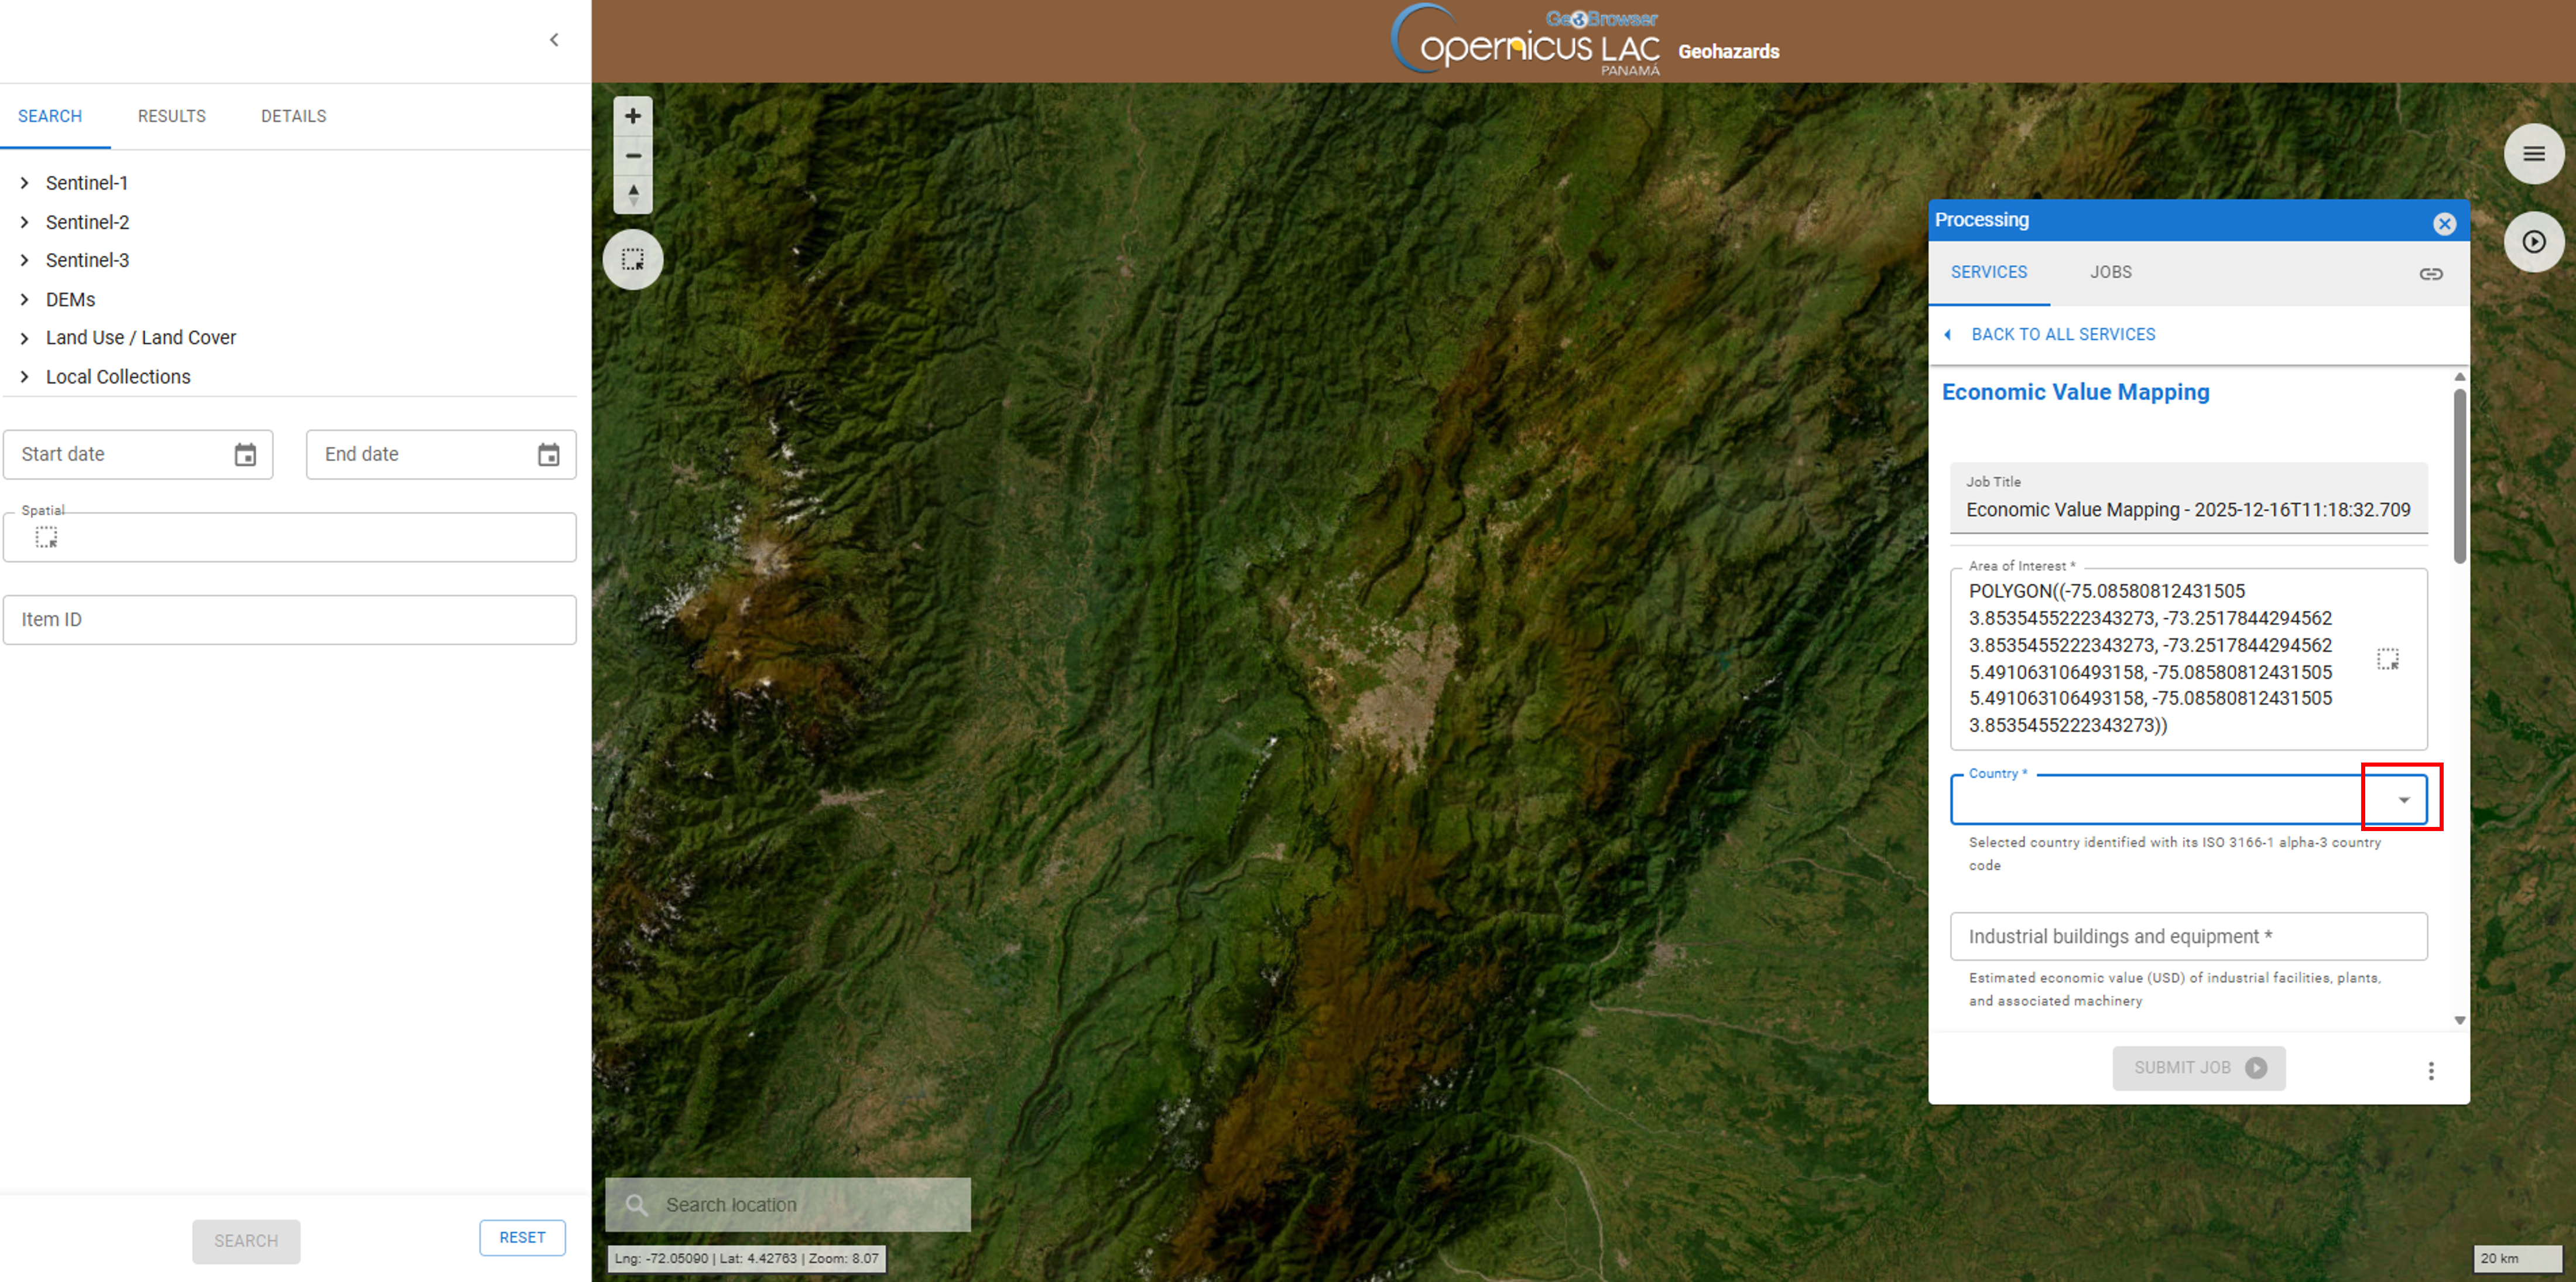
Country selection
For the service to function better, it is important to select which country corresponds to the selected area of interest.
To do so, click on the "Country" selector in the form.
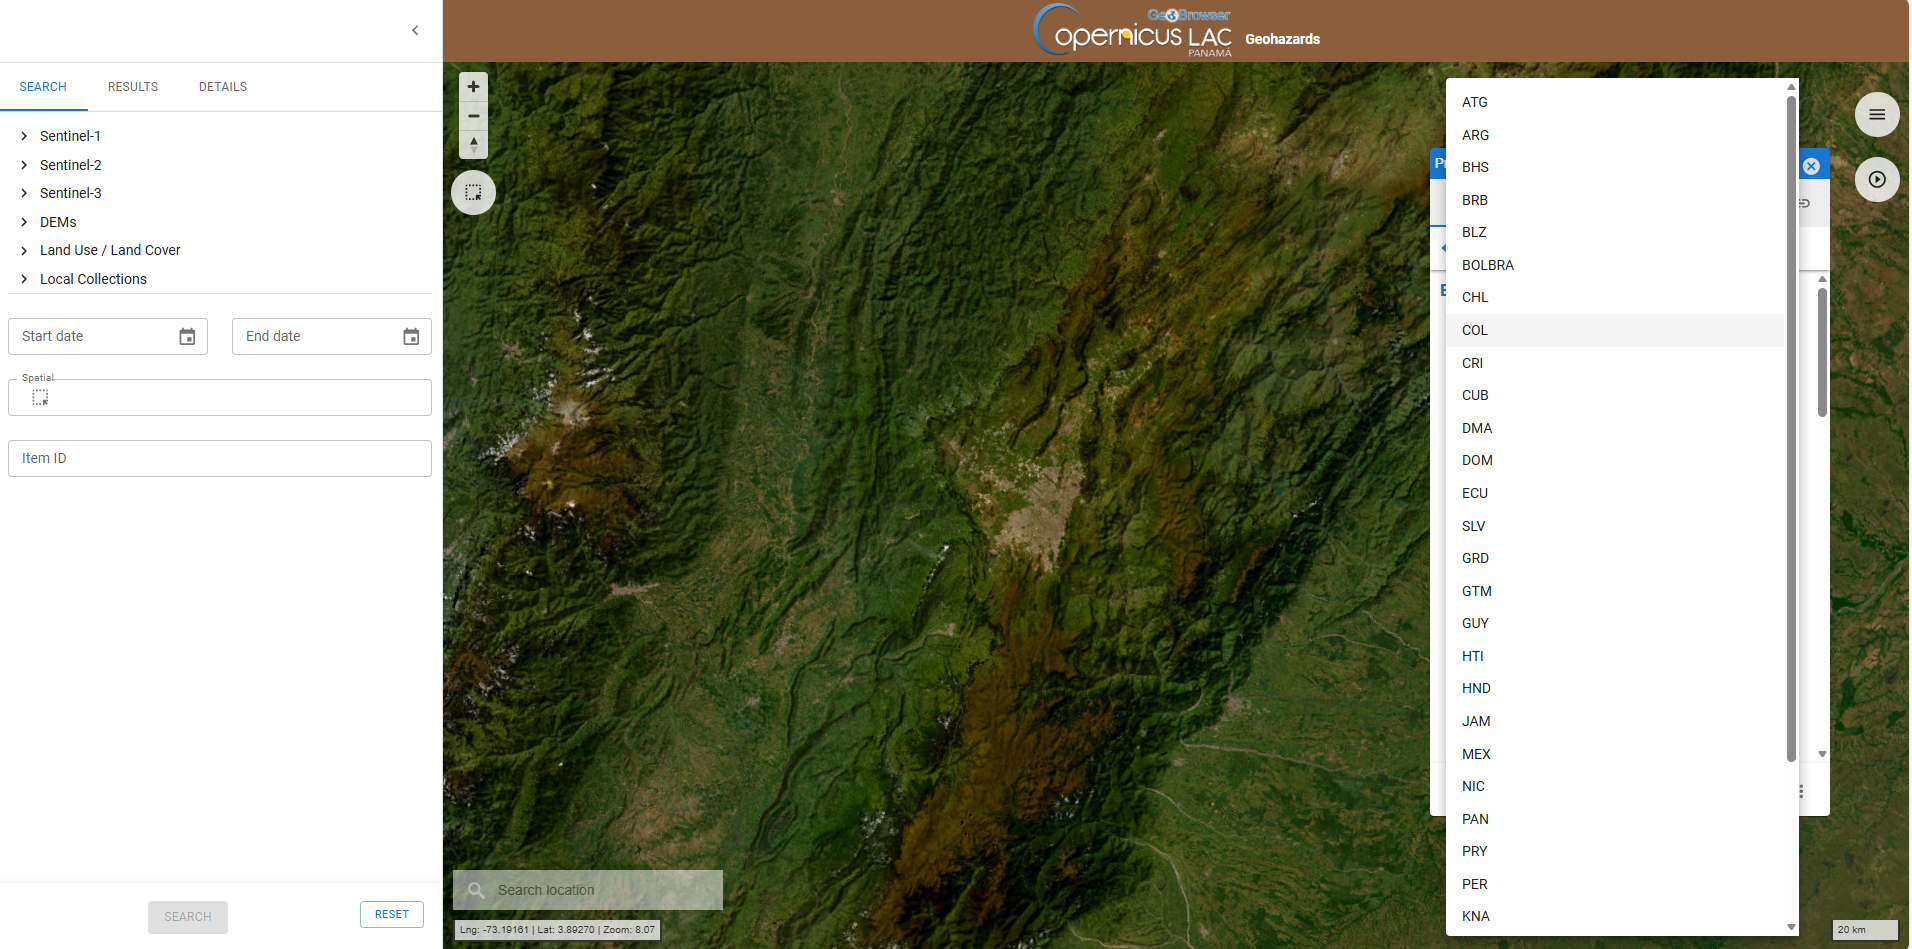
Then, a list of three-letter codes for each country will appear, as shown in the image. Select the code for the country you are interested in.
Economic values
The Economic Value Mapping service is based on geospatial data and statistical and economic values of each country in Latin America and the Caribbean.
For detailed information on the geospatial data used, please refer to the service specifications.
Regarding the economic data, the service relies on two types of data sources:
-
Default values : Predefined estimates of asset values at the national level, available in here.
-
User-provided values: Custom inputs that can either: -Replace the national defaults for the entire country, or -Specify local values for the selected area of interest
These asset values represent the economic exposure of different components. The categories include:
- Private Housing : Residential buildings such as homes and apartments.
- Household Content : Furniture, appliances, and household goods inside homes.
- Industrial Buildings and Equipment : Factories, warehouses, and machinery.
- Services and Trade Buildings and Equipment : Offices, schools, hospitals, shops, and related equipment.
- Agricultural Buildings and Equipment : Farm structures and machinery.
- Industrial Inventories : Goods and materials stored by manufacturing industries.
- Services and Trade Inventories : Stock held by service providers and trade businesses.
- Vehicles : Cars, trucks, and other motor vehicles.
- Livestock : Animals used for meat, dairy, and related products.
- Agricultural Stocks: Stored crops and agricultural products.
- Roads: The existing road network.
- Railways: The railway network.
- Others (Green Spaces, Wetlands, Forests): Natural areas and forest resources.
In the following sections, we will explain how to modify these values in the service form so you can adapt the economic data to your specific context.
Warning
Users can customize the values as indicated, either at national level or local level.
- If no modifications are made, the service will use the default values.
- All modifications must have the same scope (all at the national level or all at the local level, and modify the mode in the last field accordingly).
Warning
DISCLAIMER: The default values for Private Housing, Industrial Buildings and Equipment, and Services and Trade Buildings and Equipment are derived from the Global Exposure Model (GEM), published by the GEM Foundation under the Creative Commons BY-NC-SA 4.0 license. Original data © GEM Foundation. For details on the license, visit: LICENSE..These values are used as input in the service to calculate exposure by area of interest and pixel type. No endorsement by GEM is implied.
Industrial buildings and equipment
This value represents the total accumulated cost of industrial facilities and their equipment, such as factories, warehouses, and machinery. It reflects the economic exposure of the industrial sector within the selected scope (national or local) as defined in the Mode field.
To customize the value, simply insert in the field the total asset value in US Dollars either at national level or at local level as shown in the image.
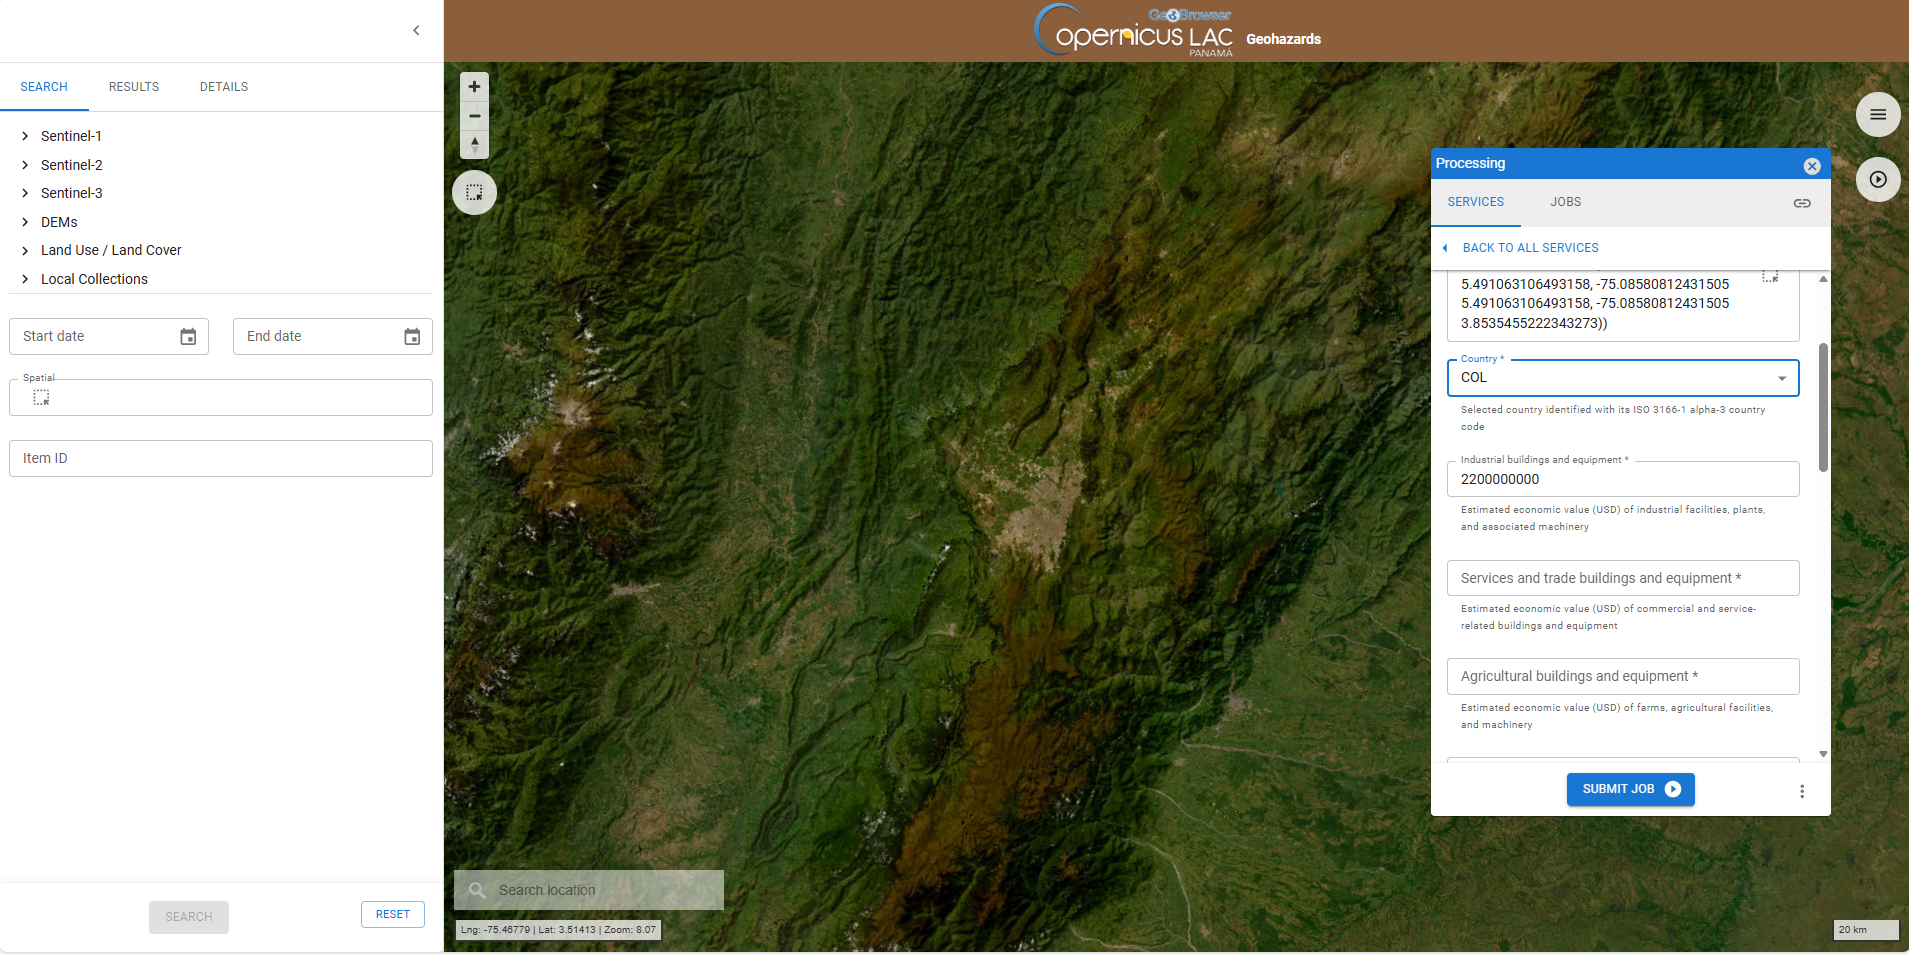
The remaining fields are customized the same way.
Services and trade buildings and equipment
This value corresponds to the total accumulated cost of buildings and equipment used for services and trade, including offices, schools, hospitals, shops, and malls. It represents the economic exposure of these sectors for the chosen scope.
Agricultural buildings and equipment
This value indicates the total accumulated cost of agricultural,forestry and fishing facilities and machinery, such as barns, silos, irrigation systems, and farm equipment. It reflects the economic exposure of agricultural,forestry and fishing infrastructure.
Industrial Inventories
This value refers to the total accumulated value of goods and materials stored by manufacturing industries, representing production stock within the selected area or country.
Services and Trade Inventories
This value represents the total accumulated value of goods and stock held by service providers and trade businesses, such as retail inventories and supplies.
vehicles
This value corresponds to the total accumulated value of motor vehicles, including cars, trucks, and other transport units, adjusted for depreciation and fleet size.
Private Housing
This value represents the total accumulated cost of residential buildings, such as houses and apartments, within the selected scope.
Household Content
This value indicates the total accumulated value of household goods, including furniture, appliances, and personal items inside homes.
Livestock
This value refers to the total accumulated monetary value of animals used for meat, dairy, and related products, reflecting the economic exposure of livestock activities.
Agriculture Stocks
This value represents the total accumulated value of stored crops and other agricultural products, indicating the economic exposure of agricultural production. It considers:
- Cereals, unprocessed
- Crops
- Fibre crops, unprocessed
- Fruits, unprocessed
- Maize (corn)
- Oilcrops, unprocessed
- Rice
- Roots and Tubers, unprocessed and derived products
- Sugar crops, unprocessed
- Vegetables, unprocessed
Others
This value represents the total accumulated value of natural areas and forest resources, including wood products such as logs, sawn timber, planks, pulp, and sawdust. It reflects the economic exposure of forest-related assets within the selected scope.
Roads
This value corresponds to the total accumulated cost of the road network, based on its length and construction characteristics.
Rails
This value indicates the total accumulated cost of the railway network, considering track length and type.
Mode of execution
This field defines the scope of the economic values you are entering:
-
Country The value represents the total accumulated amount at the national level. Use this option when you want to use a custom value for the entire country instead of the default values.
-
Local (AOI) The value represents the total accumulated amount within the selected Area of Interest (AOI). Use this option when you want to specify a localized value for the area you are analyzing.
Depending on the nature of your data select one of the two options available. Remember that the 'country' level is the one appearing per default.
Run the job
After filling in all the required parameters, click SUBMIT JOB to start the service.
Once submitted, you will be automatically redirected to the JOBS tab, where you can view the list of all previously submitted jobs. Your newly created job will appear at the top of the list.
From this tab, you can monitor the progress of your job, which can have one of the following statuses: running, succeeded or failed.
Note
Typically, the service execution takes some minutes depending on the extent of the user’s AOI and the allocation of processing resources for the job to be executed. As an example, to employ the EVM service over an AOI of 250 square kilometers the processing time is approximately 8 minutes.
Results
Once the job is successfully accomplished, under the job details click on the button SHOW RESULTS ON MAP located in the JOBS tab of the left panel.
After that all the products generated by the service will be displayed on the map.
From the details of the job, accessible in the JOBS tab of the left panel, you can consult the input parameters employed in this job and you can access the results generated by the service. This is possible by clicking on the Input or the Results dropdown list buttons.
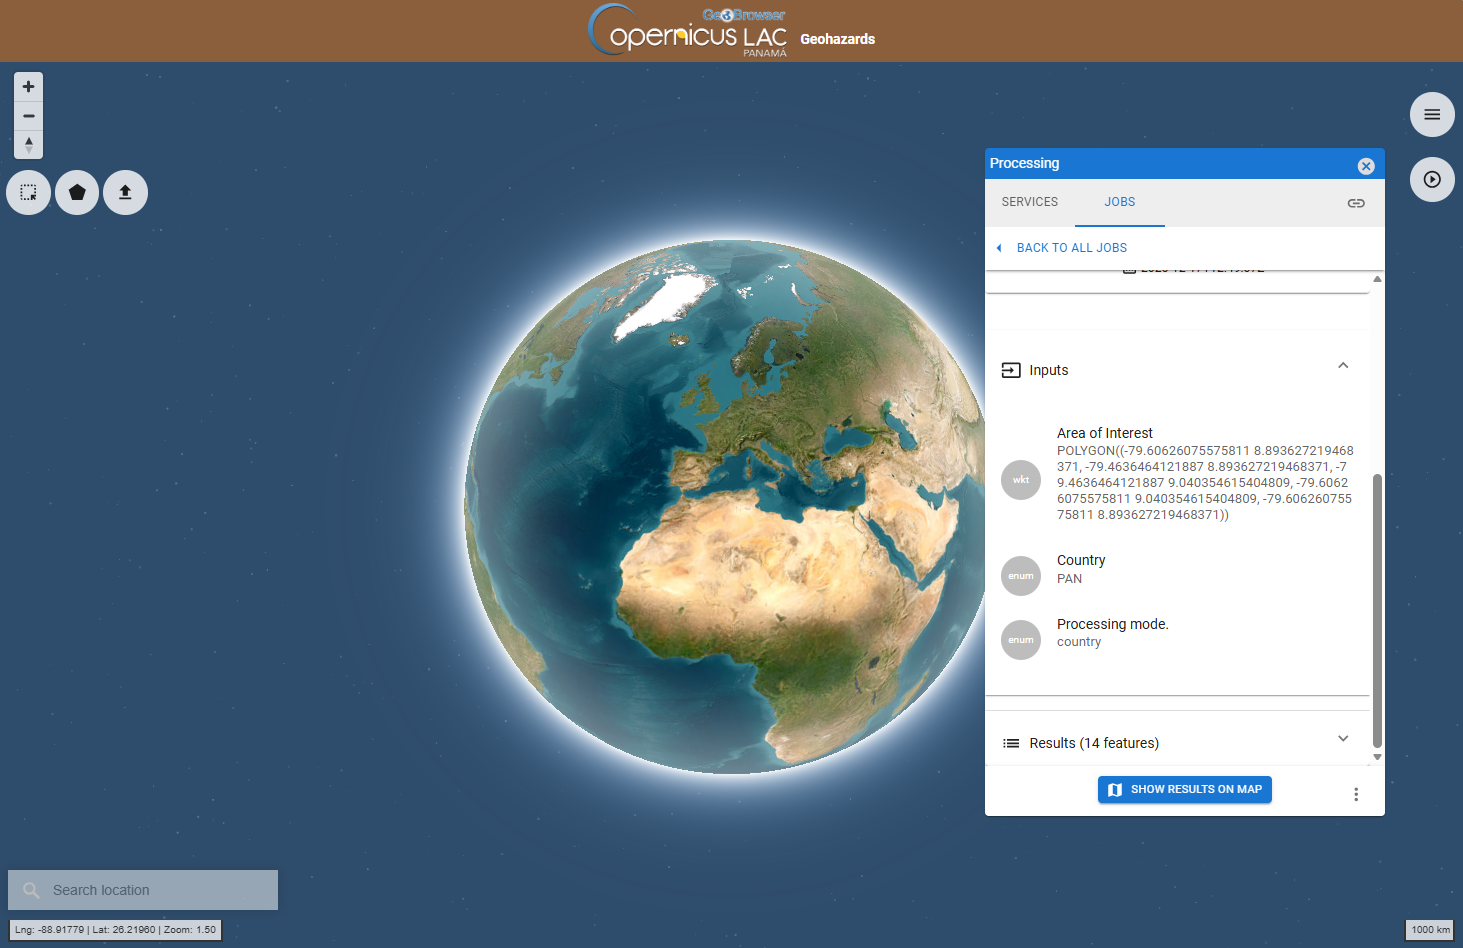
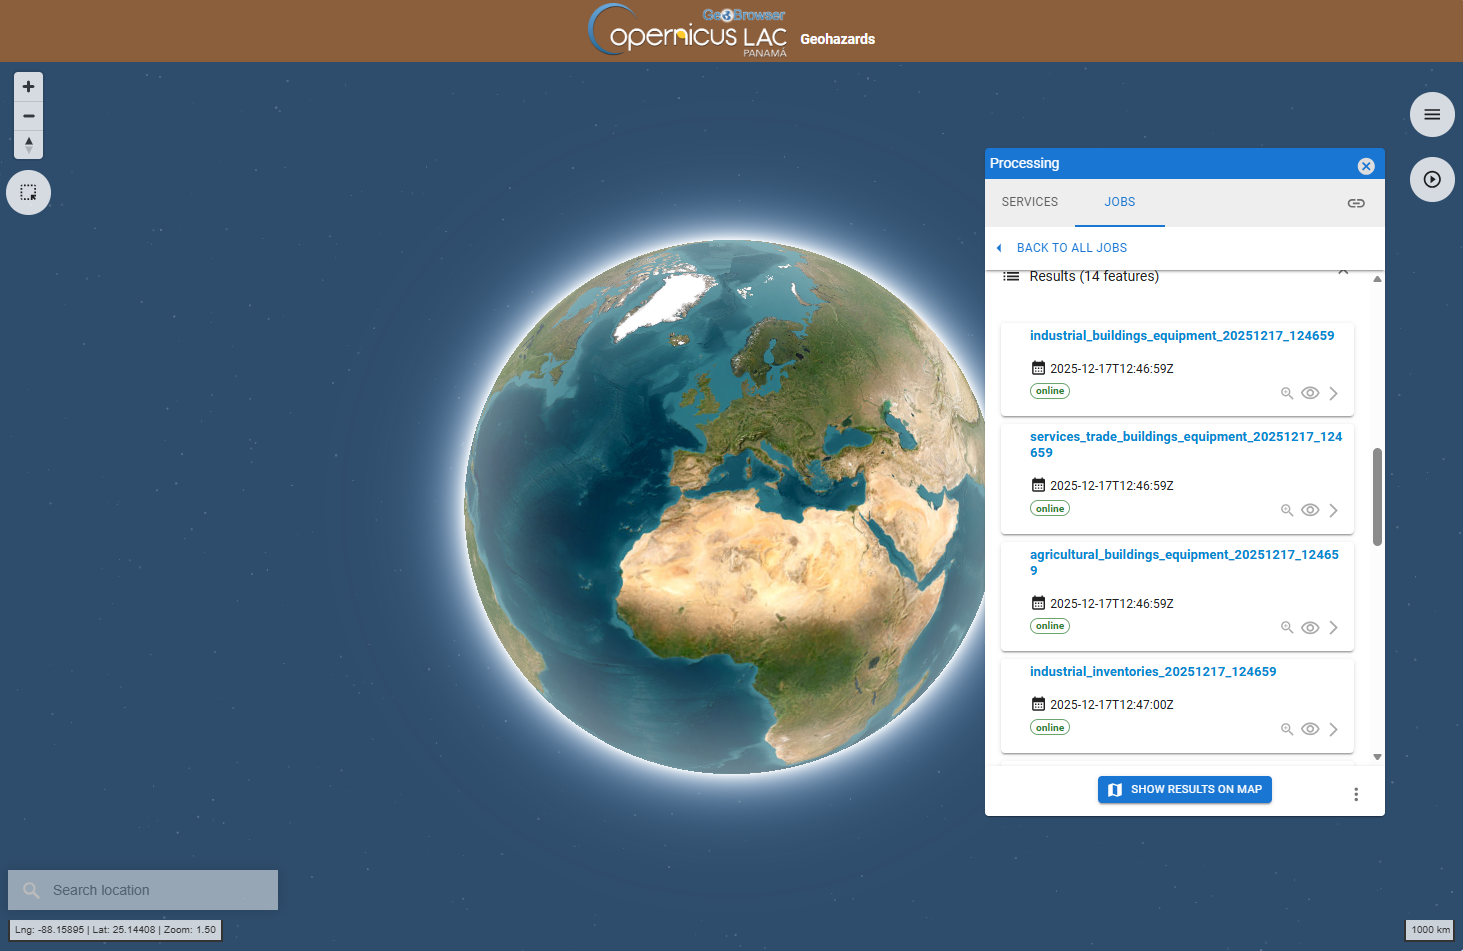
Click on the Results (14 features) button to find the 14 assets generated by the EVM service that can be visualized in the map.
Select the Sum assets 2025-10-29 product by clicking on the title. After this selection the single product will be displayed on the map with related metadata shown under the DETAILS tab in the left panel.
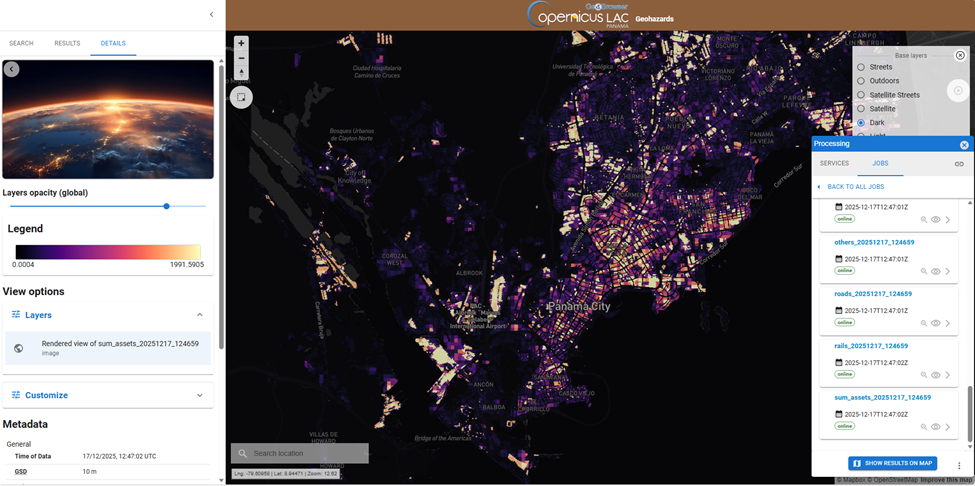
From DETAILS tab in the left panel it is also possible to:
-
set the opacity of the layer,
-
visualize the legend of the product,
-
under view options consult the render applied to the layer and, its histogram (when available), and apply a custom render,
-
download the product.
Consult the Metadata available. You can find for instance more information about how to interpret the result under Description.
Hint
Do you want to see both the result and the underneath satellite imagery baselayer? Try using the Layers opacity (global) bar, and set the opacity as 50% to better see for instance also the labels of the basemap layer.
Note
Aren't you satisfied with the default render of the product available under Layers in the View options? You can customize it by clicking on Customize under View options in the left panel. Please note that when you apply a custom render to the asset the legend will be updated accordingly.
To download the product from the left panel click on the Downloads dropdown button and then on the hyperlink of the single asset.