SAR-based Flood Frequency Mapping service specifications
![]()
Find SAR-FFM service tutorial here.
Service Description
The SAR-based Flood Frequency Mapping (SAR-FFM) on-demand service exploits multitemporal flood extent mapping to generate a flood frequency map that illustrates flood occurrence patterns.
It provides a high resolution flood frequency map at 20m resolution from series of flood records derived from Sentinel-1 imagery with the AUTOmatic Water Areas Detector (AUTOWADE)1,2,[3] algorithm. This service is applied over a user-defined time window to generate a time series of flood extent maps and the flood frequency map, reporting the proportion of time in which a given pixel has been inundated.
The EO data from the Sentinel-1 GRD collections is ingested and calibrated in automated fashion over the entire time period defined by the user, typically three years of data taken from Sentinel-1 (GRD) archive. For each pair of Sentinel-1 calibrated datasets, the service automatically employ CIMA’s AUTOWADE for Sentinel-1 algorithm to produce individual water delineation maps through an automated change detection approach. The complete stack of these flood maps for the selected interval is then analysed to compute flood frequency that is, the proportion of times each pixel was inundated relative to the number of observations.
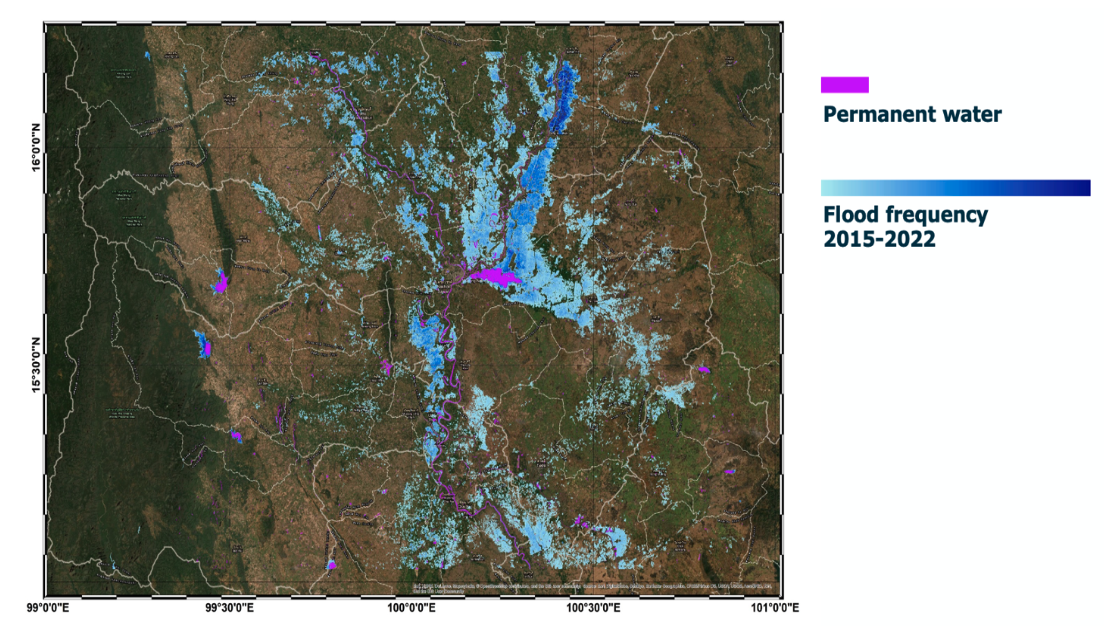
The final output is a flood frequency raster, where each pixel has a value between 0 and 100, indicating as percentage how many times it was flooded out of the total number it was observed (see Figure 1 as example).
Workflow
The schema shown in Figure 2 in this section describes the high-level workflow of the SAR-FFM service.
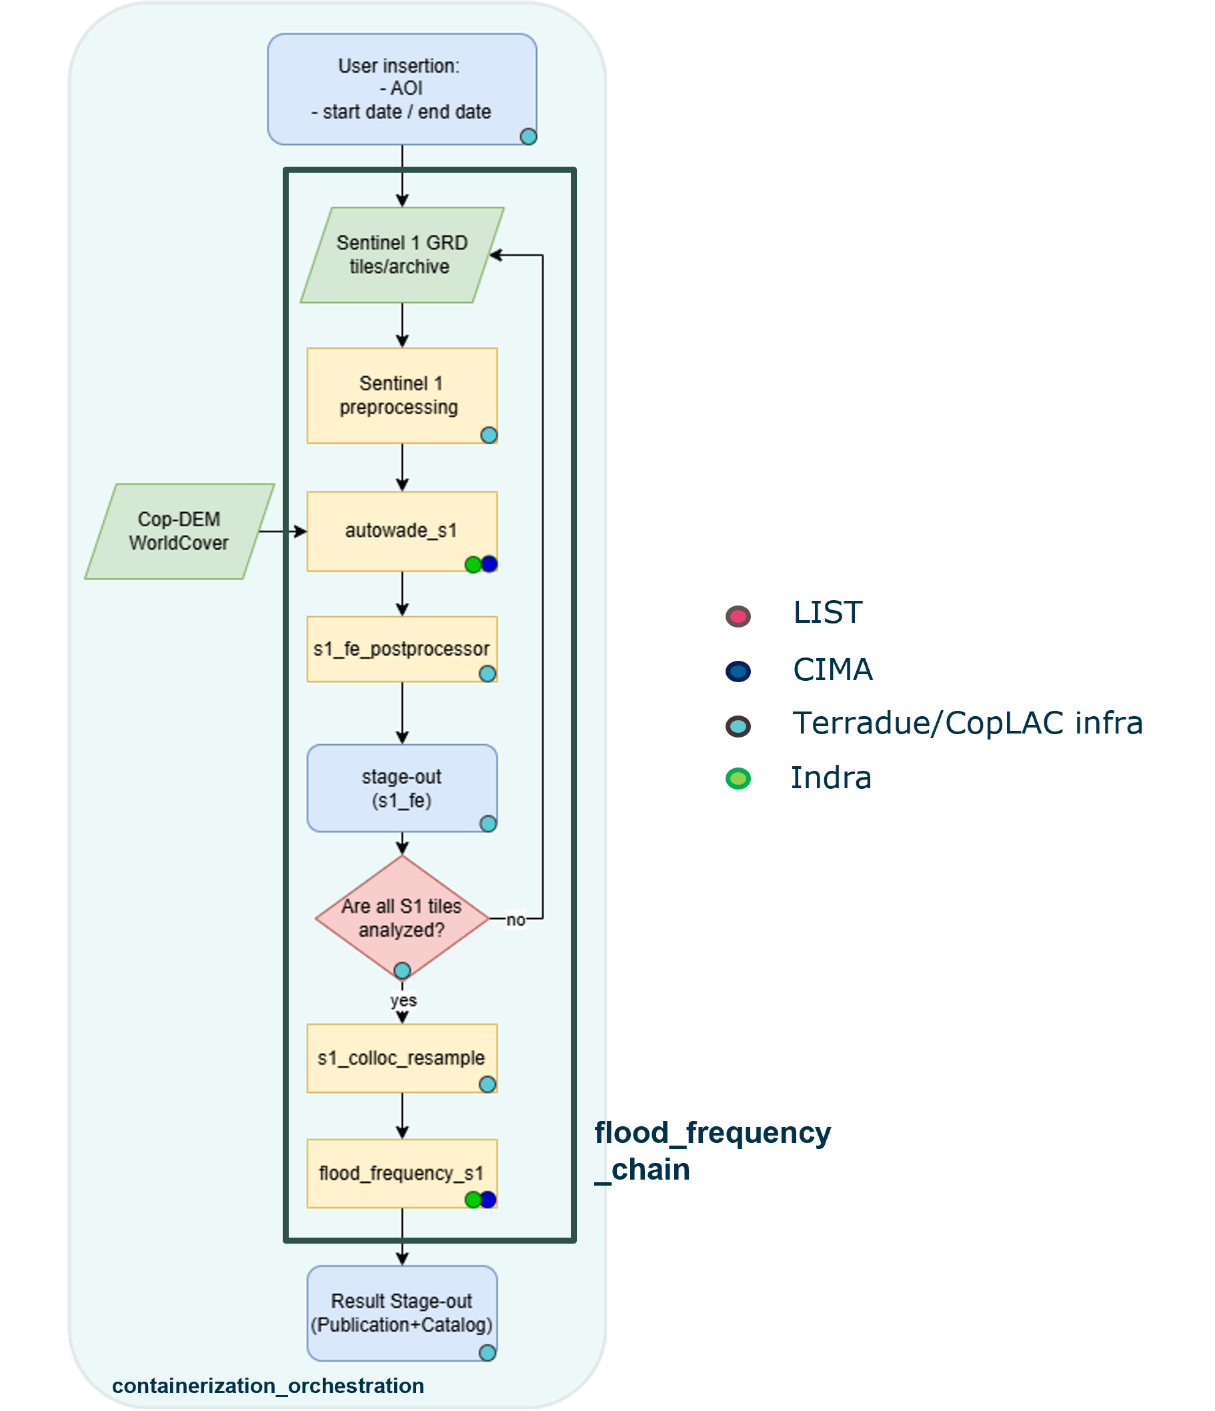
The workflow requires as input the Area of Interest (AOI) and start date and the end date defining the time interval over which the frequency will be computed. After that, the service launches the automatic flood mapping on the catalogue of images available from Sentinel-1 mission in the interval, supported by ancillary data such as the CopDEM4 and the WorldCover by ESA5. The flood maps derived from Sentinel-1 are then ingested in the flood frequency computation tool. The flood frequency maps derived from the Sentinel-1 processing chain constitute the output product.
Below are given details of each step of the chain described in the SAR-FFM servicesworkflow.
Sentinel-1 GRD preprocessing
This module includes a standard preprocessing workflow to obtain Sentinel-1 calibrated, corrected and projected sigma nought intensity images in dBs using as input Sentinel-1 GRD products. The preprocessing module includes the pairing of pre and post images per orbit to be ingested by the autowade_s1 algorithm.
AUTOWADE for S1
The AUTOWADE algorithm, developed by CIMA, is tailored to process Sentinel-1 data (autowade_s1). The methodology aims to produce maps delineating both permanent and floodwater extent using a change detection approach, between pre and post event image acquired in the same orbit geometry. First, certain areas of the pre-processed Sentinel-1 GRD image are excluded from the analysis, including steep regions (based on Cop-DEM slope data) and urban areas (based on WorldCover). Permanent water bodies are identified using a Buffer-from-Edge approach. In this process, an unsupervised clustering algorithm is applied to the co-polarized VV image to segment groups of similar pixels. The class with the lowest median is assumed to represent water pixels.
The derived Continuous Dynamic Water Area (CDWA) is then compared with the reference permanent water layer from WorldCover. The intersection between both datasets undergoes edge detection, followed by a buffering operation to obtain a bimodal distribution of water and non-water pixels. Once this distribution is achieved, an automatic thresholding method is applied.
To refine the classification of permanent water, a region-growing approach is employed to ensure all neighbouring water pixels are included. The same strategy is used to classify floodwater, but in this case, the method is applied to the difference between post-event acquisitions and the most recent pre-event image from the same orbit geometry.
S1 Merge and postprocessing
The step 's1_merge_postpr' processes the output of autowade_s1 to address noise removal, border effects, and other issues that may impact the final result. If the given AOI intersects multiple S1 tiles, the processor mosaics the flood maps from different tiles to generate a single, unified flood map.
S1 Warp and resample
The module 's1_coreg_resample' module applies warping and resampling to the full stack of flood maps derived from Sentinel-1.
Flood Frequency
The 'flood_frequency_s1' processor performs a pixel-based analysis on the stack of S1 derived maps to compute the flood frequency maps. The analysis involves counting the number of times each pixel's corresponding surface is inundated across the single flood maps, thereby quantifying the frequency of inundation for each pixel.
Input
The following inputs are needed to run the SAR-FFM service:
-
A list of Sentinel-1 GRD pairs under the same orbit direction, slice number and relative track acquired within a start and end date and intersecting the AOI (these are automatically selected and calibrated by the service),
-
A list of COP-DEM tiles intersecting the AOI (these are automatically ingested by the service),
-
A list of ESA World Cover 2021 tiles intersecting the AOI (these are automatically ingested by the service).
Parameters
The SAR-FFM service requires a specified number of mandatory parameters. Table 1 describes these parameters. Optional parameters shall not be defined by the user via the GUI but can be defined by the service operator within a configuration file before the triggering of the SAR-FFM service workflow.
| Parameter | Description | Required | Default value |
|---|---|---|---|
| Area of Interest | Area of interest to be covered by the service in WKT (e.g. extent of a district in Colombia) | YES | |
| Start Date and End Date | Start date of the interval to be considered for the analysis, in the format YYYY-MM-DD. | YES | |
| End Date | End date of the interval to be considered for the analysis, in the format YYYY-MM-DD. | YES |
Output
The SAR-FFM service generates an Empirical Frequency Map. Product specifications are:
-
Definition: flood frequency map, with each pixel showing how many times it was flooded out of the total number of times it was observed. Valid range [0-100]
-
Data type and format: uint8, COG
-
Spatial resolution: 20m.
-
Frequency of observations: 5-12 days.
-
Spatial coverage: depending on the availability of resources, the area of interest will be selected with the final user.
-
Constraints: availability of good quality Sentinel-1 acquisitions; zonal or hydrological limitation (e.g. flash floods)
Credits
The AUTOWADE processor employed in this service is developed by CIMA Research Foundation.
References
-
Pulvirenti L., Squicciarino G., Cenci L., Ferraris L., Virelli M., Candela L., Puca S. Continuous flood monitoring using on-demand SAR data acquired with different geometries: Methodology and test on COSMO-SkyMed images, ISPRS Journal of Photogrammetry and Remote Sensing, Volume 225 (2025). DOI: 10.1016/j.isprsjprs.2025.04.036. ↩
-
Pulvirenti, L., Squicciarino, G., Fiori, E., Ferraris, L., & Puca, S. (2021). “A Tool for Pre-Operational Daily Mapping of Floods and Permanent Water Using Sentinel-1 Data”. Remote Sensing, 13(7), 1342. DOI: 10.3390/rs13071342. ↩
-
Pulvirenti, L., Squicciarino, G., & Fiori, E. (2020). A Method to Automatically Detect Changes in Multitemporal Spectral Indices: Application to Natural Disaster Damage Assessment. Remote Sensing, 12(17), 2681. DOI: 10.3390/rs12172681. ↩
-
Copernicus DEM – Global Digital Elevation Model - COP-DEM_GLO-30. DOI: 10.5270/ESA-c5d3d65. ↩
-
WorldCover 2021 v200 - Zanaga, D., Van De Kerchove, R., Daems, D., De Keersmaecker, W., Brockmann, C., Kirches, G., Wevers, J., Cartus, O., Santoro, M., Fritz, S., Lesiv, M., Herold, M., Tsendbazar, N.E., Xu, P., Ramoino, F., Arino, O., 2022. ESA WorldCover 10 m 2021 v200. DOI: 10.5281/zenodo.7254221. ↩