Flood Depth Mapping service specifications
![]()
Find FLDM service tutorial here.
Service Description
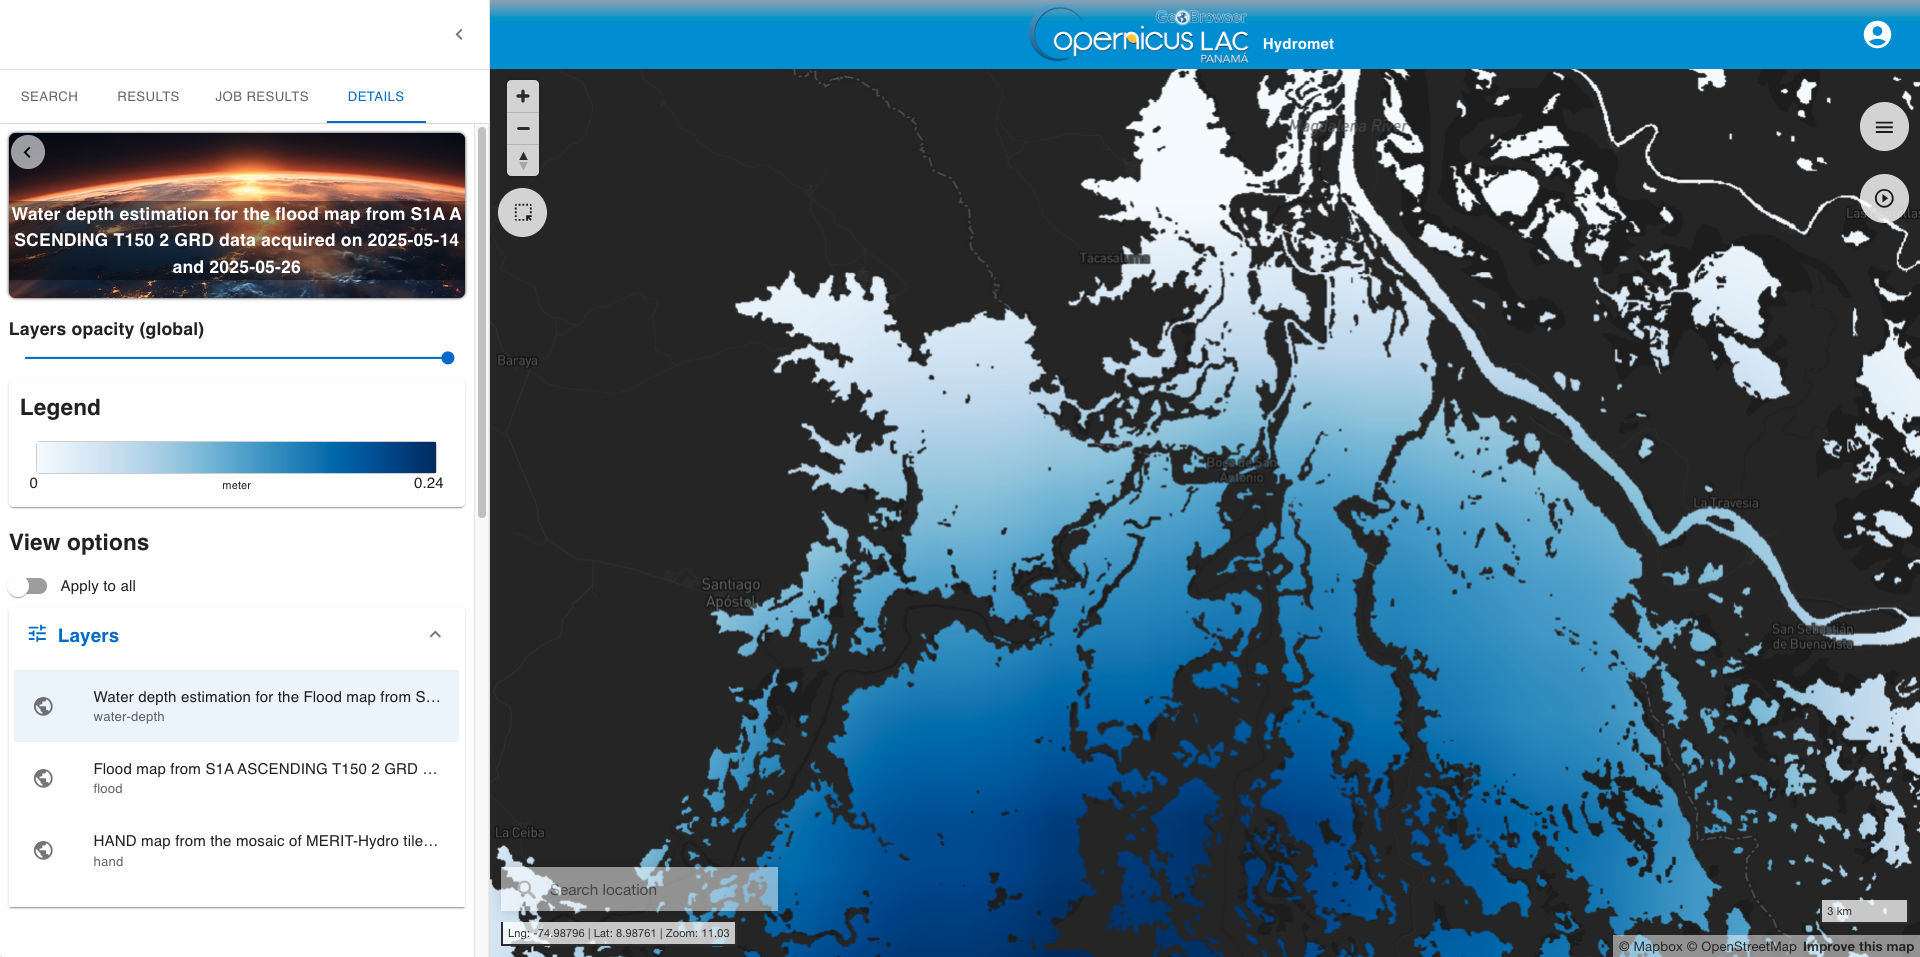
The Flood Depth Mapping (FLDM) on-demand service enables users to create comprehensive flood depth maps for designated areas and timeframes. The system autonomously extracts water depth in urban and rural regions. It accomplishes this by utilizing a satellite detected flood extent map obtained with the SAR-FEM service and a the Height Above Nearest Drainage (HAND)1 from the MERIT Hydro dataset3. In terms of geophysical products, the FLDM service generates on demand water depth maps in metres.
The algorithm for estimating water depth across a floodplain is based on the method proposed by Matgen et al. (2016)2. This approach combines EO-derived flood extent data with topography-derived HAND maps. It assumes uniform flow, meaning the water depth relative to the drainage network remains consistent across a given floodplain section. The HAND data, which normalizes topography with respect to the drainage network, is iteratively thresholded to generate a binary mask that best aligns with the flood extent map in the study area.
Once the optimal threshold from the HAND-derived floodwater extent is determined, water depth can be estimated for each point classified as floodwater. The whole AOI is split into smaller tiles of the same size so that the local effects of flood size and terrain can be seen in each one. Then the optimal threshold is used to estimate the water depth for all pixels in each smaller tile. In order to remove border effects of close tiles, a smoothing low-pass filter is also applied.
Workflow
The schema shown in Figure 2 describes the high-level workflow of the FLDM service.
Below are given details of each step of the chain described in the FLDM workflow.
Data gathering and co-location
The service is expecting in input a flood extent map, which can be representative of an urban or sparsely vegetated area based on a single event or the seasonal or annual maximum extent. The service gathers the input flood extent map from a catalog reference to a job result derived by the user with the on-demand SAR-FEM service. After the gathering of the SAR-FEM result, the HAND tiles intersecting the AOI specified by the user are first mosaicked and then warped and resampled to perfectly match the grid and projection of the input flood map, ensuring one-to-one pixel alignment. In the co-location of HAND tiles with respect to the input flood map, the two assets are cropped to the AOI.
Water depth estimation
In this step the HAND raster is thresholded in order to generate a binary mask that optimally fits, over the entire region of study, the flood extent map obtained from the SAR-FEM service. In particular, the processor performs an optimized search for the best HAND threshold to predict flooded areas based on the extent of the input water map (flood and permanent water). The optimal HAND threshold value corresponds to the height of the water line above the nearest drainage, termed \(HAND_{WATER}\) , and is considered constant for a given subreach. In this analysis the processor divides the input HAND into smaller patches and identifies the optimal threshold for each patch to accurately represent the flooding conditions. The primary goal is to find the HAND value that best separates flooded and non-flooded areas within each patch, which is then used to generate a water depth map. The processor analyzes all patches in parallel. For each patch, it searches for the elevation threshold that results in the highest classification accuracy when comparing the predicted flood extent (pixels below the threshold) against the actual flood map.
Once this \(HAND_{WATER}\) value has been optimized, a water depth map can be generated, as follows:
where:
-
\(h_{x,y}\) is the water height at the location with coordinates x, y,
-
\(HAND_{x,y}\) is the value of the HAND raster at the same location.
Input
The FLDM service requires in input the following datasets:
-
Historical flood extent map: flood delineation map of the event to be analyzed,
-
Height Above Nearest Drainage (HAND).
Warning
Input flood map shall be generated with the on-demand SAR-FEM service.
Note
The HAND tiles covering the AOI are automatically retrieved by the service.
Parameters
The FLDM service requires a specified number of mandatory parameters. Table 1 describes these parameters.
| Parameter/Input layer | Description | Required | Default value |
|---|---|---|---|
| SAR-FEM input | Catalog reference to a SAR-FEM flood map | YES | |
| Area of Interest | Area of interest defined as a WKT geometry | YES | |
| Threshold step | The increment step size used for the threshold optimization search (decimal). | YES | 0.1 |
| Patch size | The size of each square patch for analysis, in pixels (integer). | YES | 512 |
| Overlap size | The overlap ratio between adjacent patches (from 0.1 to 1.0) to minimize edge effects. |
YES | 0.5 |
| Smoothing window size | The window size for smoothing transitions between patches (integer). Set to 0 to disable. |
YES | 256 |
SAR-FEM input
In the first parameter (mandatory) the user shall provide the catalog reference to a SAR-FEM flood map feature.
Area of Interest
In this second mandatory parameter the user must define an area of interest (expressed in WKT) that is contained within the extent of the input SAR-FEM flood map.
Threshold step
In this third mandatory parameter the user must insert the increment step size (as decimal number) that is used for the HAND threshold optimization search.
Patch and overlap sizes
The fourth and fifth mandatory parameters are dedicated respectively to the patch size and the overlap size. In the patch division, the aligned HAND is divided into smaller, overlapping patches according to both these parameters.
Smoothing window size
In the sixth mandatory parameter the user shall define the window size for smoothing transitions between patches (integer). In the result aggregation, the optimal thresholds from all patches are combined into a single Water Surface Elevation Map (WSEM). If a smoothing window size is specified, a smoothing filter is applied to this map to blend the results from adjacent patches. Set to 0 to disable.
Output
The FLDM service provides in output the following products.
-
input SAR-FEM flood map asset (
flood), cropped over the user-defined AOI, given as single-band raster in COG format, -
input HAND asset (
hand), co-located against to the input flood map and cropped over the user-defined AOI, given as single-band raster in COG format, -
output water depth asset (
water-depth), given as single-band raster in COG format,
FLDM Product Specifications can be found in the below tables.
| Attribute | Value / description |
|---|---|
| Description | Input SAR-FEM flood map cropped over the AOI. Classes: 0 = No-flood, 1 = Masked-pixels, 2 = Permanent-water, 3 = Flood-water |
| Short Name | flood |
| Geospatial Data Type | Raster |
| Data Type | UnSigned 8-bit Integer |
| Band | 1 |
| Format | COG |
| Projection | EPSG:4326 - WGS84 |
| Valid Range | [0 - 3] |
| No Data Value | 255 |
| Attribute | Value / description |
|---|---|
| Description | Mosaic of MERIT Hydro HAND tiles, co-located against to the input flood map, and cropped over the user-defined AOI |
| Short Name | hand |
| Geospatial Data Type | Raster |
| Data Type | Float32 |
| Band | 1 |
| Format | COG |
| Projection | EPSG:4326 - WGS84 |
| No Data Value | nan |
| Attribute | Value / description |
|---|---|
| Description | Output water depth raster in meters computed over the user-defined AOI |
| Short Name | water-depth |
| Geospatial Data Type | Raster |
| Data Type | Float32 |
| Band | 1 |
| Format | COG |
| Projection | EPSG:4326 - WGS84 |
| No Data Value | nan |
Service Provider
The service is developed by LIST.
References
-
Nobre, Antonio & Cuartas, Luz & Hodnett, M & Rennó, Camilo & Medeiros, Grasiela & Silveira, Andre & Waterloo, M.J. & Saleska, Scott. (2011). Height Above the Nearest Drainage - a hydrologically relevant new terrain model. Journal of Hydrology. 404. 13-29. DOI:[10.1016/j.jhydrol.2011.03.051] https://doi.org/10.1016/j.jhydrol.2011.03.051{:target="_blank"}. ↩
-
P. Matgen, L. Giustarini, M. Chini, R. Hostache, M. Wood and S. Schlaffer, "Creating a water depth map from SAR flood extent and topography data," 2016 IEEE International Geoscience and Remote Sensing Symposium (IGARSS), Beijing, China, 2016, pp. 7635-7638. DOI: 10.1109/IGARSS.2016.7730991. ↩
-
Yamazaki, D., Ikeshima, D., Sosa, J., Bates, P. D., Allen, G. H., & Pavelsky, T. M. (2019). MERIT Hydro: a high-resolution global hydrography map based on latest topography dataset. Water Resources Research, 55, 5053– 5073. DOI: 10.1029/2019WR024873. ↩