ESVM service tutorial - local level mode
![]()
Find ESVM service description and specifications here.
Select the processing service
The ESVM service is exposed in all Workspaces of the platform. For the purposes of this tutorial, we will use the service exposed in the Geohazards Workspace.
After the opening of the Geohazards workspace of the CopernicusLAC Platform open the Processing Services panel by clicking on the button located on the top right of the map.
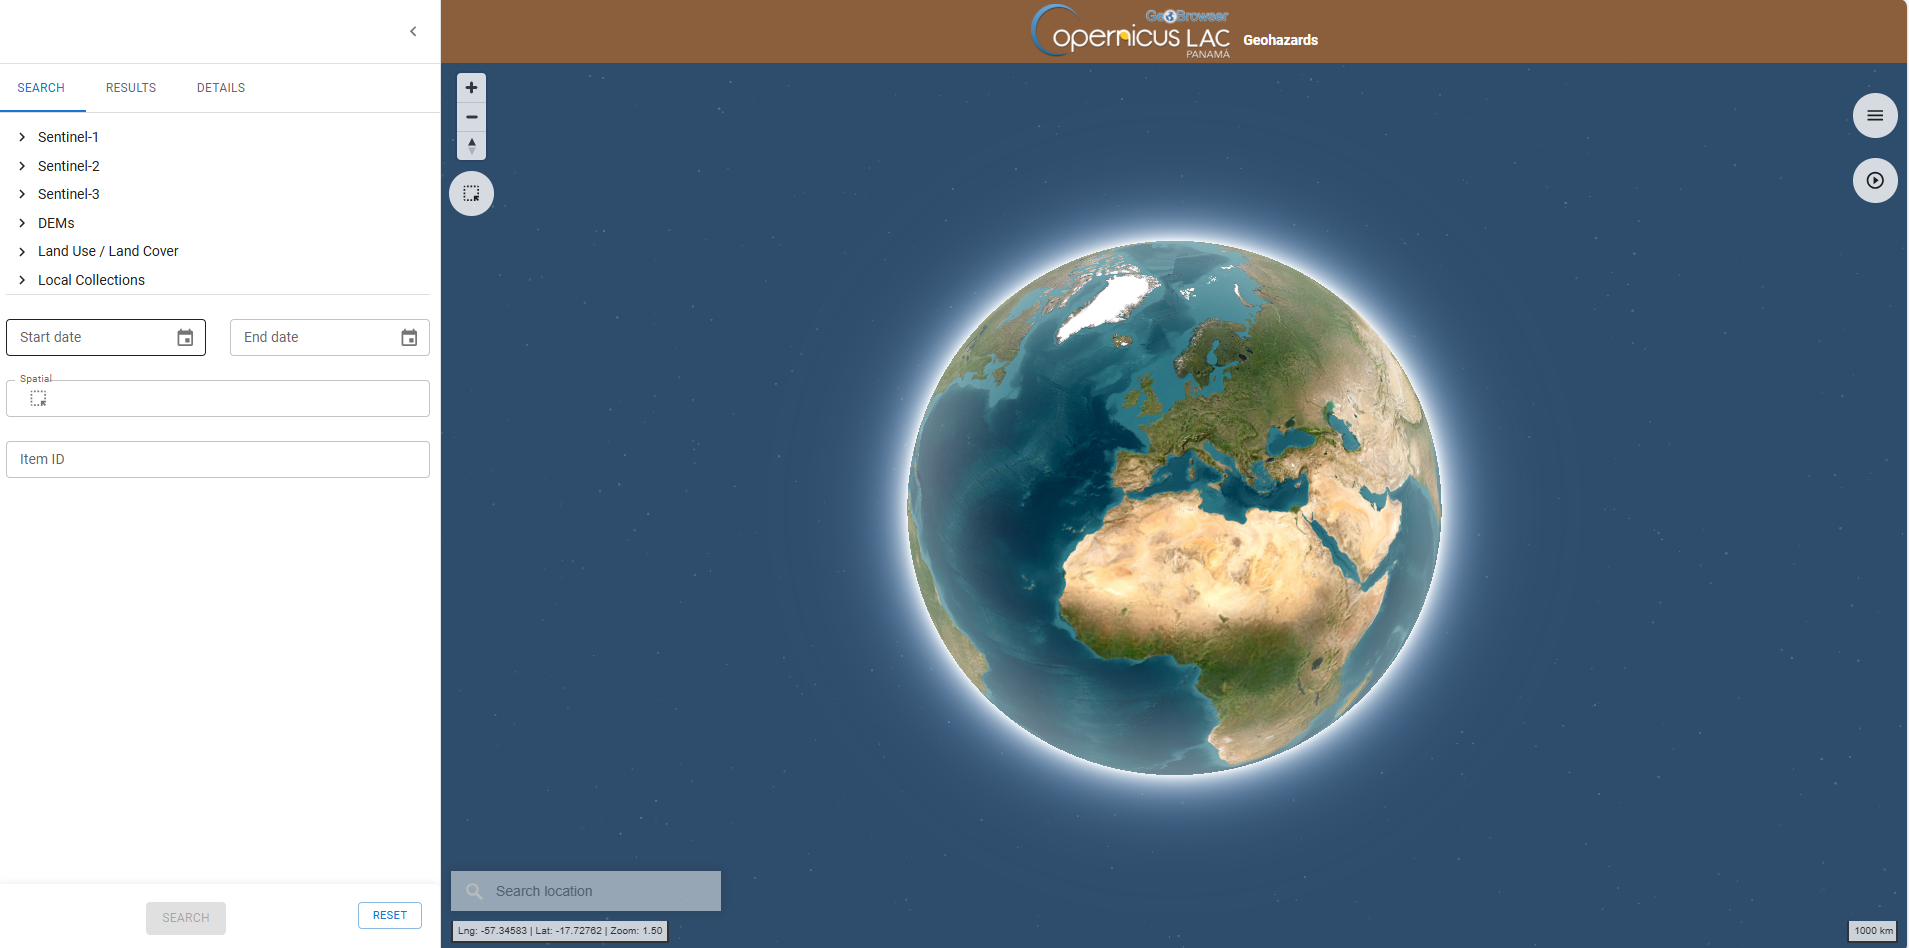
The Processing panel will be displayed with the list of on-demand services available for this workspace.

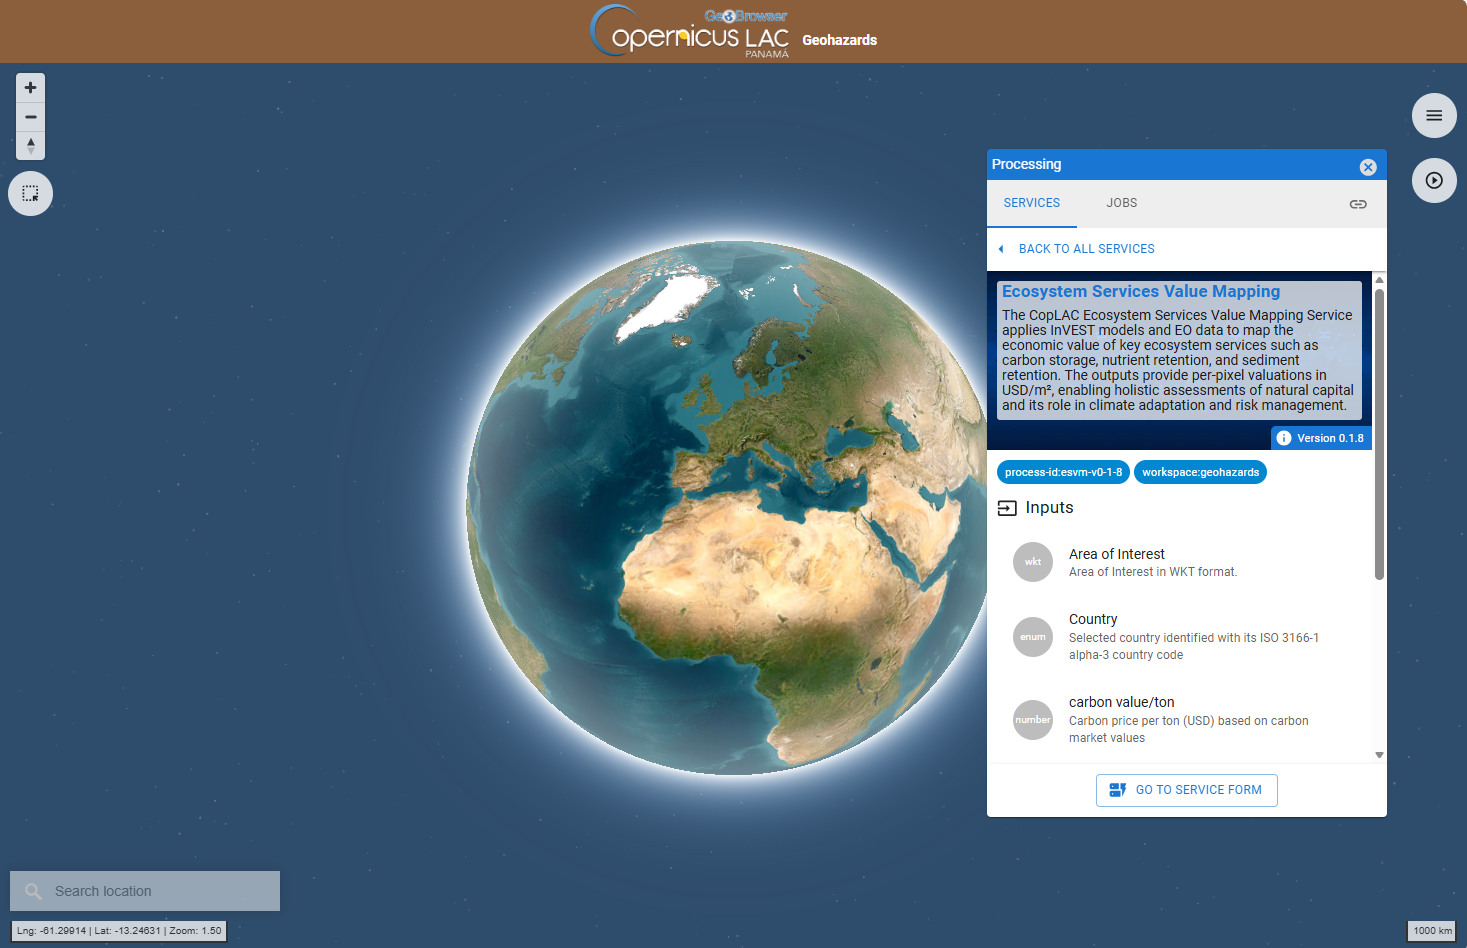
Find the Ecosystem Services Value Mapping (ESVM) service from the list and click on the button next to it.

An opening tab provides a quick description of the service. In the upper part of the tab are shown:
-
service full name,
-
service caption,
-
hyperlink to the online documentation
-
version of the service.
Below that are listed all mandatory and optional parameters that the user must define when submitting the on-demand processing. Each parameter is described with:
-
a grey circle on the left indicating the format of input value required for the parameter. As an example if the parameter is a string (e.g. catalog reference) or a number (e.g. a threshold),
-
the identifier of the parameter,
-
a brief description of the parameter.
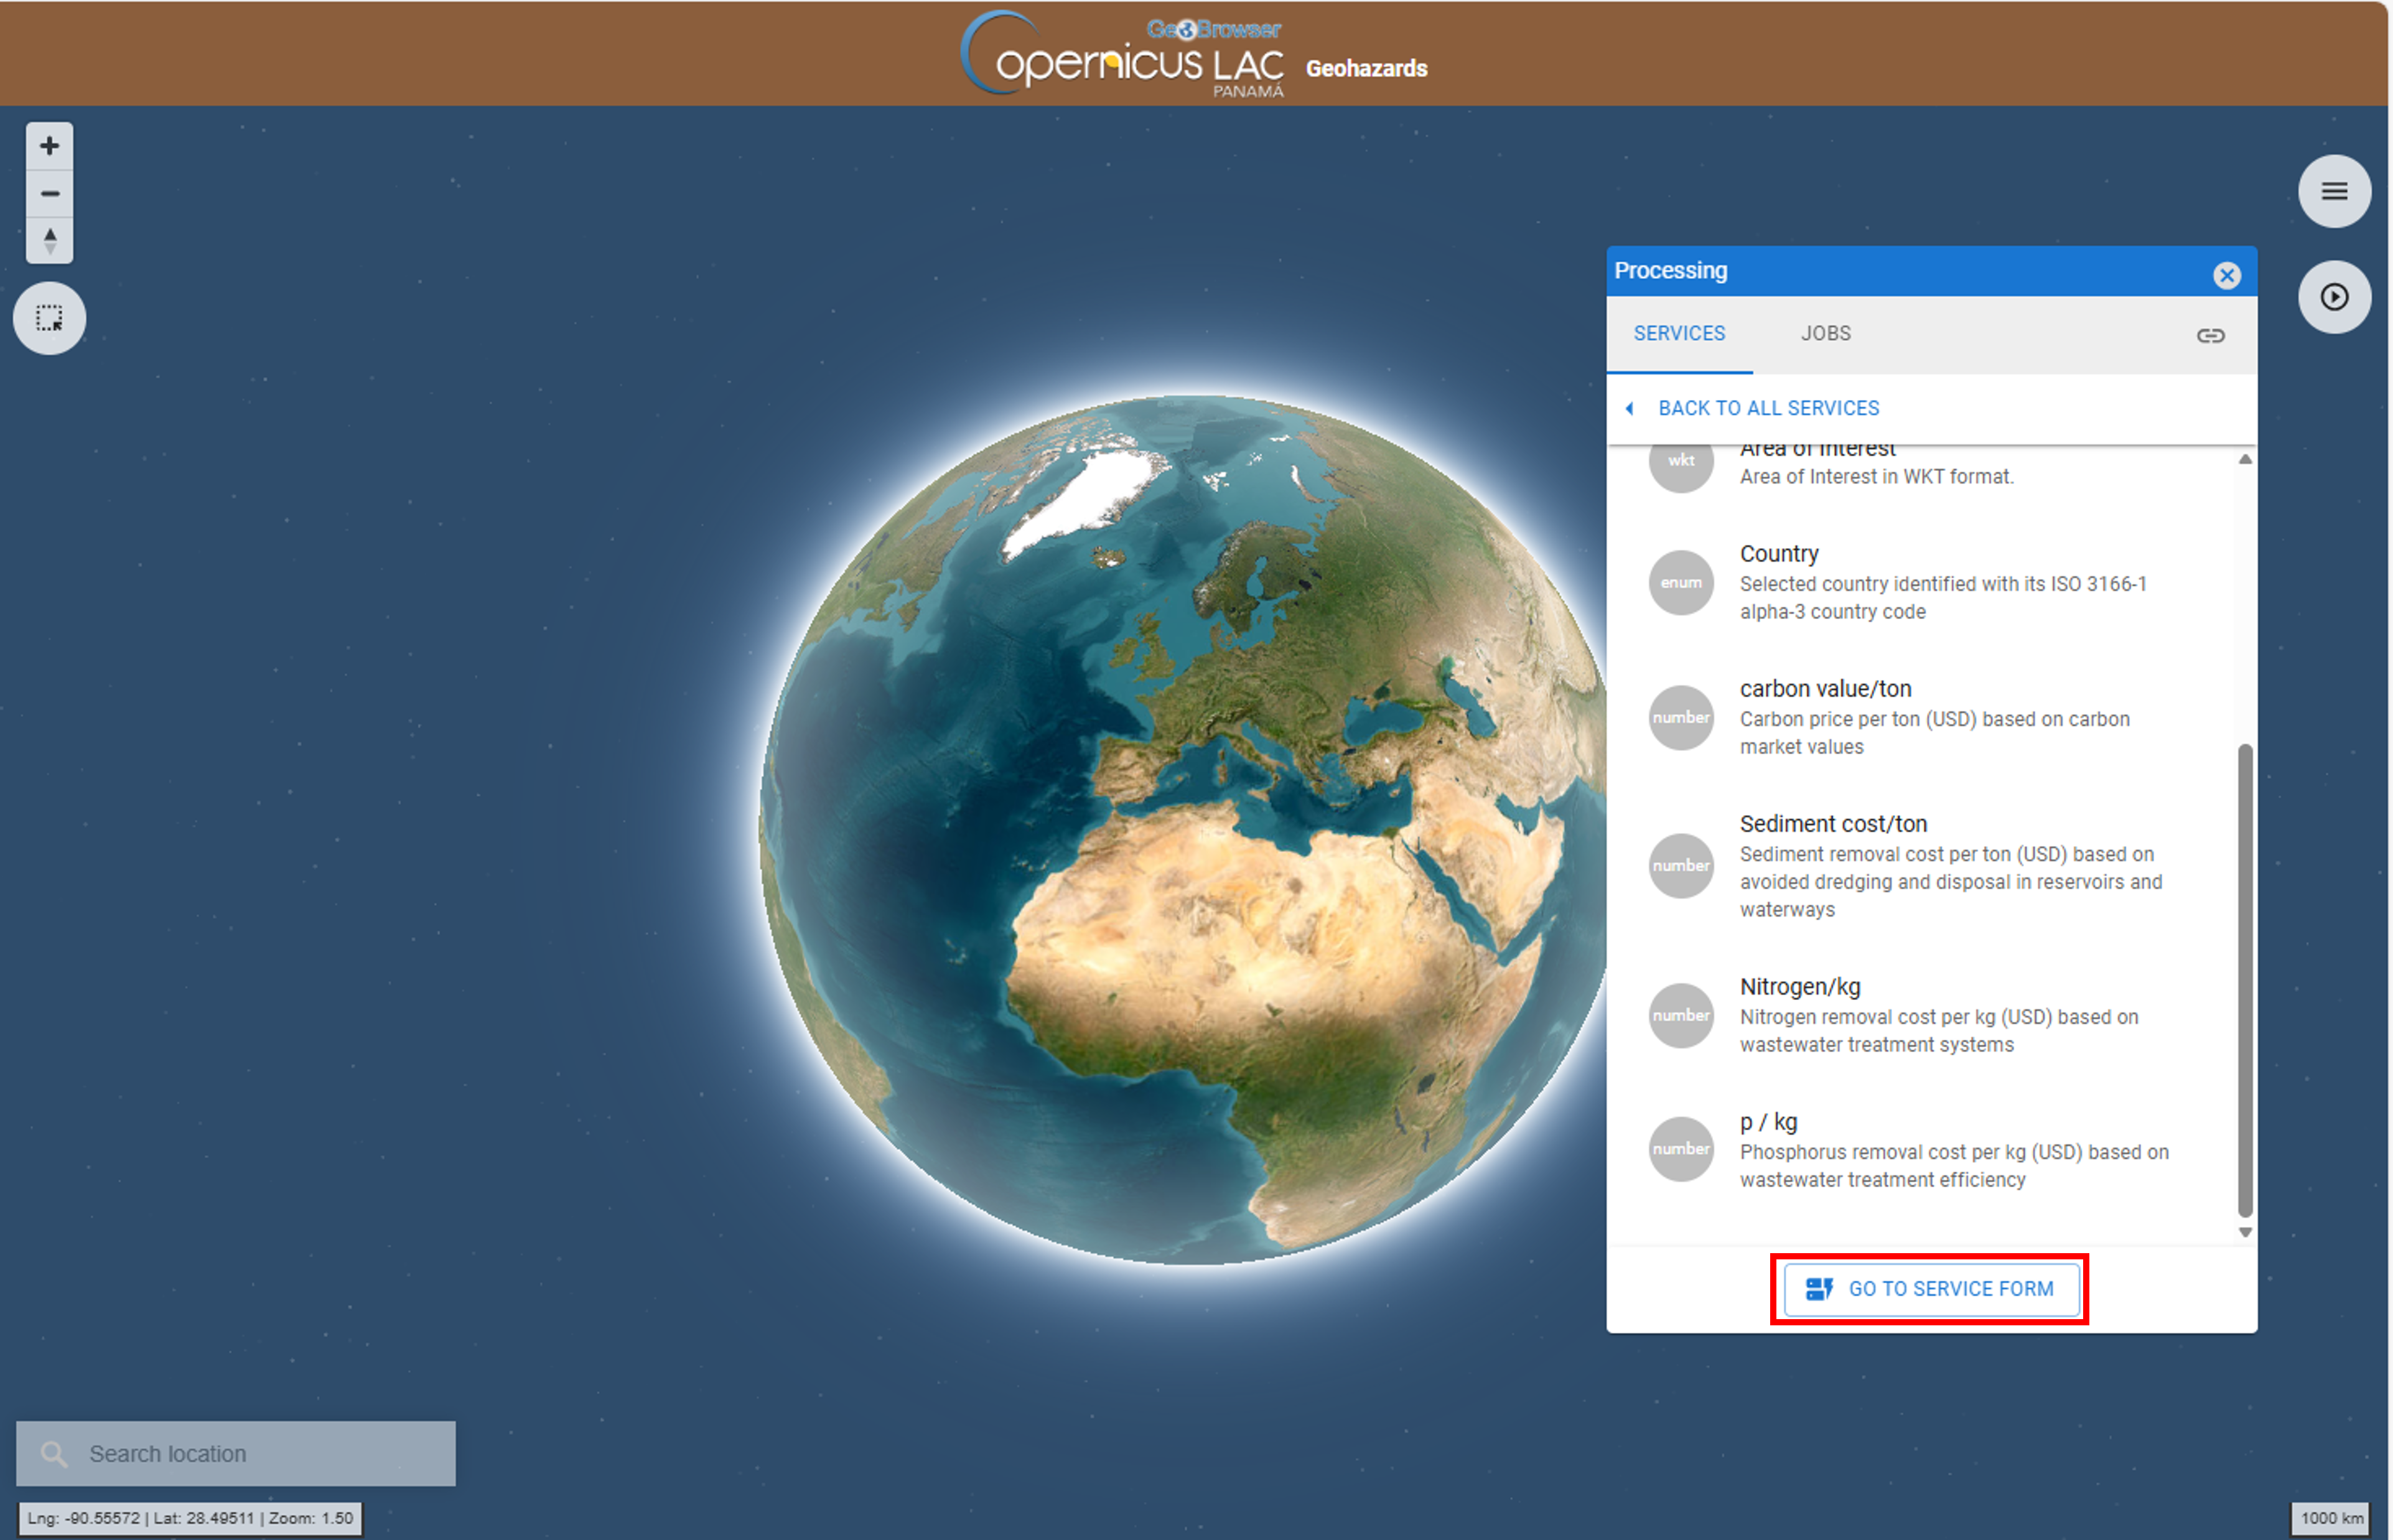
At the bottom of the tab is located the GO TO SERVICE FORM button. Click on it to move to the next tab where the user can fill-in all service parameters and submit the on-demand job.
Hint
To go back to the service panel click on the BACK TO ALL SERVICES button.
Fill the parameters
To start the Ecosystem Services Value Mapping service, you need to define input parameters. Access the ESVM service form and then fill-in the parameters as described in the following sections.
Hint
In case you can't find anymore the ESVM service form:
-
open the Processing panel by clicking on the button on the top right of the map,
-
find the ESVM service from the list of services,
-
click on the button next to it,
-
and then click on the GO TO SERVICE FORM button.
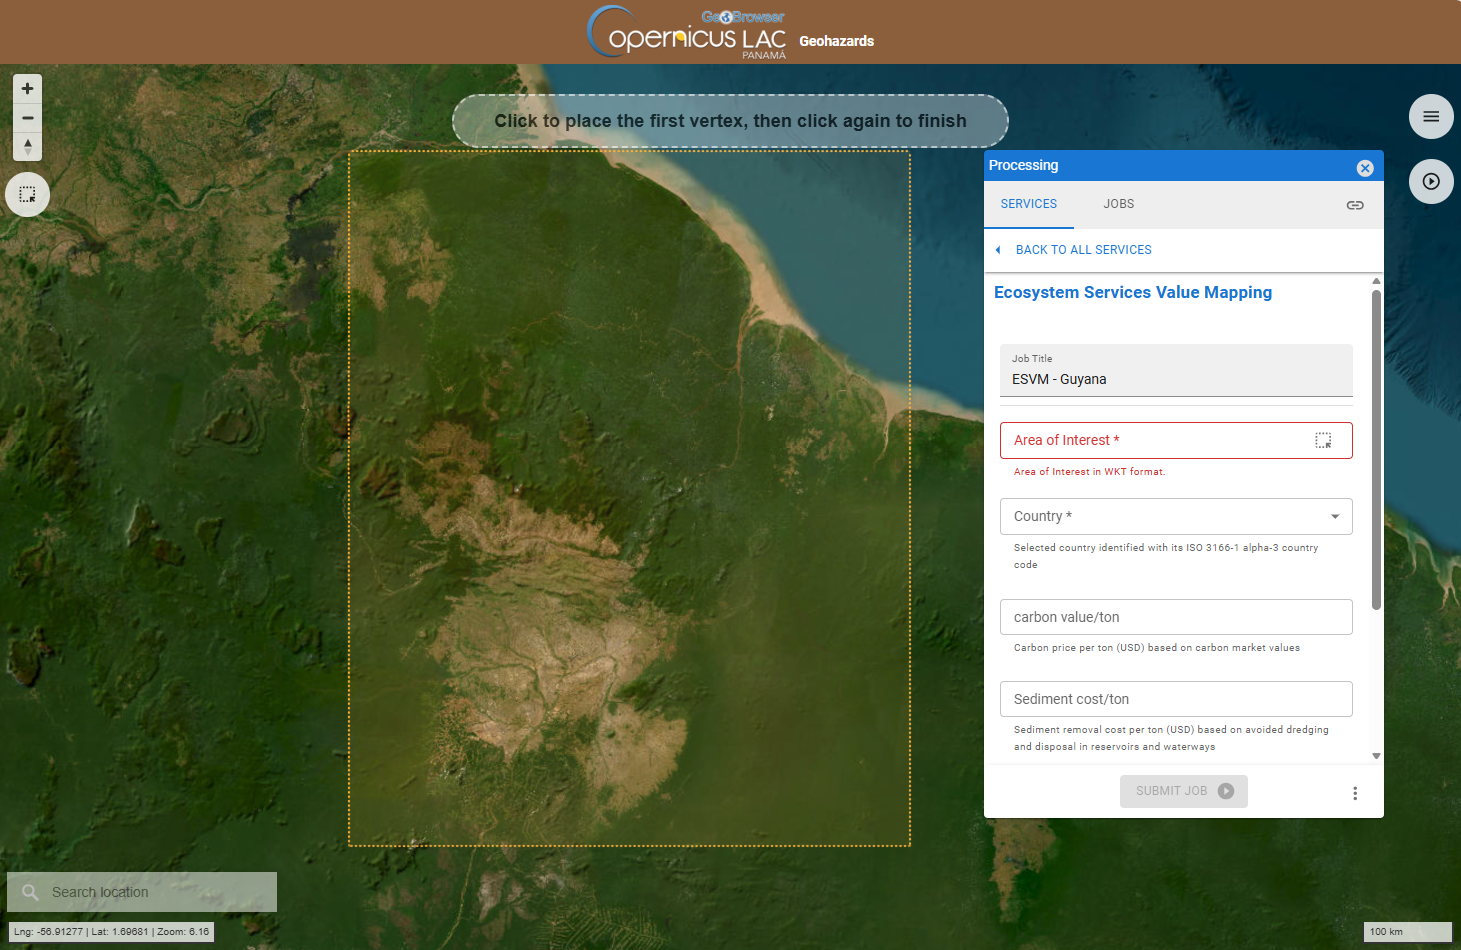
Job Title
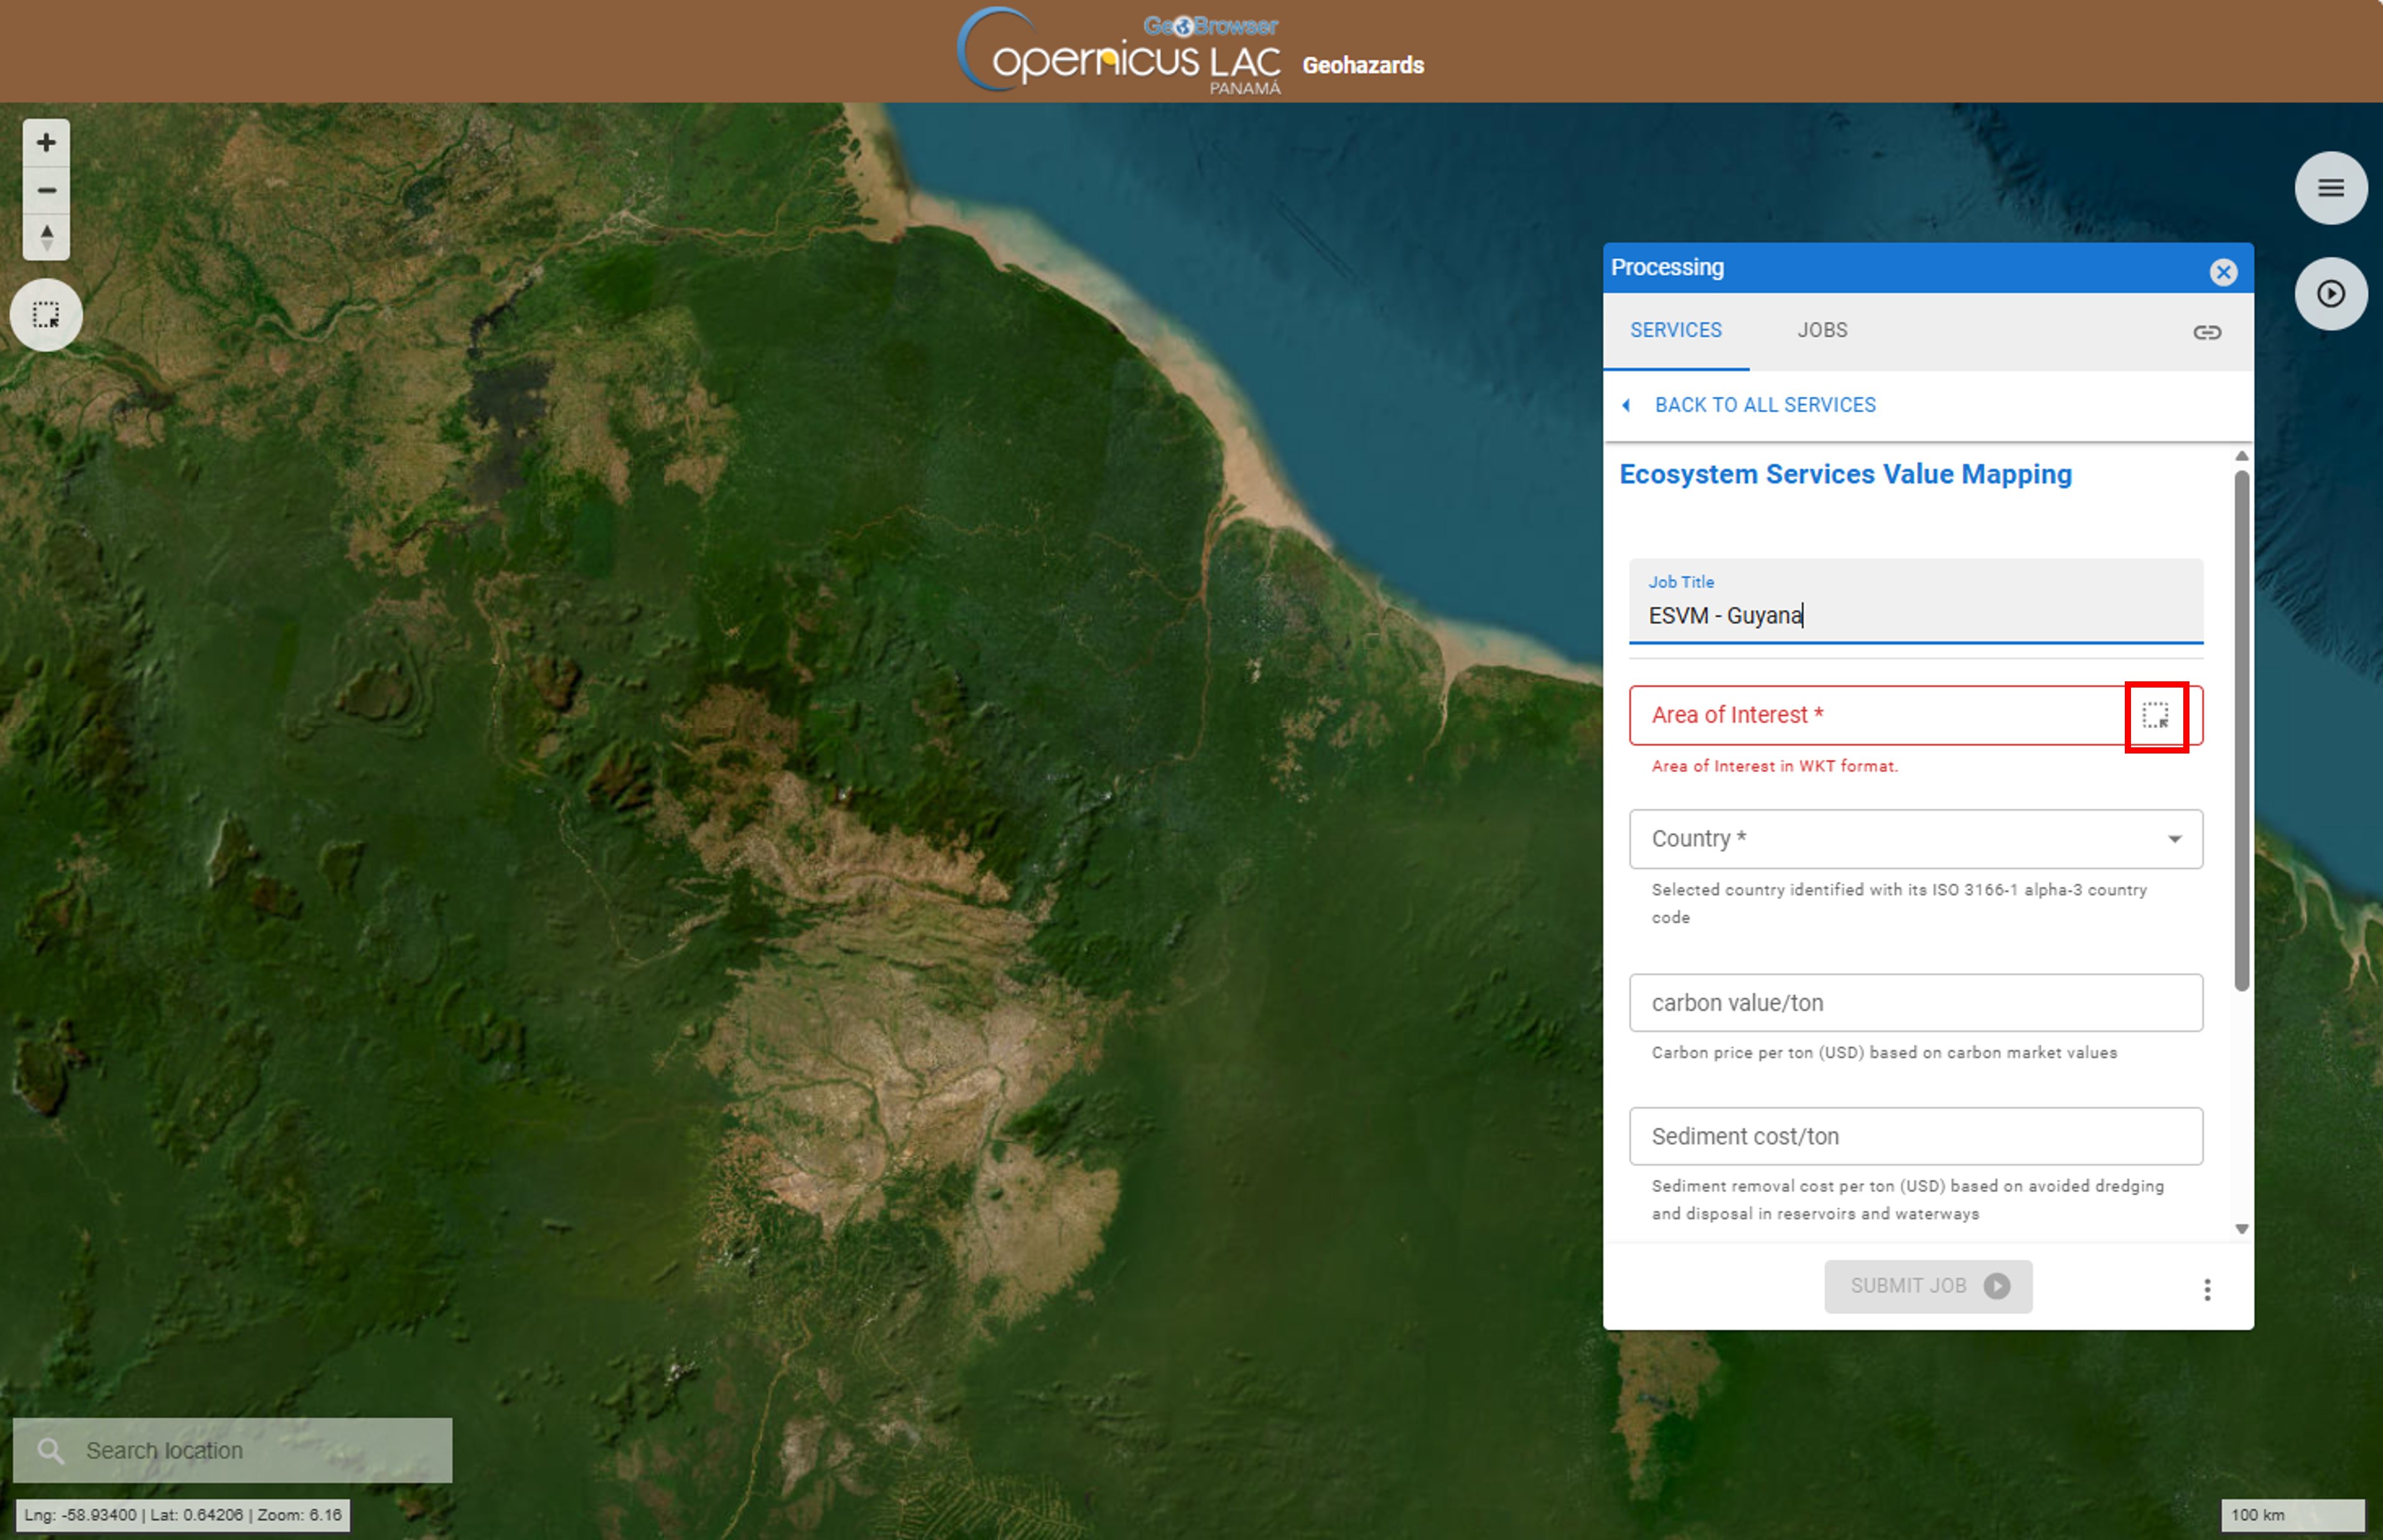
First of all, you can assign a name to the on-demand job you are launching. A predefined title is generated by the platform. Modify this title and assign the title you prefer. For instance, insert as Job title:
ESVM - Guyana
Note
If you don’t specify a name, the system automatically assigns one using the service name Ecosystem Services Value Mapping and the date and time of job creation.
Area of interest
This mandatory parameter allows you to specify the geographic area where you want to estimate the ecosystem services' values, and thus will be the area where the valuation maps will be produced by the service. The AOI must be provided as a WKT string representing the geometry of the area (polygon).
To define the AOI through the platform:
- Navigate the map to your AOI (e.g. Guyana).
Hint
Navigation controls are located on the top left of the map. From these buttons the user can:
-
Zoom in (+): left click on the button
-
Zoom out (-): left click on the button
-
Change the viewing angle by setting inclination and orientation: left click and hold the compass button while you drag left and right or up and down.
-
Reset bearing to the north: left click on the compass button
In the 3D view the user can tilt the map in any direction. The 3D tilt control is useful to view hills and mountains.
Hint
To see labels change to another baselayer as an example the Streets one.
Hint
For a quick search of a place of interest you can type the name of the location using the Search Location tool available in the lower left corner of the map.
After the search the map will be automatically zoomed to a BBOX covering the location of interest.
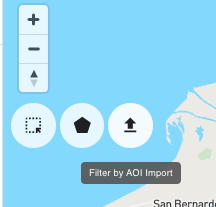
- On the service form, use the drawing tool “Filter by bbox” to draw a polygon describing your AOI.
Hint
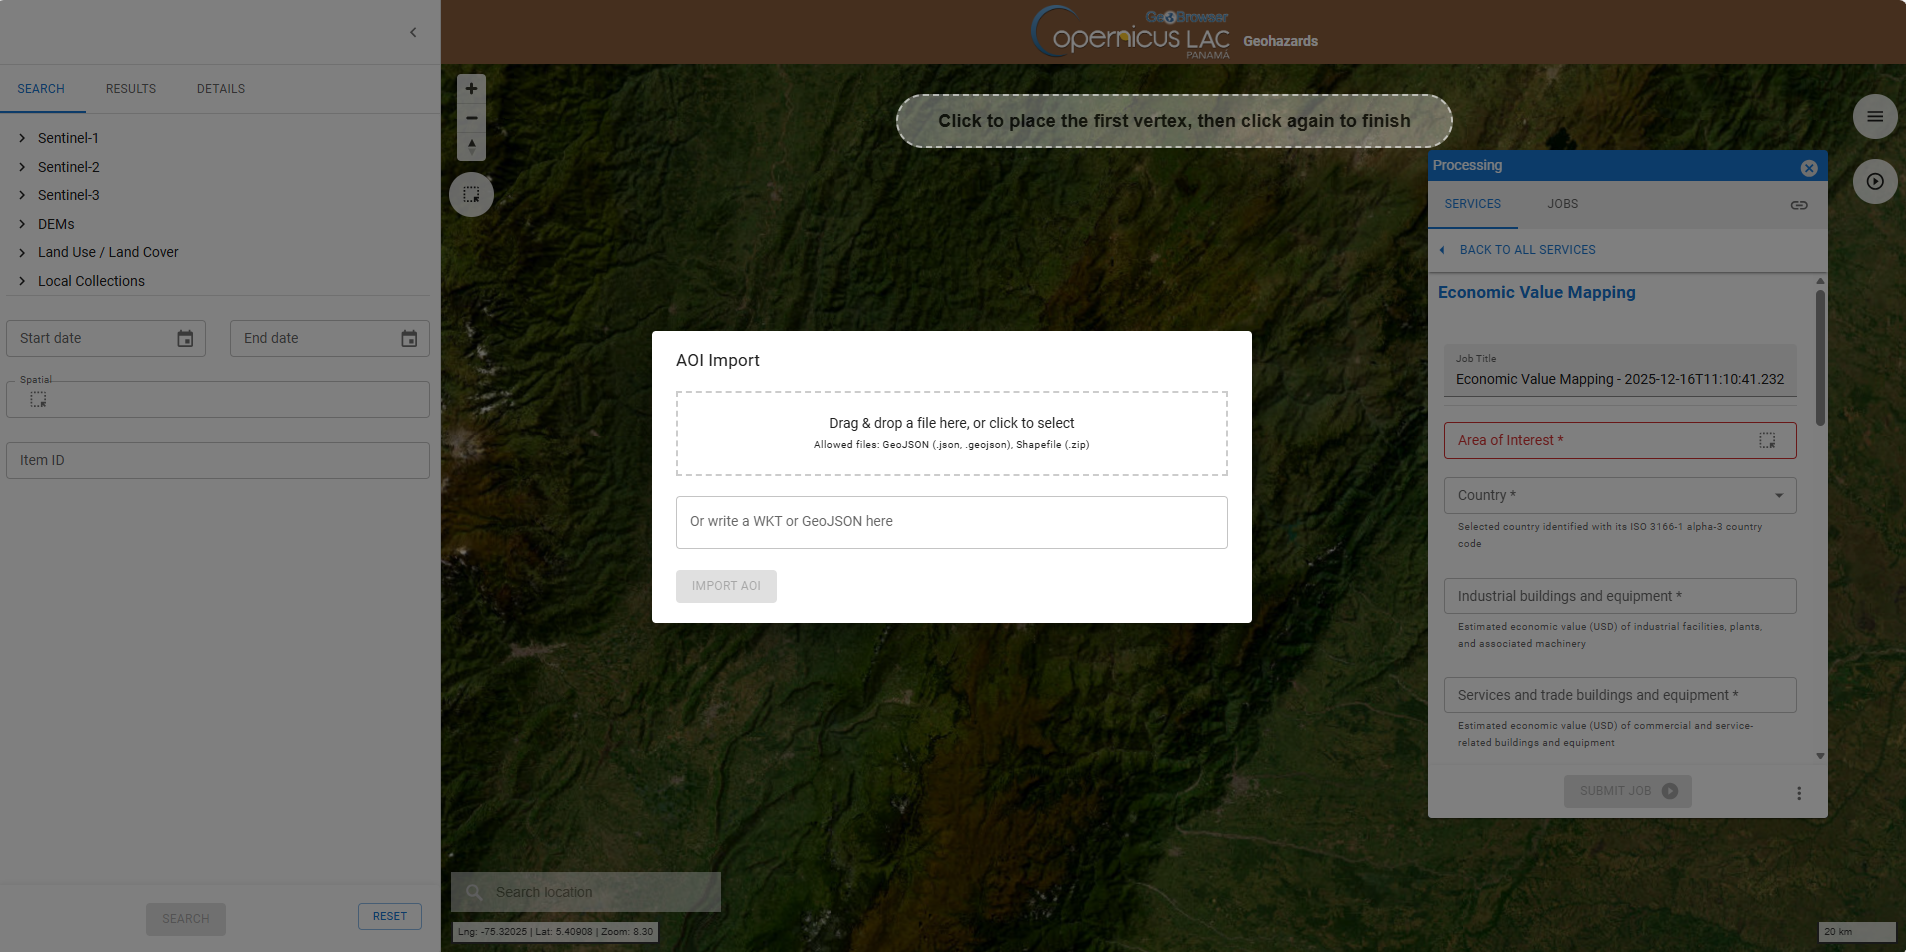
Do you already have a geometry as WKT string or a GeoJSON file and you want to employ it as AOI in your job? There is the option to import your AOI by clicking on Filter by AOI import button located in the upper left corner of the map under the navigation toolbar.
After that paste your WKT value in the dedicated field and click on IMPORT AOI button
-
Once you finish drawing a polygon, a popup box will appear providing the options to SEARCH BY AOI or REMOVE AOI. Click on SEARCH BY AOI to employ this polygon in the search.
-
When you use the "Filter by bbox" tool inside the service form, simply click to place the upper left vertex, and click again on the lower right vertex to finish.
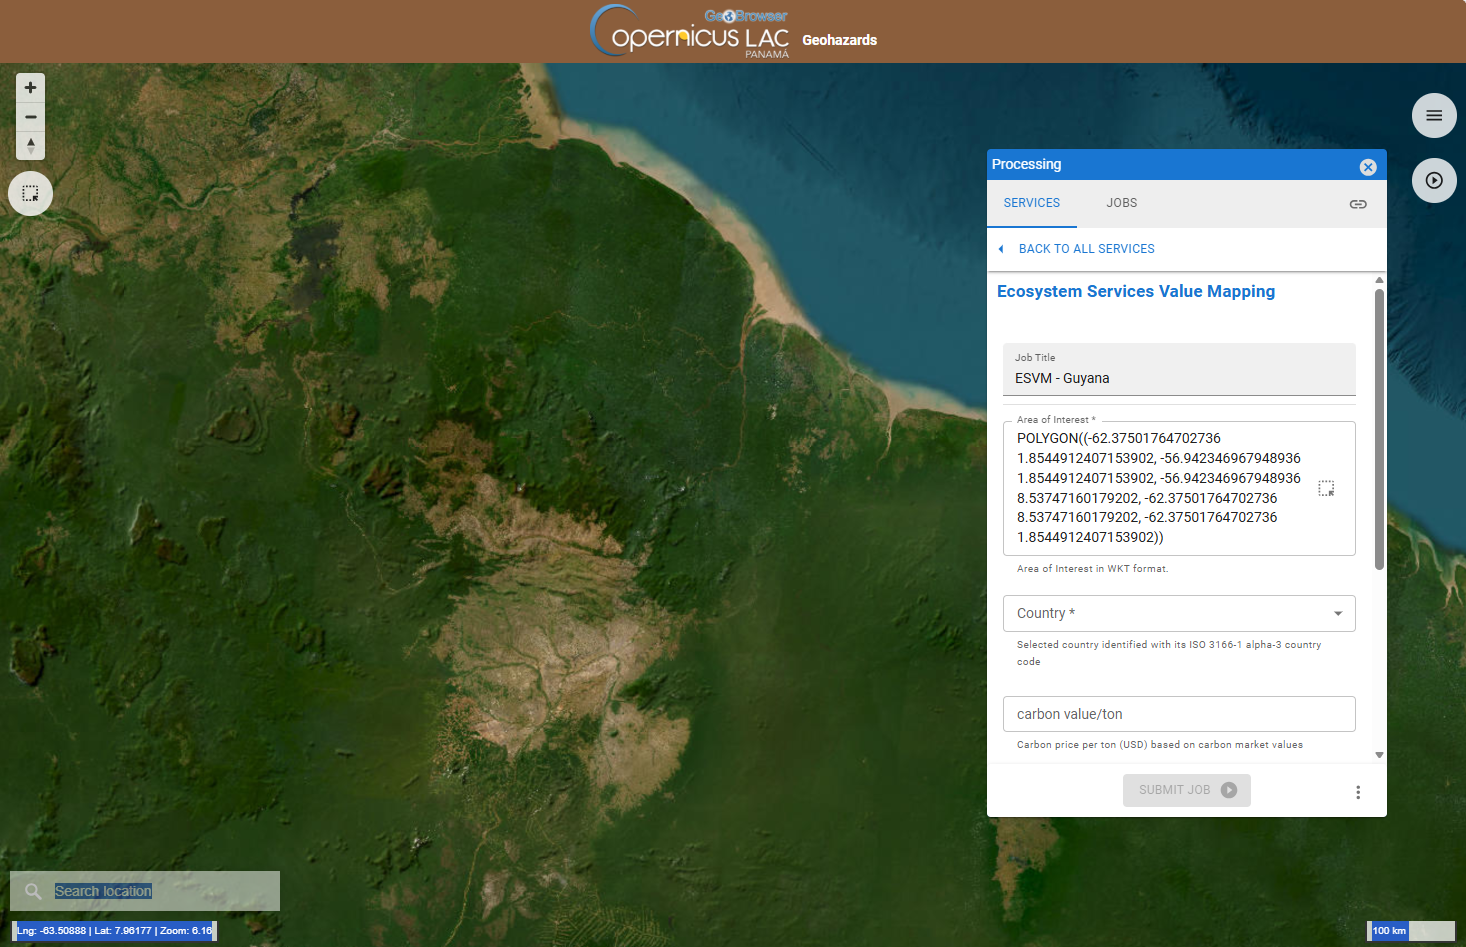
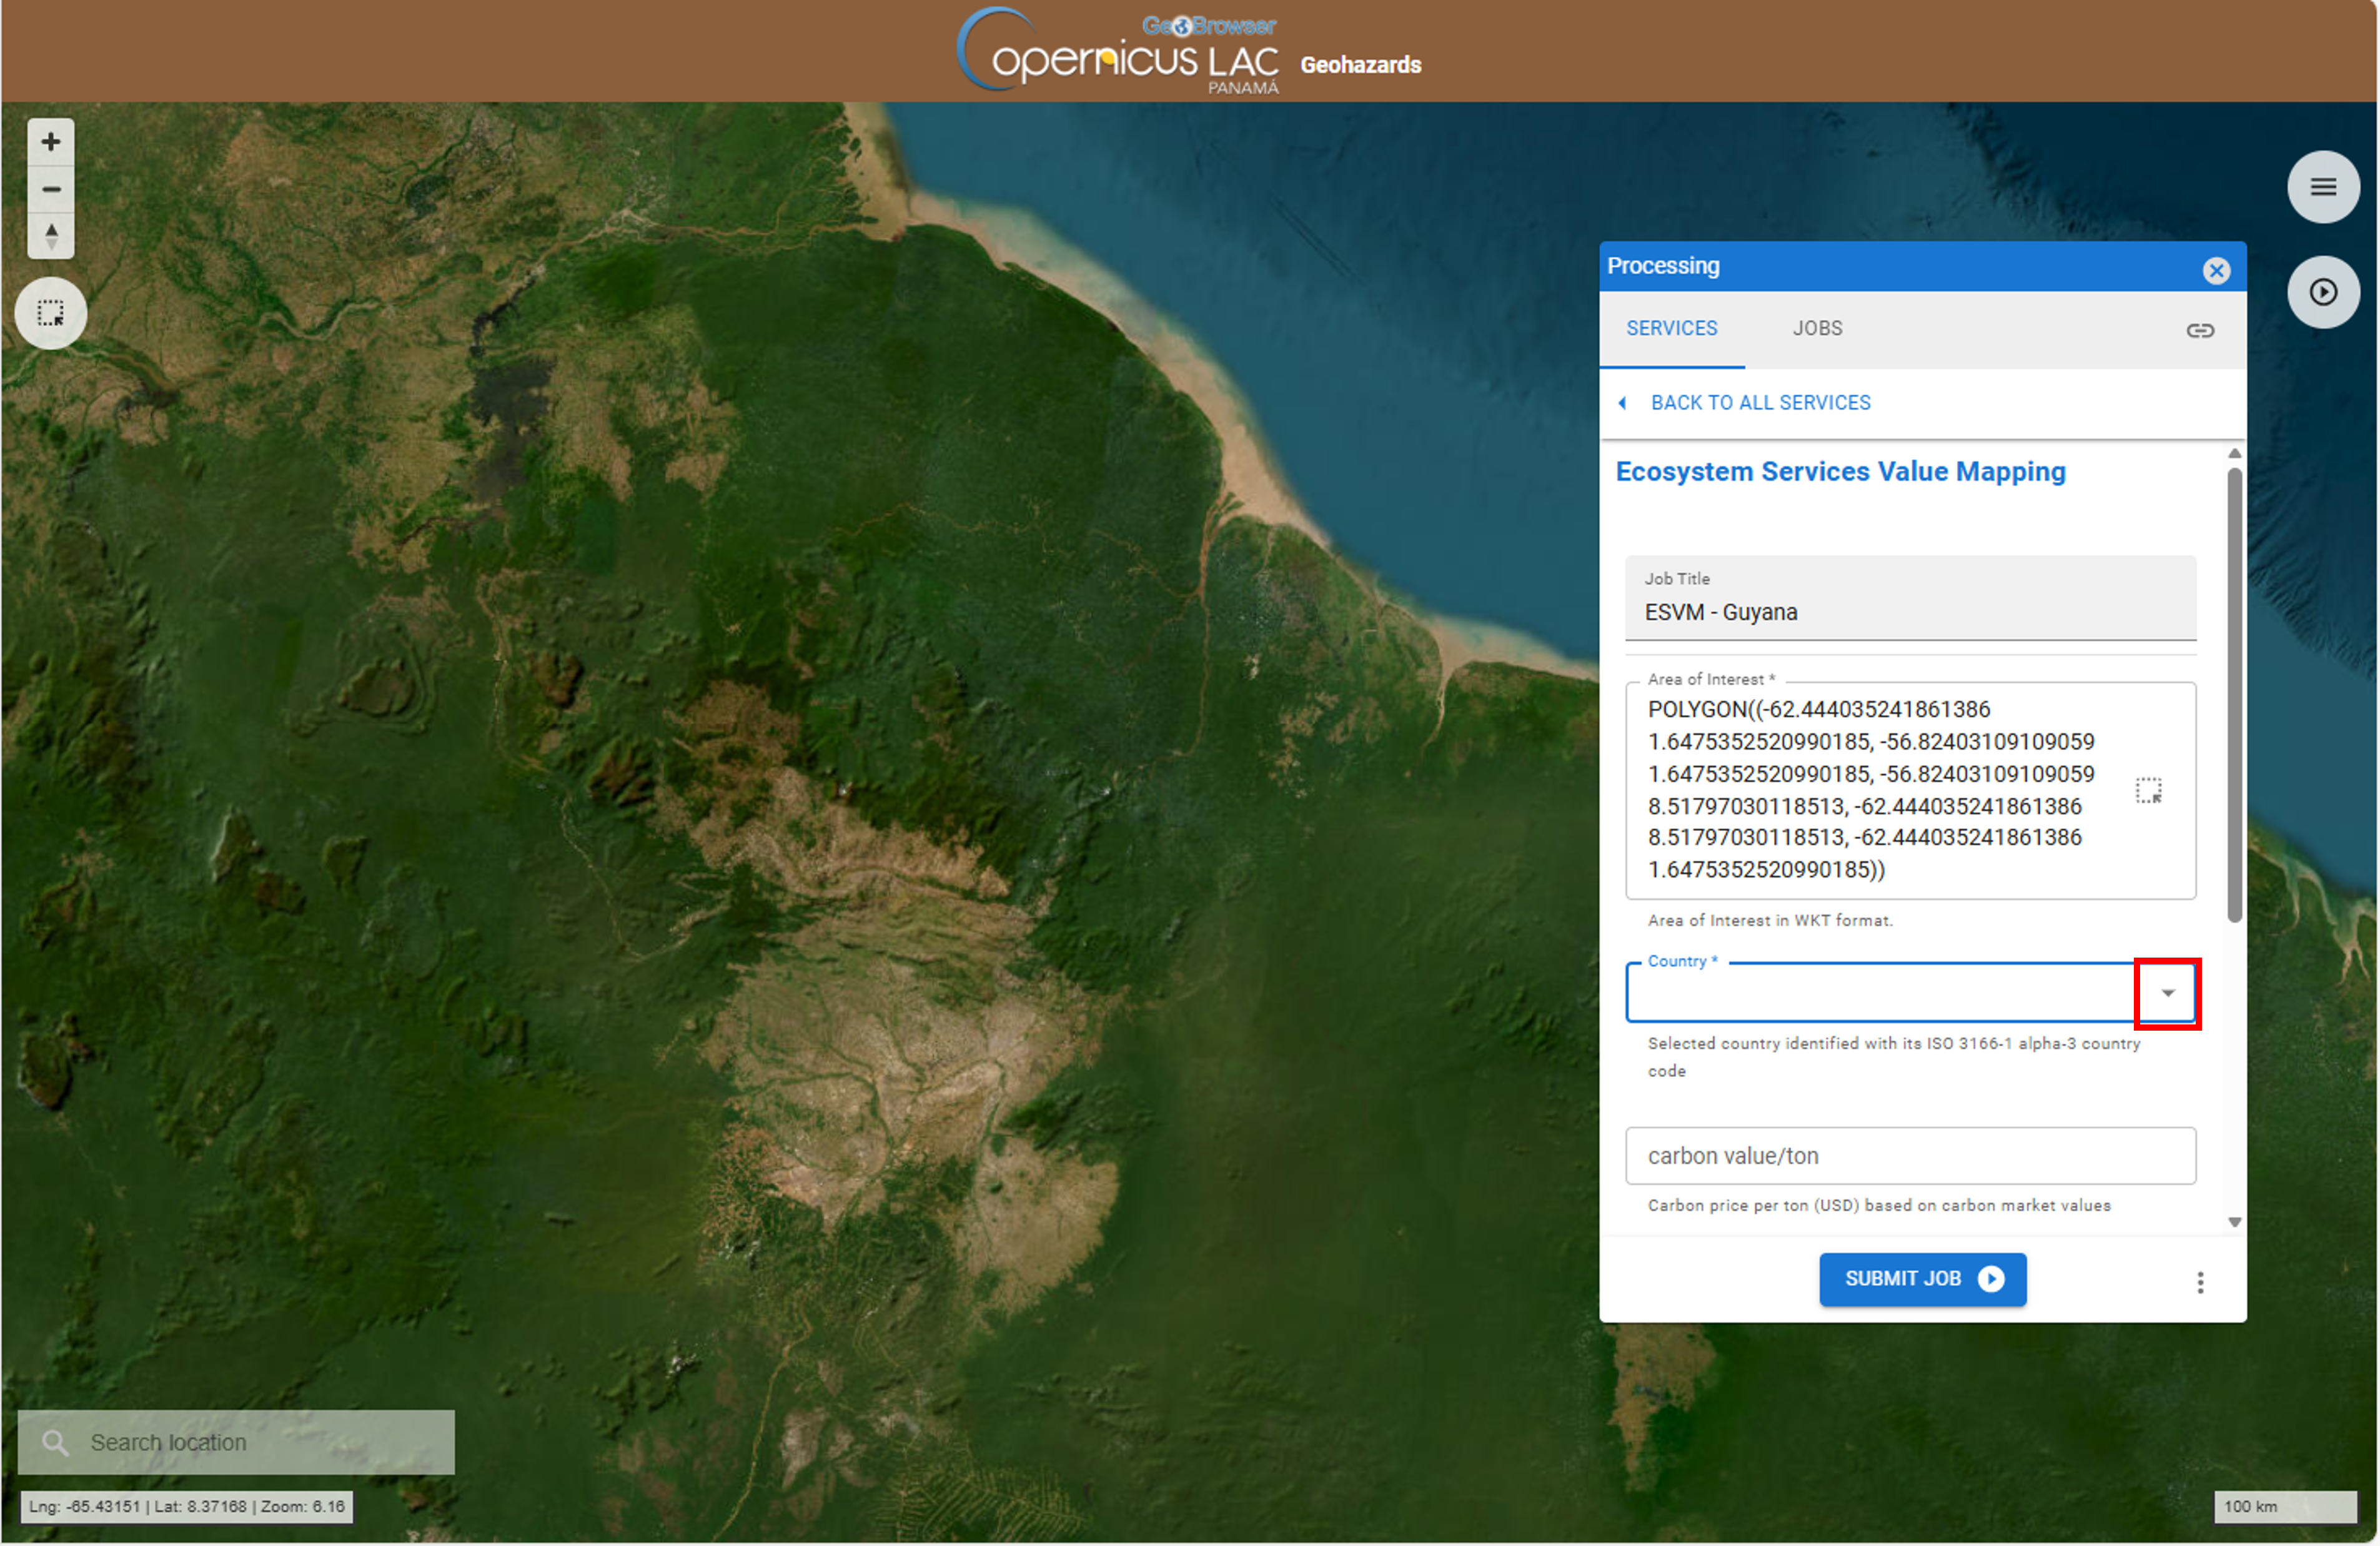
- After that the coordinates of your polygon will automatically appear in the Area of Interest field in your form, as a WKT string like the one appearing in the image.
Country selection
For the service to function better, it is important to select which country corresponds to the selected area of interest.
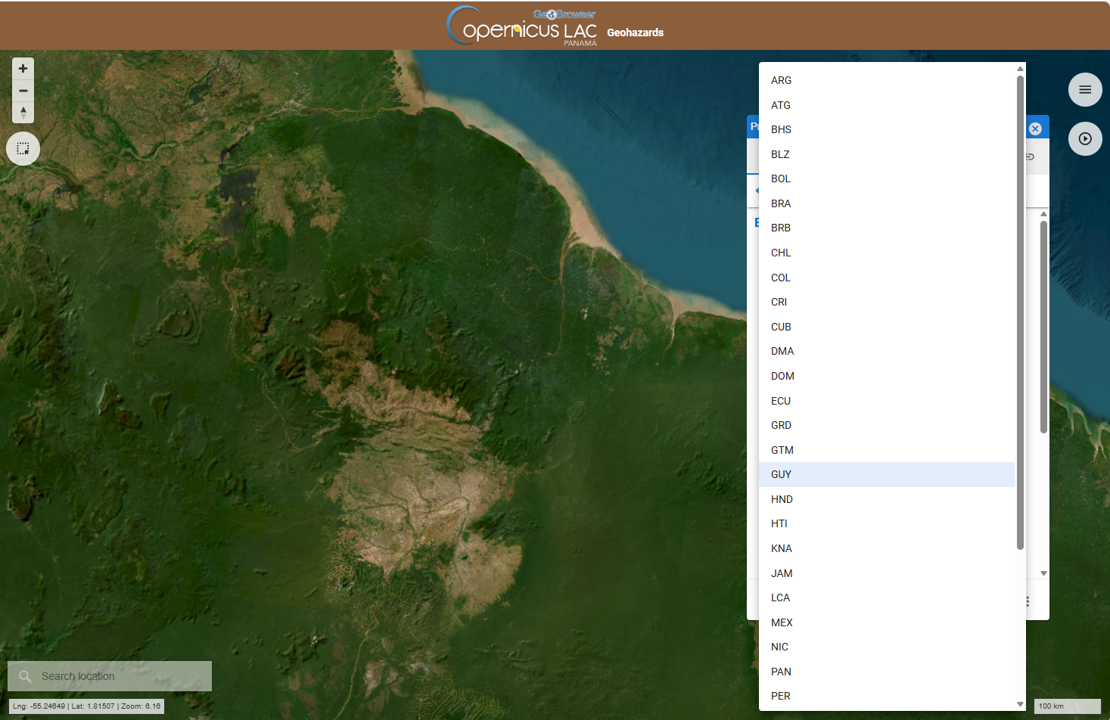
To do so, click on the "Country" selector in the form.
Then, a list of three-letter codes for each country will appear, as shown in the image. Select the code for the country you are interested in.
Cost parameters
The service is based on geospatial data and biophysical models combined with economic cost parameters for carbon storage, sediment retention, and nutrient removal (nitrogen and phosphorus), expressed in USD per unit area.
For a detailed information on the geospatial data used, please refer to the service specifications.
Regarding the economic data, the service relies on two types of cost parameters:
-
Default values : Predefined estimates of carbon price per ton, sediment removal cost per ton, and nitrogen and phosphorus removal costs per kilogram at the national level. These are available in available in here.
-
User-provided values: Custom inputs that replace the default values with user-defined cost parameters.
These cost parameters represent the economic value of maintaining or enhancing ecosystem functions by avoiding replacement costs or marked-based expenses. The categories include:
- Carbon storage :
- Description: Represents the amount of carbon stored in vegetation and soil, which helps mitigate climate change by reducing atmospheric CO₂.
- Cost Basis: The carbon price per ton (USD), based on carbon market values or social cost of carbon. This reflects the economic benefit of avoiding emissions through natural carbon sequestration.
- Sediment Retention :
- Description: Measures the capacity of ecosystems (e.g., forests, wetlands) to prevent soil erosion and sediment transport into rivers and reservoirs.
- Cost Basis: The sediment removal cost per ton (USD), based on avoided dredging and disposal expenses in reservoirs and waterways. This represents savings in infrastructure maintenance.
- Nitrogen Retention :
- Description: Indicates the ability of ecosystems to retain nitrogen and prevent its leaching into water bodies, reducing eutrophication risks.
- Cost Basis: The nitrogen removal cost per kg (USD), derived from the cost of removing nitrogen in wastewater treatment systems. This reflects avoided treatment expenses.
- Phosphorus Retention :
- Description : Captures the ecosystem’s role in retaining phosphorus, preventing harmful algal blooms and water quality degradation.
- Cost Basis: The phosphorus removal cost per kg (USD), based on wastewater treatment efficiency and associated costs. This represents avoided costs for water quality management.
Users can modify the default cost parameters by entering their own values in the service form: - Carbon Price per Ton: Insert the carbon price in USD per metric ton of CO₂. - Sediment Removal Cost per Ton: Insert the sediment removal cost in USD per ton. - Nitrogen Removal Cost per Kilogram: Insert the nitrogen removal cost in USD per kg. - Phosphorus Removal Cost per Kilogram: Insert the phosphorus removal cost in USD per kg.
If no modifications are made, the service will use the default values.
Carbon Price per Ton
This value represents the cost parameter used to estimate the economic value of carbon storage in ecosystems. It reflects either the carbon market price or the social cost of carbon, expressed in USD per metric ton of CO₂. To customize the value, simply insert in the field the carbon price in in the corresponding field, as shown in the image.
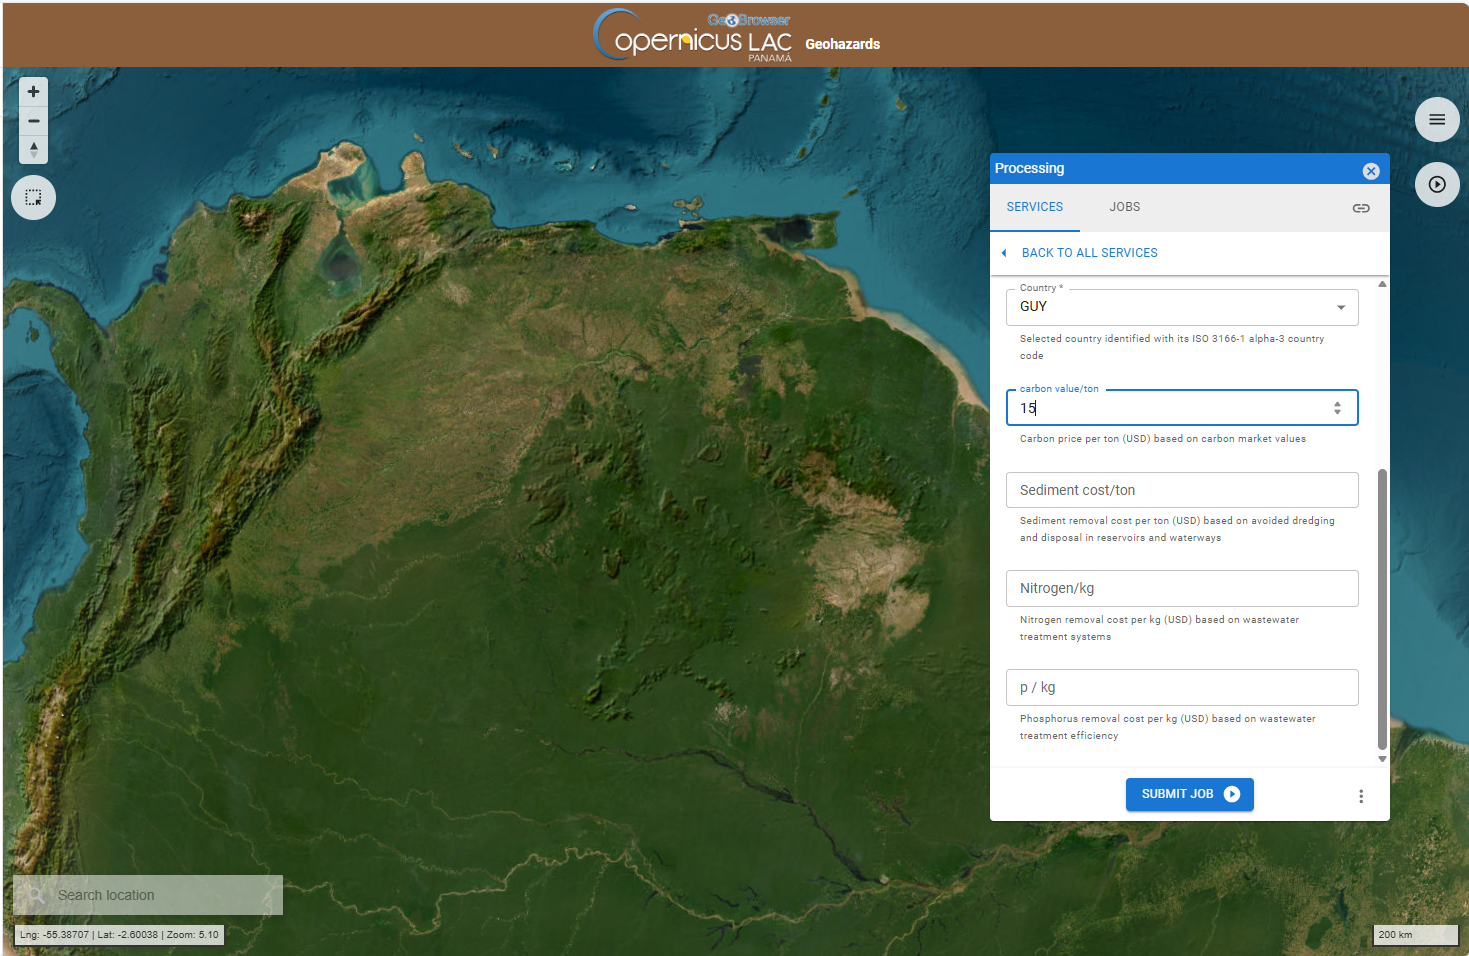
The remaining fields are customized same way.
Sediment Removal Cost per Ton
This value corresponds to the cost of removing one metric ton of sediment from reservoirs and waterways. It represents the avoided dredging and disposal expenses thanks to natural sediment retention by ecosystems. To customize the value, insert the sediment removal cost in US Dollars per ton in the corresponding field.
Nitrogen Removal Cost per Kilogram
This value reflects the cost of removing nitrogen from wastewater using treatment systems. It represents the avoided treatment expenses due to ecosystem nutrient retention. To customize the value, insert the nitrogen removal cost in US Dollars per kilogram in the corresponding field.
Phosphorus Removal Cost per Kilogram
This value represents the cost of removing phosphorus from wastewater, based on treatment efficiency. It reflects the avoided costs for water quality management provided by ecosystems. To customize the value, insert the phosphorus removal cost in US Dollars per kilogram in the corresponding field.
Run the job
After filling in all the required parameters, click SUBMIT JOB to start the service.
Once submitted, you will be automatically redirected to the JOBS tab, where you can view the list of all previously submitted jobs. Your newly created job will appear at the top of the list.
From this tab, you can monitor the progress of your job, which can have one of the following statuses: running, succeeded or failed.
Note
Typically, the service execution is ranging from some minutes to few hours depending on the extent of the user’s AOI and the allocation of processing resources for the job to be executed. As an example, to employ the ESVM service over an AOI of 534,000square kilometers the processing time is approximately 5 hours.
Results
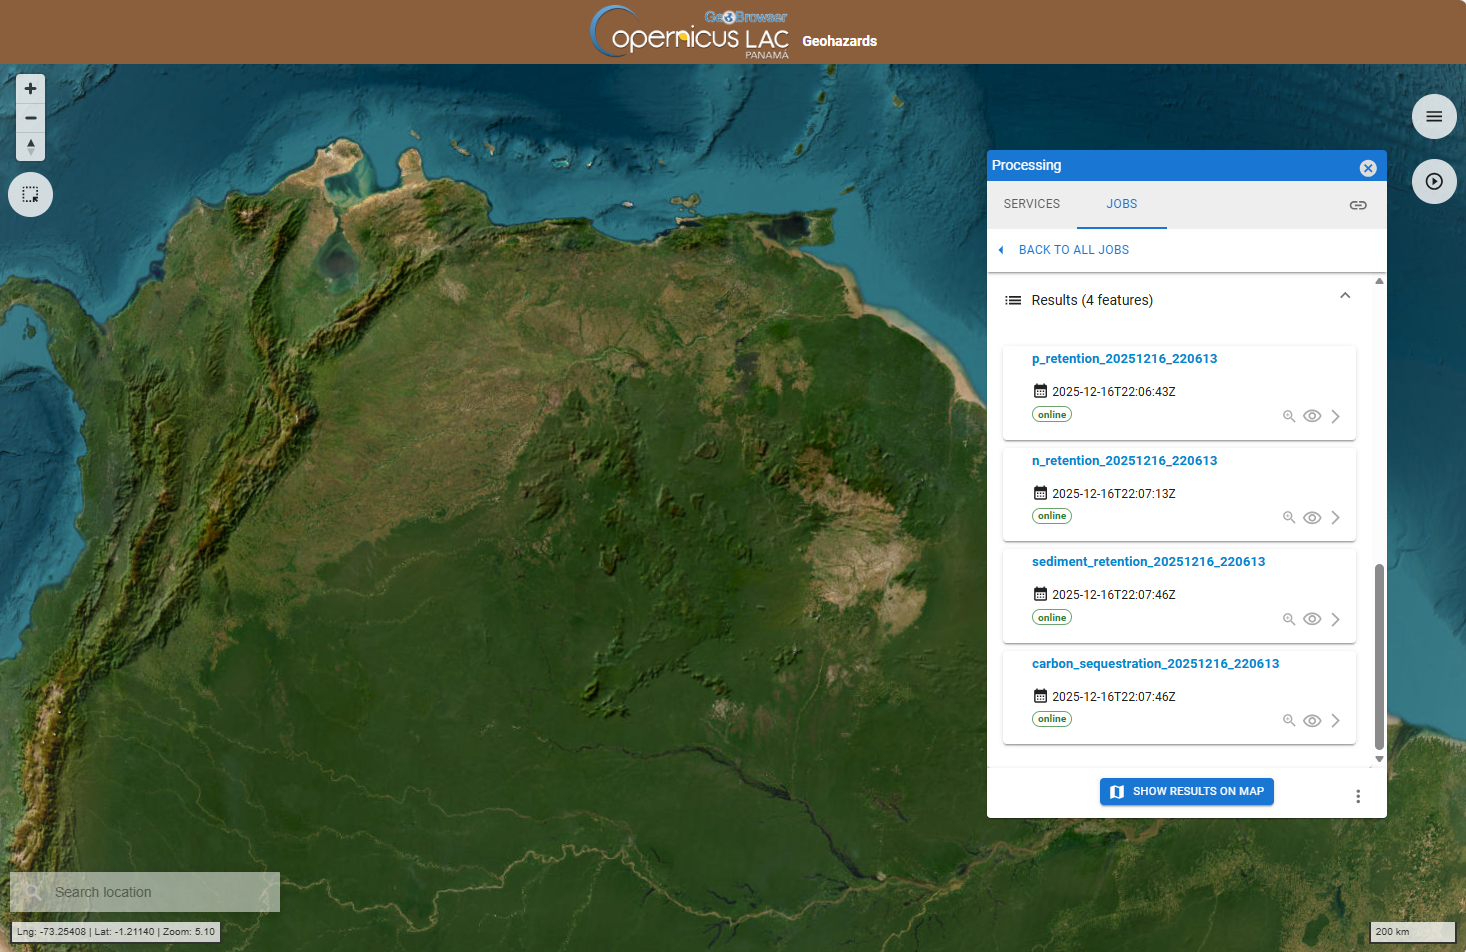
Once the job is successfully accomplished, under the job details click on the button SHOW RESULTS ON MAP located in the JOBS tab of the left panel.
After that all the products generated by the service will be displayed on the map.
From the details of the job, accessible in the JOBS tab of the left panel, you can consult the input parameters employed in this job and you can access the results generated by the service. This is possible by clicking on the Input or the Results dropdown list buttons.
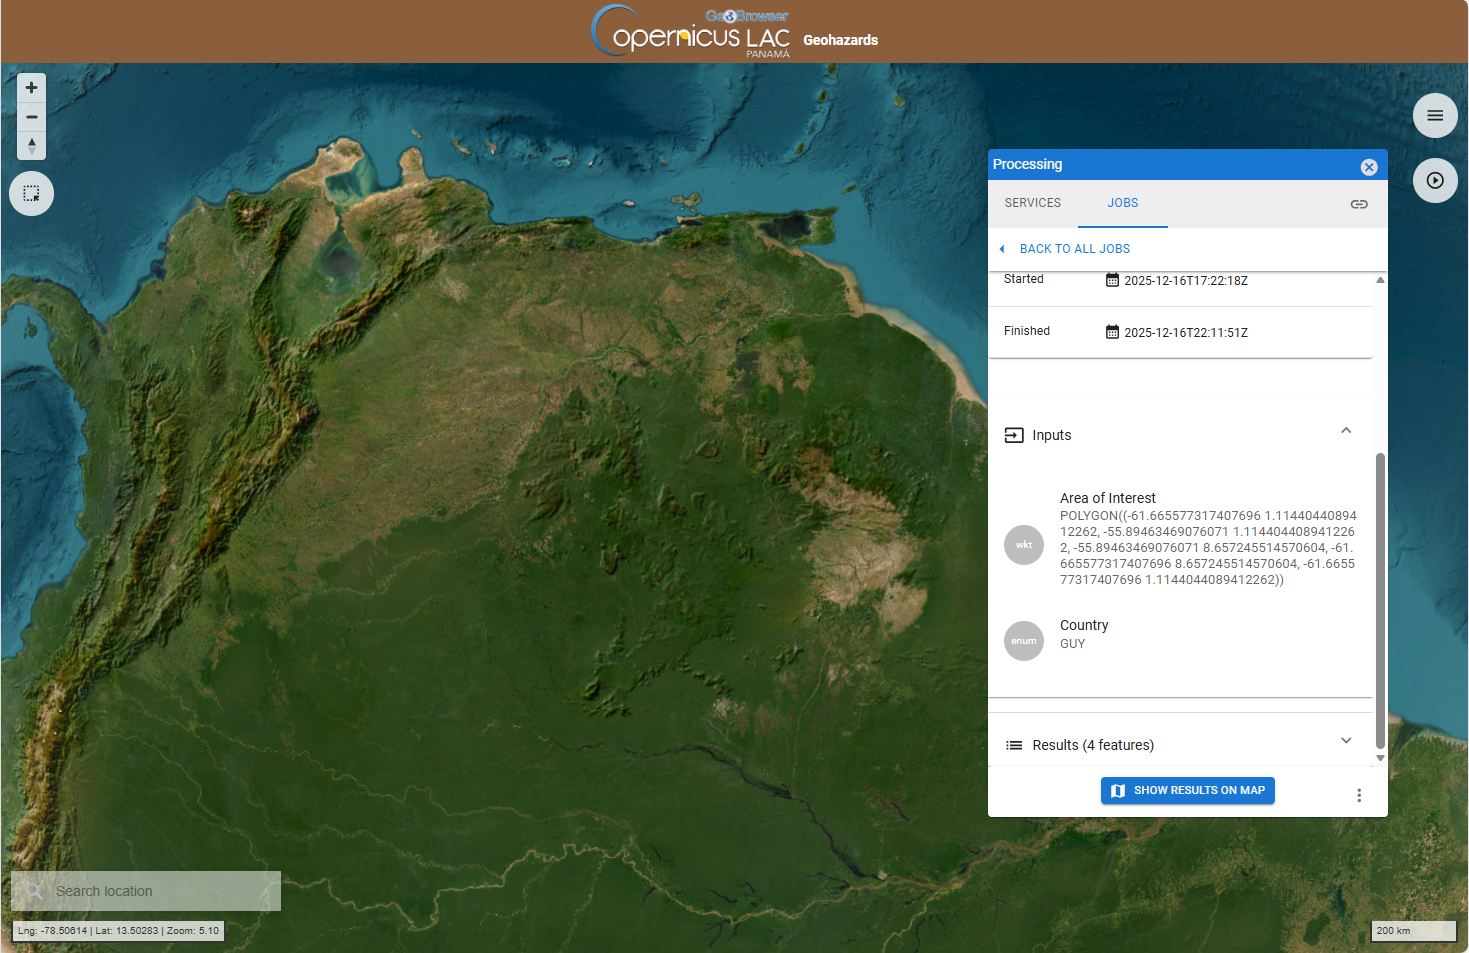
Click on the Results (4 features) button to find the 4 assets generated by the ESVM service that can be visualized in the map.
Select for instance the carbon_sequestration_20251216_220613 product by clicking on the title. After this selection the single product will be displayed on the map with related metadata shown under the DETAILS tab in the left panel.
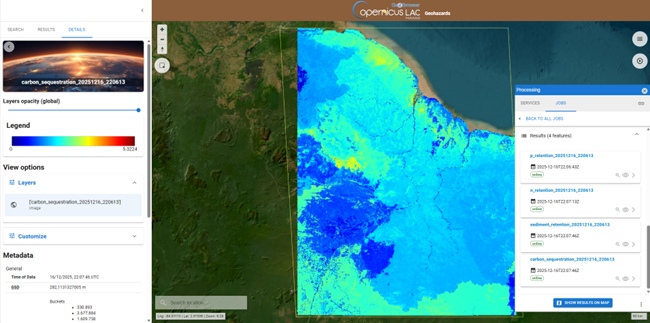
From DETAILS tab in the left panel it is also possible to:
-
set the opacity of the layer,
-
visualize the legend of the product,
-
under view options consult the render applied to the layer and, its histogram (when available), and apply a custom render,
-
download the product.
Consult the Metadata available. You can find for instance more information about how to interpret the result under Description.
Hint
Do you want to see both the result and the underneath satellite imagery baselayer? Try using the Layers opacity (global) bar, and set the opacity as 50% to better see for instance also the labels of the basemap layer.
Note
Aren't you satisfied with the default render of the product available under Layers in the View options? You can customize it by clicking on Customize under View options in the left panel. Please note that when you apply a custom render to the asset the legend will be updated accordingly.
To download the product from the left panel click on the Downloads dropdown button and then on the hyperlink of the single asset.