Ecosystem Services Value Mapping service specifications
![]()
Find ESVM service tutorial here.
Service Description
The Ecosystem Services Value Mapping (ESVM) service estimates the economic value of natural ecosystem functions within a user-defined Area of Interest (AOI). It combines Earth Observation data with biophysical models and cost parameters to produce high-resolution maps expressed in USD/m².
The service focuses on four key ecosystem services: - Carbon Storage - Sediment retention - Nitrogen retention - Phosphorus retention
These outputs represent the avoided costs associated with carbon emissions, dredging and water treatment, producing a spatial basis for climate adaptation, risk assessment, and sustainable land-use planning in Latin America and the Caribbean.
The service is provided by Indra Espacio SLU and is deployed in the CopernicusLAC platform, powered by Terradue Srl.
Economic Basis of the service
The ESVM service combines geospatial data and biophysical models with economic cost parameters to estimate the monetary value of ecosystem services, expressed in USD per unit area.
The economic valuation relies on two types of cost parameters: - Default values: Predefined estimates of carbon price per ton, sediment removal cost per ton, and nitrogen and phosphorus removal costs per kilogram at the national level. - User-provided values: Custom inputs that replace the default values with user-defined cost parameters.
These cost parameters represent the economic benefit of maintaining or enhancing ecosystem functions by avoiding replacement costs, or market-based expenses. The categories and their cost basis are:
- Carbon Storage: Amount of carbon stored in vegetation and soil; valued using carbon price per ton (USD) from carbon markets or social cost of carbon.
- Sediment Retention: Ecosystem capacity to prevent soil erosion and sediment transport; valued using sediment removal cost per ton (USD) based on avoided dredging and disposal.
- Nitrogen Retention: Ability to retain nitrogen and reduce eutrophication; valued using nitrogen removal cost per kg (USD) based on wastewater treatment costs.
- Phosphorus Retention: Role in retaining phosphorus and preventing algal blooms; valued using phosphorus removal cost per kg (USD) based on water treatment efficiency.
Users can modify these cost parameters in the service form: - Carbon Price per Ton (USD) - Sediment Removal Cost per Ton (USD) - Nitrogen Removal Cost per kg (USD) - Phosphorus Removal Cost per kg (USD)
If no modifications are made, the service applies default values.
Workflow
Figure 1 and Figure 2 describe respectively the high-level workflow and detailed workflow of the ESVM service.
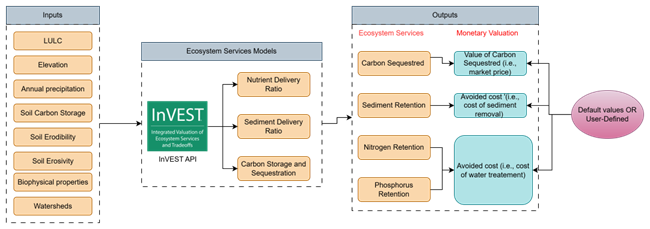
The ESVM workflow consists roughly of two main steps (Figure 1):
-
Step 1: Biophysical Modeling
- InVEST models compute spatial layers for carbon storage, sediment retention, and nutrient retention (nitrogen and phosphorus) using land cover and terrain data.
- These layers quantify the physical capacity of ecosystems to provide services within the AOI.
-
Step 2: Economic valuation
- Biophysical outputs are converted into monetary values by applying cost parameters (default or user-provided).
- The result is four raster maps expressed in USD/m2, representing avoided costs for each ecosystem service.
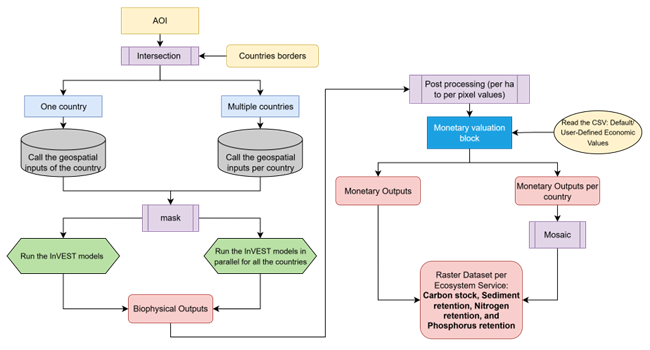
On the other hand, Figure 2 depicts the detailed workflow to transform the biophysical computation into monetary valuation. It supporst AOIs spanning one or multiple countries.
AOI Processing and Geospatial inputs
-
AOI intersection with Country Borders
- The AOI geometry is intersected with national boundaries to determine whether it covers:
- Single Country: Retrieve geospatial inputs for that country.
- Multiple Countries: Retrieve geospatial inputs for each country individually.
- The AOI geometry is intersected with national boundaries to determine whether it covers:
-
Geospatial Inputs
- Inputs include land cover, elevation and ancillary datasets required by InVEST models
- For multi-country AOIs, inputs are processed in parallel per country
-
Masking
- Apply AOI mask to clip geospatial layers to the user-defined extent
Biophysical Modeling
-
Run InVEST Models:
- Carbon Storage
- Sediment Retention
- Nitrogen Retention
- Phosphorus Retention
-
Outputs: Four raster layers representing the physical capacity of ecosystems to provide services within the AOI
Economic valuation
-
Read Economic Parameters:
- Load cost values from CSV
- Default values or
- User-defined values entered in the service form.
- Parameters include:
- Carbon price per ton (USD)
- Sediment removal cost per ton (USD)
- Nitrogen removal cost per kg (USD)
- Phosphorus removal cost per kg (USD)
- Load cost values from CSV
-
Monetary Valuation Block
- Convert biophysical outputs to monetary values:
- Apply cost parameters per hectare or per pixel.
- Generate monetary outputs for each ecosystem service
- Convert biophysical outputs to monetary values:
-
Post-Processing
- For multi-country AOIs
- Compute monetary outputs per country
- Mosaic results into a single raster dataset per ecosystem service
- For multi-country AOIs
Input
The Ecosystem Services Value Mapping (ESVM) service requires two categories of inputs: dynamic user parameters and static geospatial datasets. These inputs define the spatial extent, economic assumptions, and modeling context for the valuation process.
Dynamic Inputs (User Parameters)
Provided through the service form on the CopernicusLAC platform:
-
Area of Interest (AOI): A polygon defining the spatial extent of the analysis. The AOI can be drawn interactively on the map or imported as WKT/GeoJSON
-
Country Code: ISO 3-letter code identifying the country (e.g. GUY for Guyana, BRA for Brazil). For AOIs spanning multiple countries, the service processes each country separately and mosaics the outputs. In case the economic values are modified, the service will use the customized values for the country corresponding to the provided country code and leave the others as default.
-
Economic Values: default values or user-provided (customized) values of the next categories:
- Carbon price per ton (USD)
- Sediment removal cost per ton (USD)
- Nitrogen removal cost per kg (USD)
- Phosphorus removal cost per kg (USD)
These parameters control the valuation process and determine how economic data is applied to the selected AOI. For more information check the ESVM service tutorial.
Static Geospatial inputs
Global and regional datasets used for biophysical modelling (not editable by the user):
- ESA WorldCover base land cover at 10 m resolution (2021)
- Copernicus DEM: Elevation layer at 30 m resolution (2021)
- ISRIC SoilGrids: Soil Properties at 250 m resolution (2020)
- WorldClim: Climate data at around 1 km resolution (2022)
These layers provide the biophysical basis for InVEST models (carbon storage, sediment retention, nutrient retention).
Output
The service will produce the following outputs:
-
Carbon Storage (Avoided Emissions Cost)
- Description: Represents the amount of carbon stored in vegetation and soil, which helps mitigate climate change by reducing atmospheric CO₂.
- Cost Basis: Carbon price per ton (USD), based on carbon market values or the social cost of carbon. This reflects the economic benefit of avoiding emissions through natural carbon sequestration.
-
Sediment Retention (Avoided Dredging Cost)
- Description: Measures the capacity of ecosystems (e.g., forests, wetlands) to prevent soil erosion and sediment transport into rivers and reservoirs.
- Cost Basis: Sediment removal cost per ton (USD), based on avoided dredging and disposal expenses in reservoirs and waterways. This represents savings in infrastructure maintenance.
-
Nitrogen Retention (Avoided Wastewater Treatment Cost)
- Description: Indicates the ability of ecosystems to retain nitrogen and prevent its leaching into water bodies, reducing eutrophication risks
- Cost Basis: Nitrogen removal cost per kg (USD), derived from the cost of removing nitrogen in wastewater treatment systems. This reflects avoided treatment expenses.
-
Phosphorus Retention (Avoided Water Quality Management Cost)
- Description: Captures the ecosystem’s role in retaining phosphorus, preventing harmful algal blooms and water quality degradation
- Cost Basis: Phosphorus removal cost per kg (USD), based on wastewater treatment efficiency and associated costs. This represents avoided costs for water quality management.
Format: raster file - Spatial resolution: phosphorus retention: 30 m; nitrogen retention: 30 m; sediment retention: 30 m; carbon sequestration: 300 m. - Frequency: obtained on demand - Spatial coverage: The AOI selected over anywhere in the LAC region. - Temporal coverage: N/A - Constraints: availability of economic data at country level and stable in time
Service Provider
The service is developed by Indra.
References
-
European Commission, Joint Research Centre (JRC) (2021): Nation-wide asset mapping for Sweden (2021-07-06). European Commission, Joint Research Centre (JRC) (Dataset) PID: http://data.europa.eu/89h/519880c9-2c6b-4d06-b0d6-666204903588 ↩
-
Copernicus Emergency Management Service (CEMS). (2023). EMSN157: Region-wide economic asset mapping for Andalusia, Spain (Dataset). European Commission. https://emergency.copernicus.eu/mapping/list-of-components/EMSN157 ↩
-
Richiedei, A., Giuliani, M. and Pezzagno, M., 2025. Sub-Regional Biophysical and Monetary Evaluation of Ecosystem Services: An Experimental Spatial Planning Implementation. Land, 14(2), p.216. ↩