LSHM service tutorial
![]()
Find LSHM service description and specifications here.
Select the processing service
After the opening of the Geohazards workspace of the CopernicusLAC Platform open the Processing Services panel by clicking on the button located on the top right of the map.
The Processing panel will be displayed with the list of on-demand services available for this workspace.
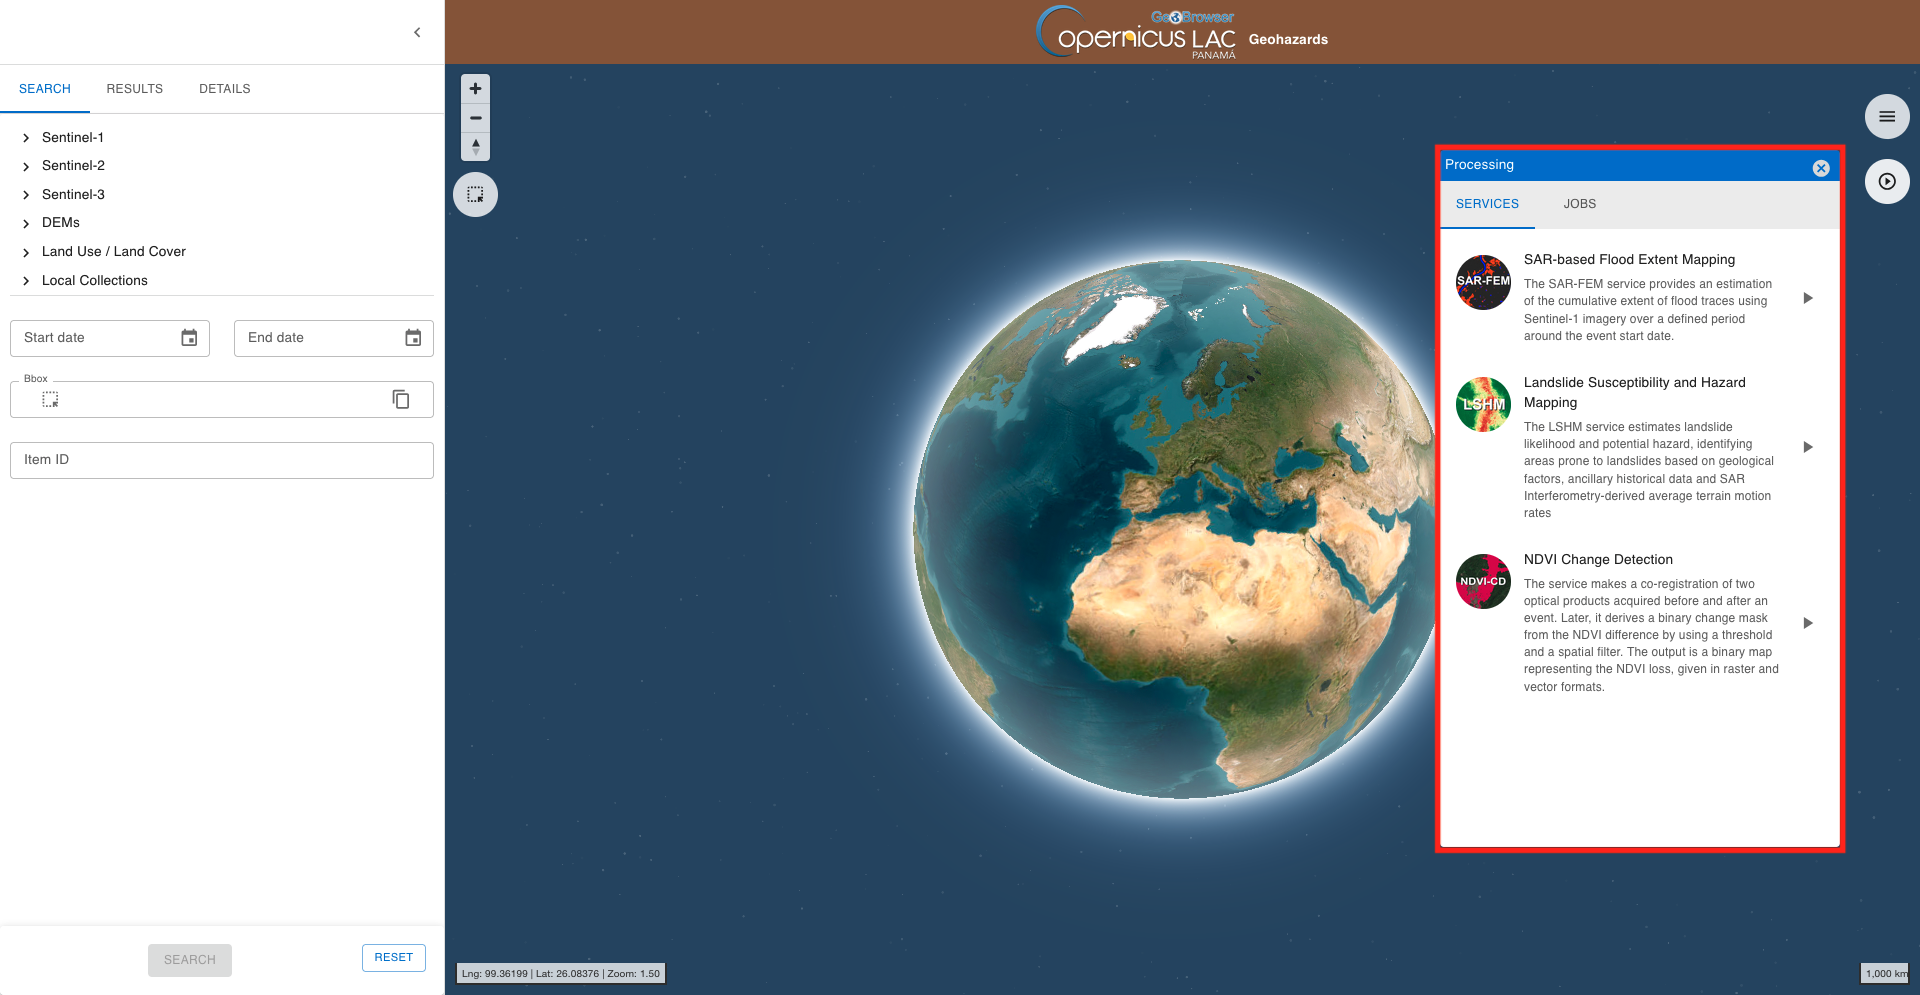
Find the Landslide Susceptibility and Hazard Mapping (LSHM) service from the list and click on the button next to it.
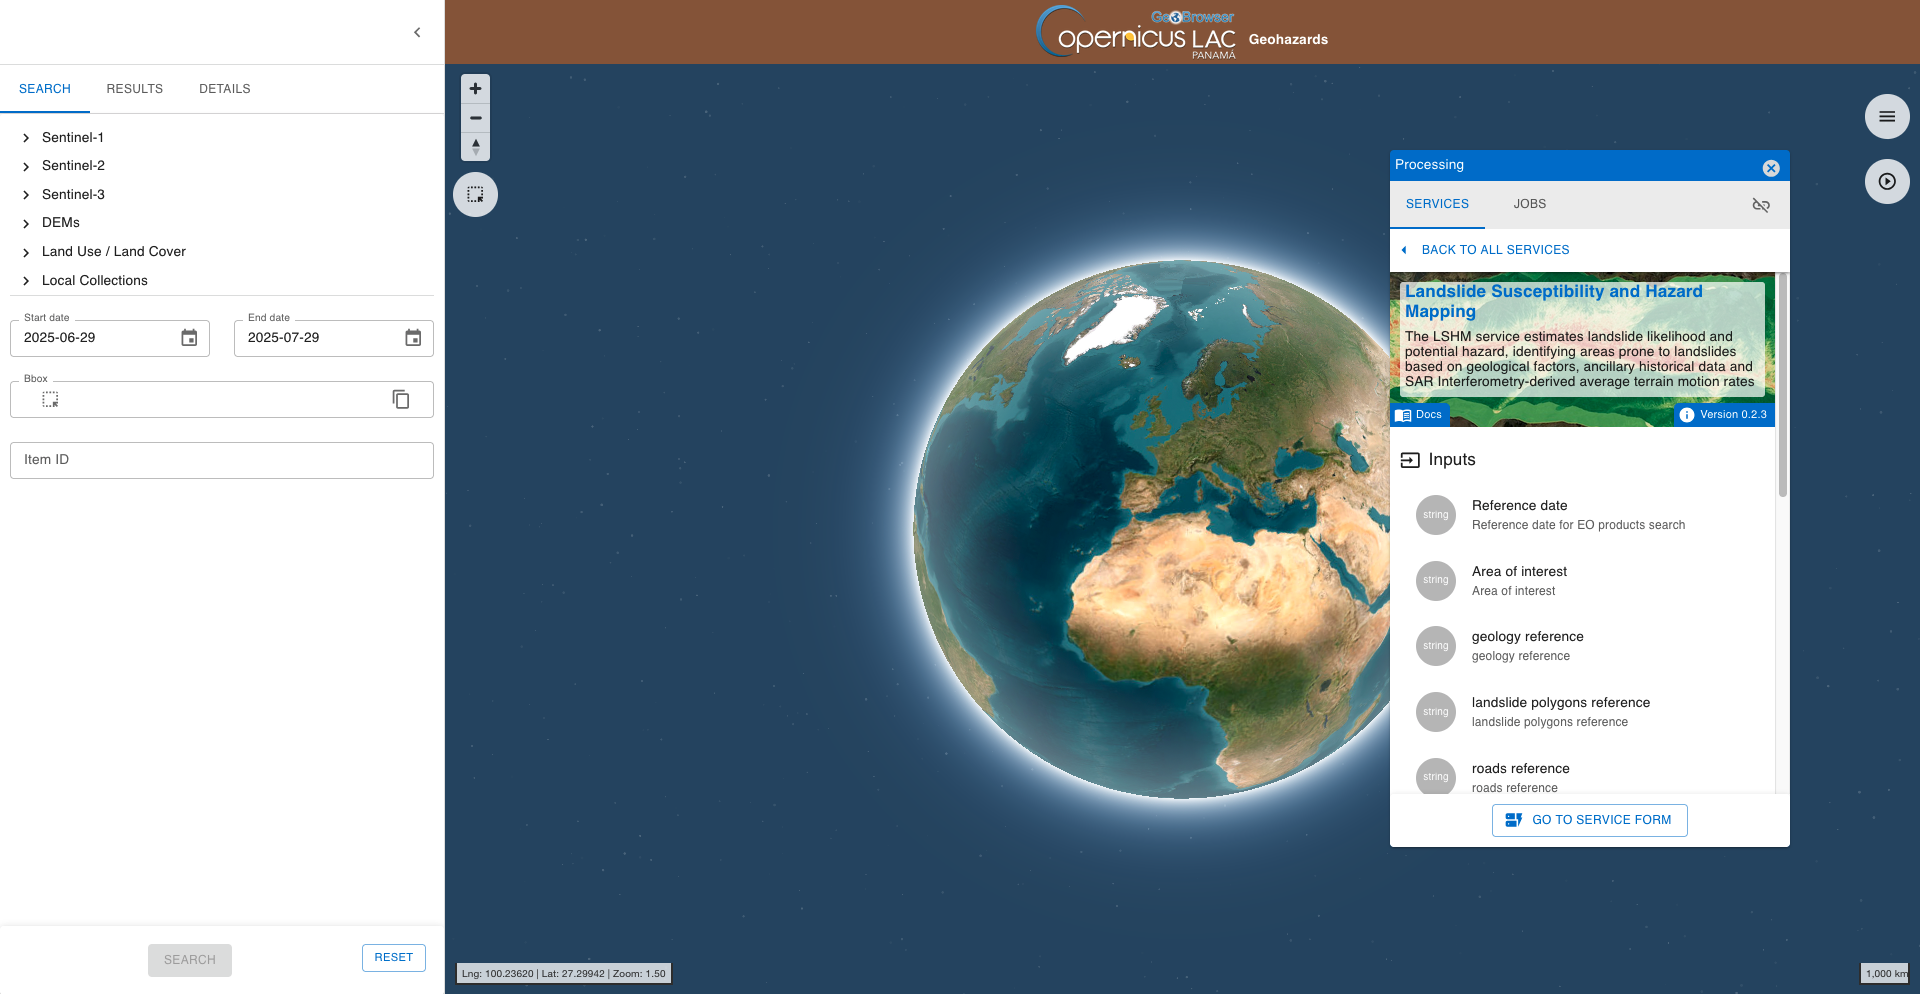
This tab provides a quick description of the service. In the upper part of the tab are shown:
-
service full name,
-
service caption,
-
hyperlink to the online documentation,
-
version of the service.
Below that are listed all mandatory and optional parameters that the user must define when submitting the on-demand processing. Each parameter is described with:
-
a grey circle on the left indicating the format of input value required for the parameter. As an example if the parameter is a string (e.g. catalog reference) or a number (e.g. a threshold),
-
the identifier of the parameter,
-
a brief description of the parameter.
At the bottom of the tab is located the GO TO SERVICE FORM button. Click on it to move to the next tab where the user can fill-in all service parameters and submit the on-demand job.
Hint
To go back to the service panel click on the BACK TO ALL SERVICES button.
Find the input data using multiple filter criteria
Select the area for which you want to do an analysis, as an example the valley including Huantar and Chavín de Huántar near Haraz, Ancash, Peru. In this tutorial the LSHM service is used to assess the landslide likelihood and potential hazard over this valley.
Navigate to the area
To find this area navigate in the map from the global view using the dedicated buttons located in the top left of the map or using the mouse.
Hint
Navigation controls are located on the top right of the map. From these buttons the user can:
-
Zoom in: left click on the button
-
Zoom out: left click on the button
-
Change the viewing angle by setting inclination and orientation: left click and hold the compass button while you drag left and right or up and down.
-
Reset bearing to the north: left click on the compass button
In the 3D view the user can tilt the map in any direction. The 3D tilt control is useful to view hills and mountains.
Note
Same navigation commands can also be done using the mouse.
-
Zooming and panning can be done using the mouse wheel,
-
Changing the viewing angle (inclination and orientation) can be done by holding
Ctrl + Left Clickon the map to start changing the bearing and pitch. While holding theCtrl + Left Clickand moving the cursor the 3D view of the map will start rotating.
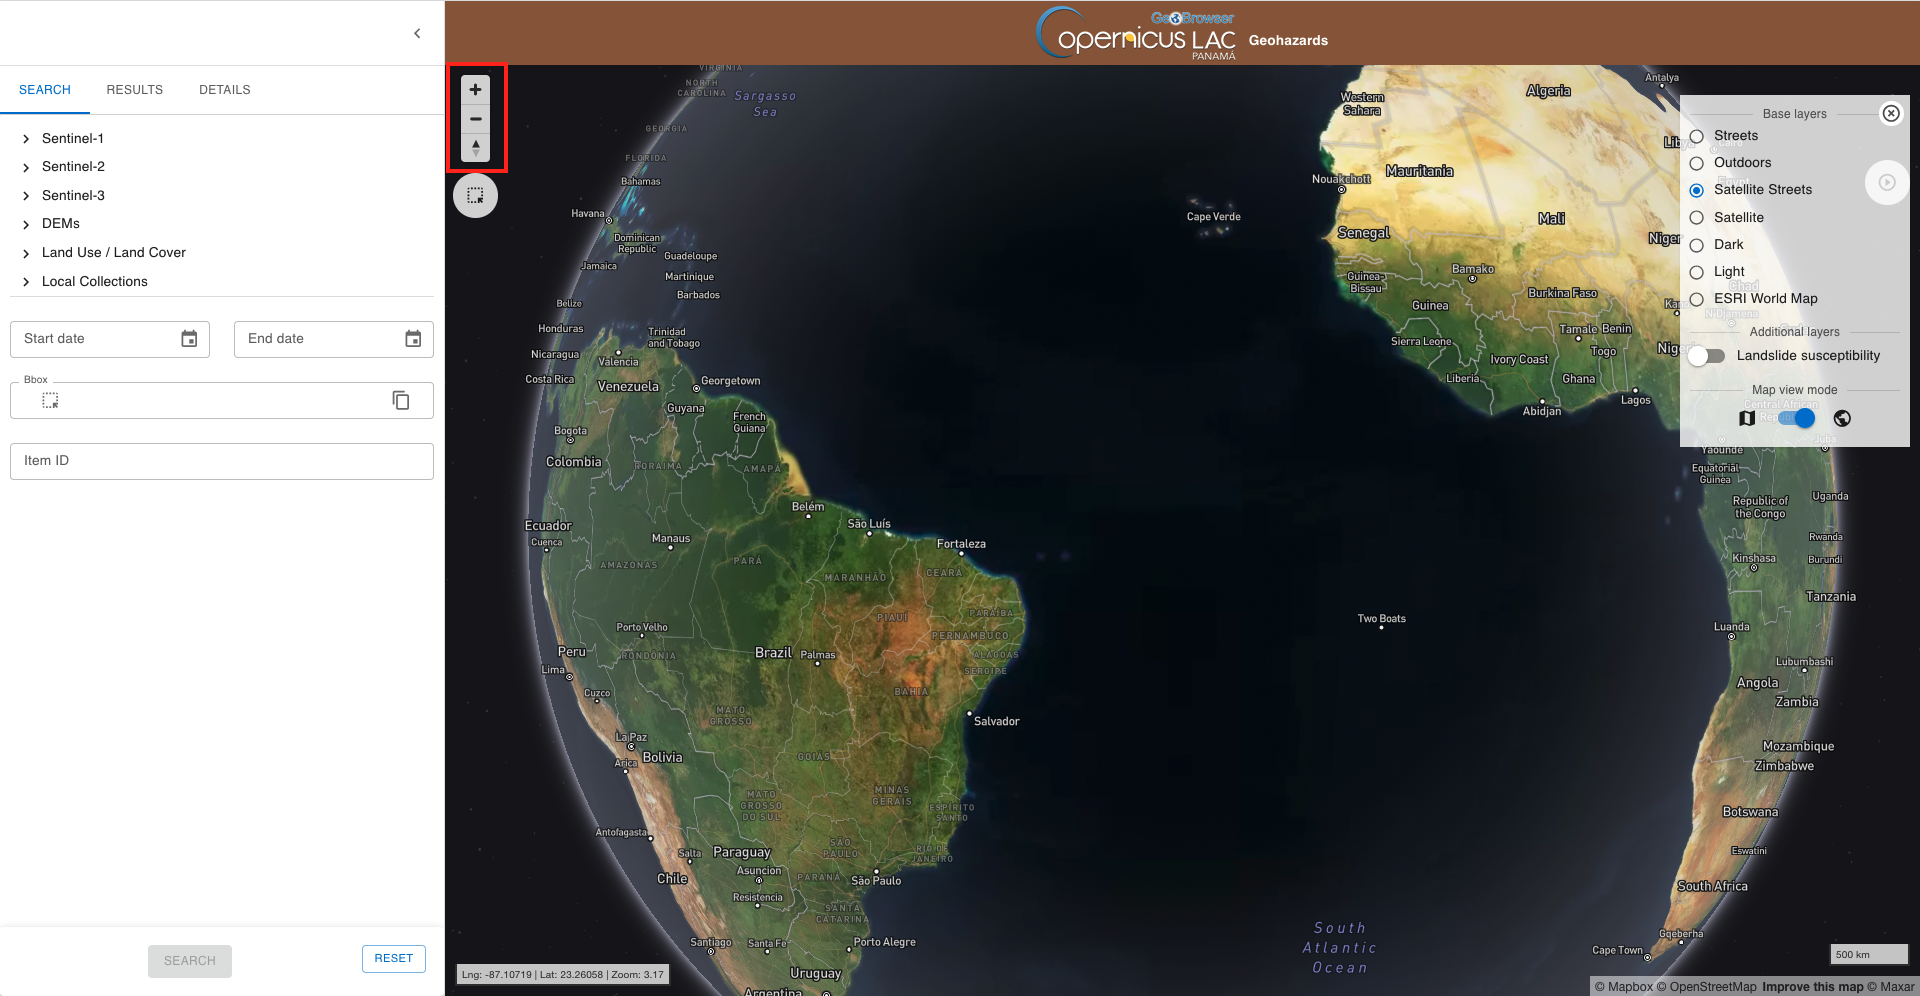
If needed, you can change from the Basemap Control panel the baselayer to better find your area of interest.
Hint
The Basemap Control panel is hidden by default and is accessible by clicking on the button located on the top right of the map.
From this panel the user can change the default background map ESRI World Map with another one by clicking on the desired base layer from the list:
-
Streets
-
Outdoors
-
Satellite Streets
-
Satellite
-
Dark
-
Light
From the Basemap control panel it is also possible to switch from the 3D to a plane view of the map by clicking on the dedicated button located just below the list of base layers. By default the 3D view is selected.
In the Basemap Control panel select the Satellite Streets base layer showing boundaries and places drawn on top of satellite imagery.
After that, navigate to the desired location near Huantar and Chavín de Huántar.
Spatial filter
Employ a spatial filter by drawing an Area of Interest (AOI) on the map over the area near Huantar and Chavín de Huántar using the :material-select-arrow-up: button located in the upper left part of the map.
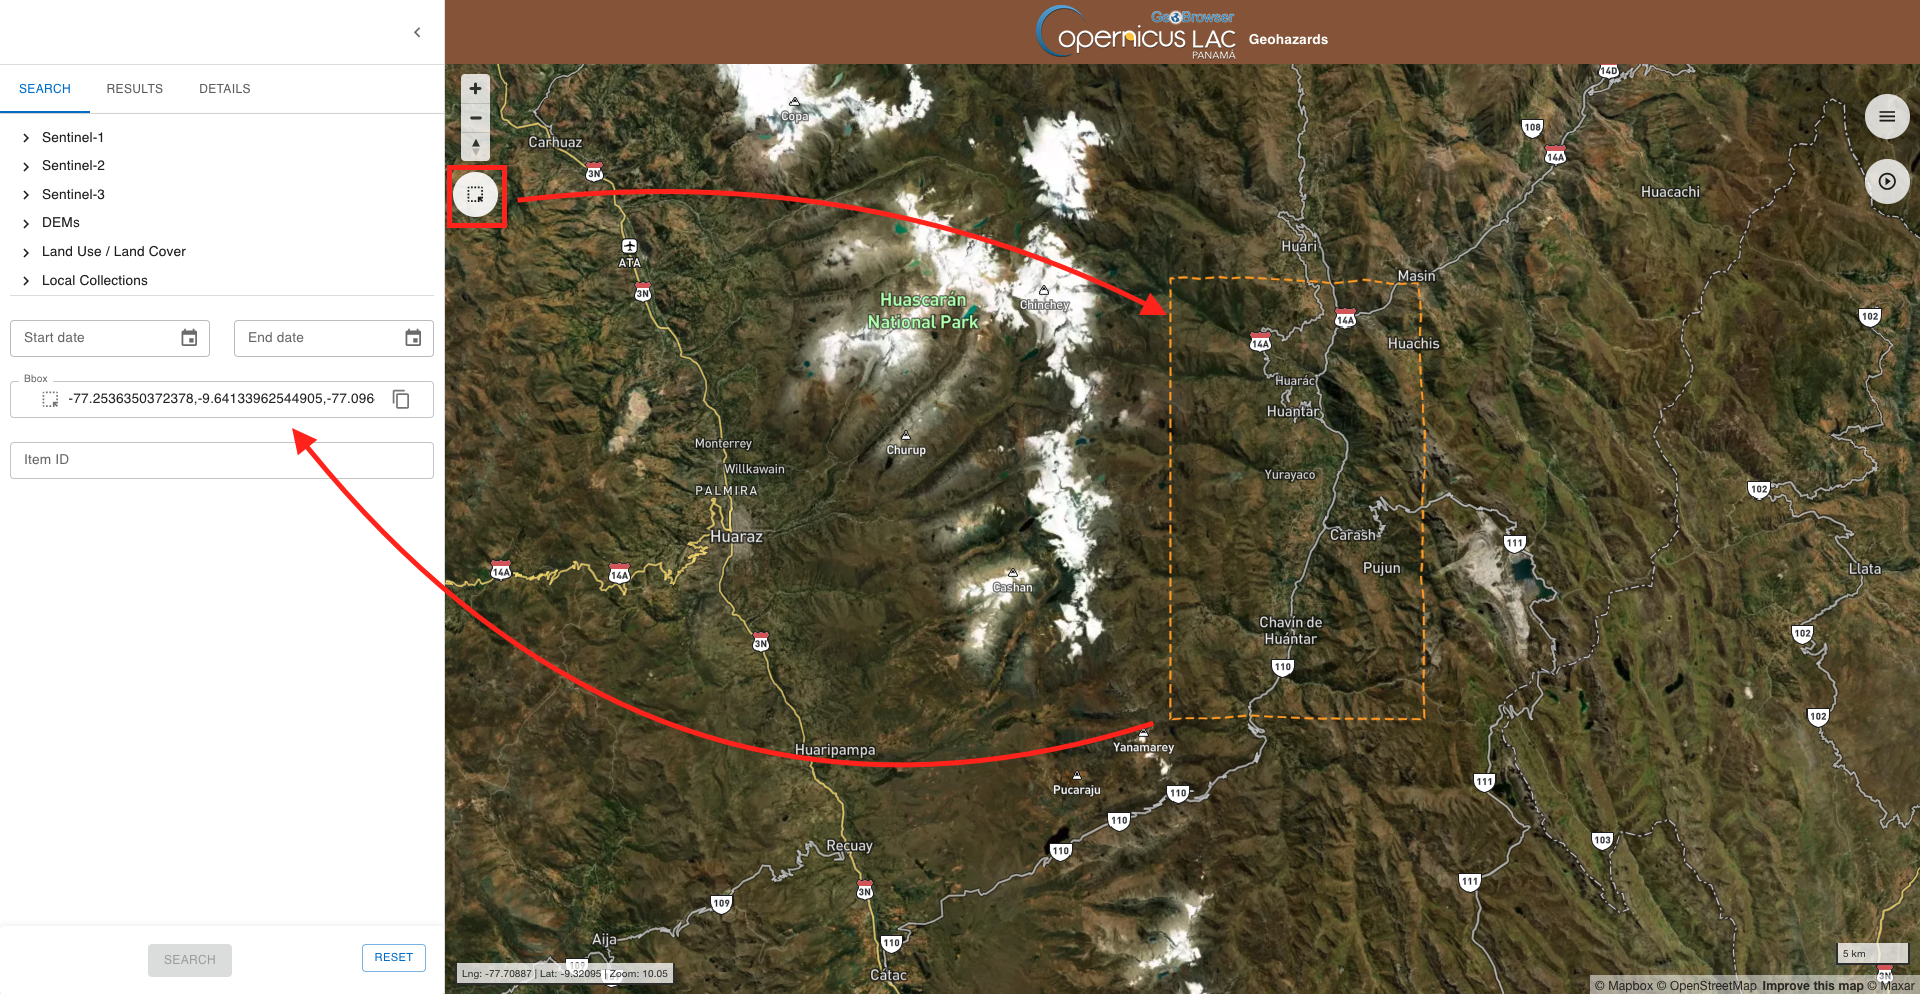
Once in place the spatial filter is in place the BBox field available in the Search tab of the left panel is automatically filled-in with its BBOX geometry in WKT format.
Temporal filter
In the search you can also define a temporal filter. To define your temporal filter you can insert a Start date and an End datefrom the Search tab of the left panel. In this use case insert 2025-01-01 as start date and 2025-07-25 as end date.
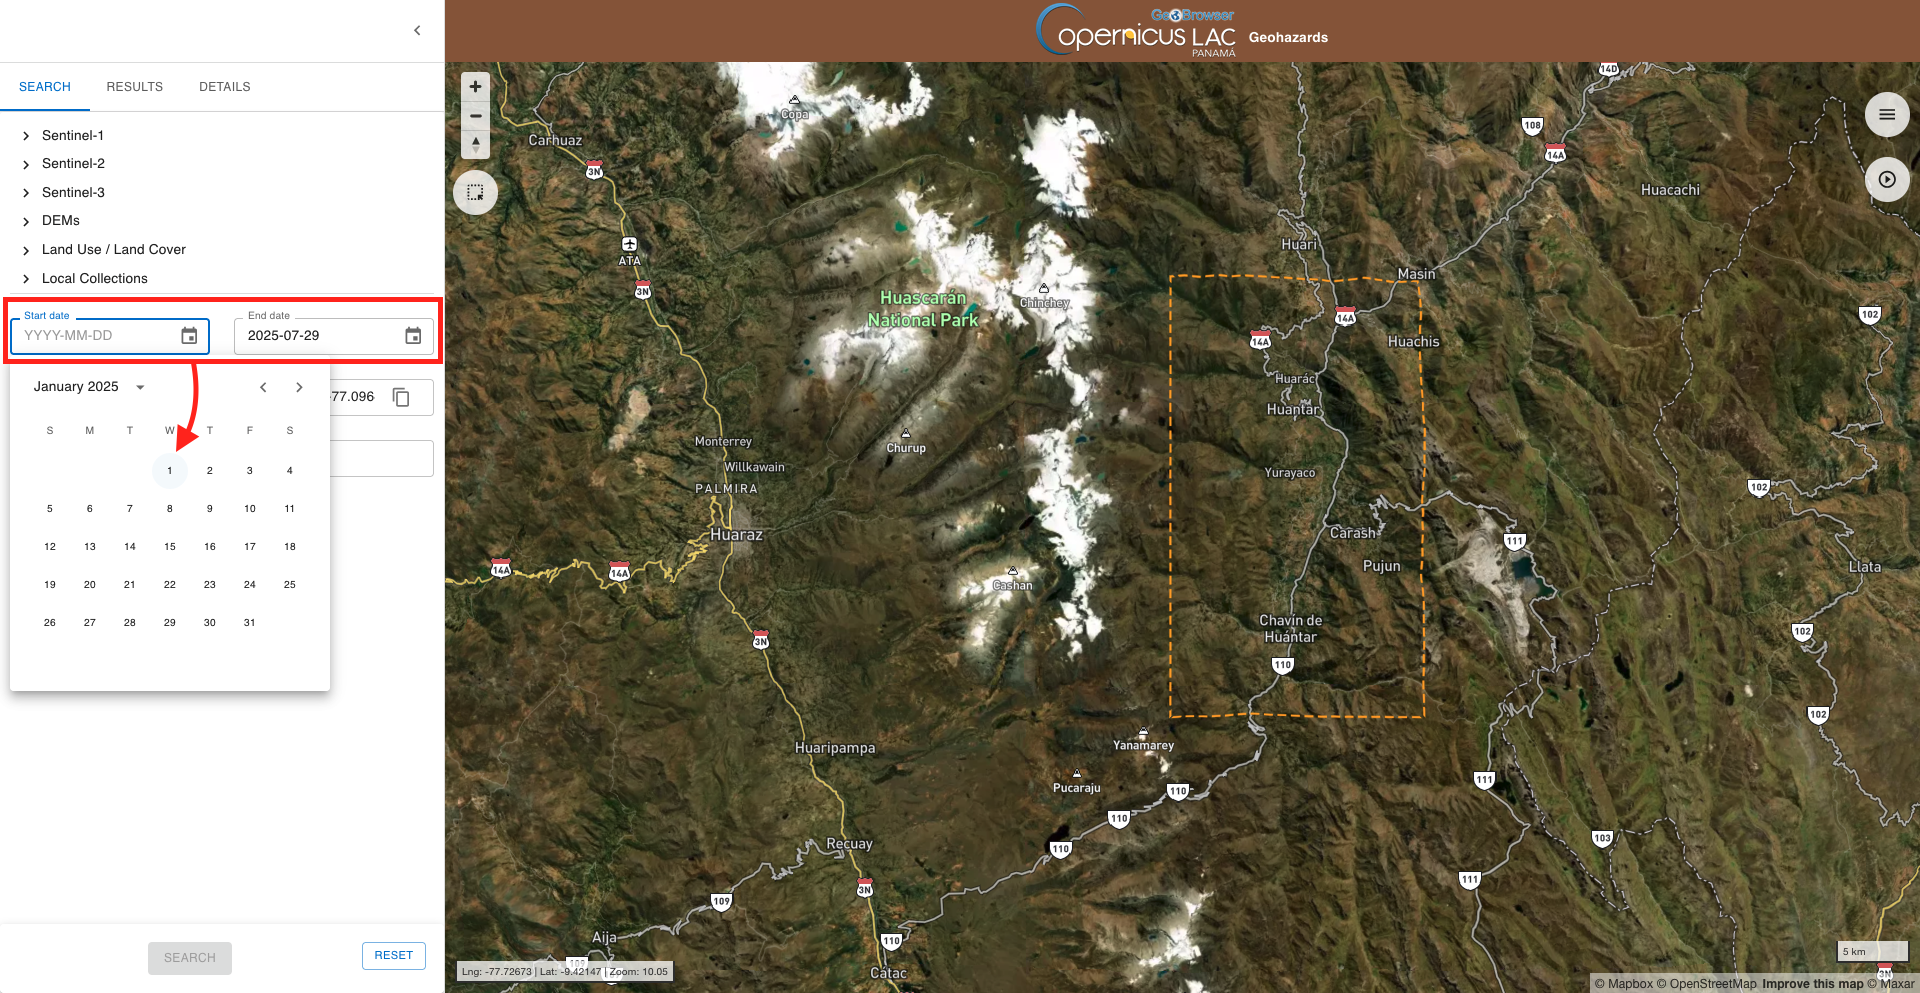
Hint
To remove a temporal filter in place click on RESET button.
Select the collection
Before employing you need to select a collection from the list available in the left panel. From the Search tab of the left panel select Geology maps available under Local collections.
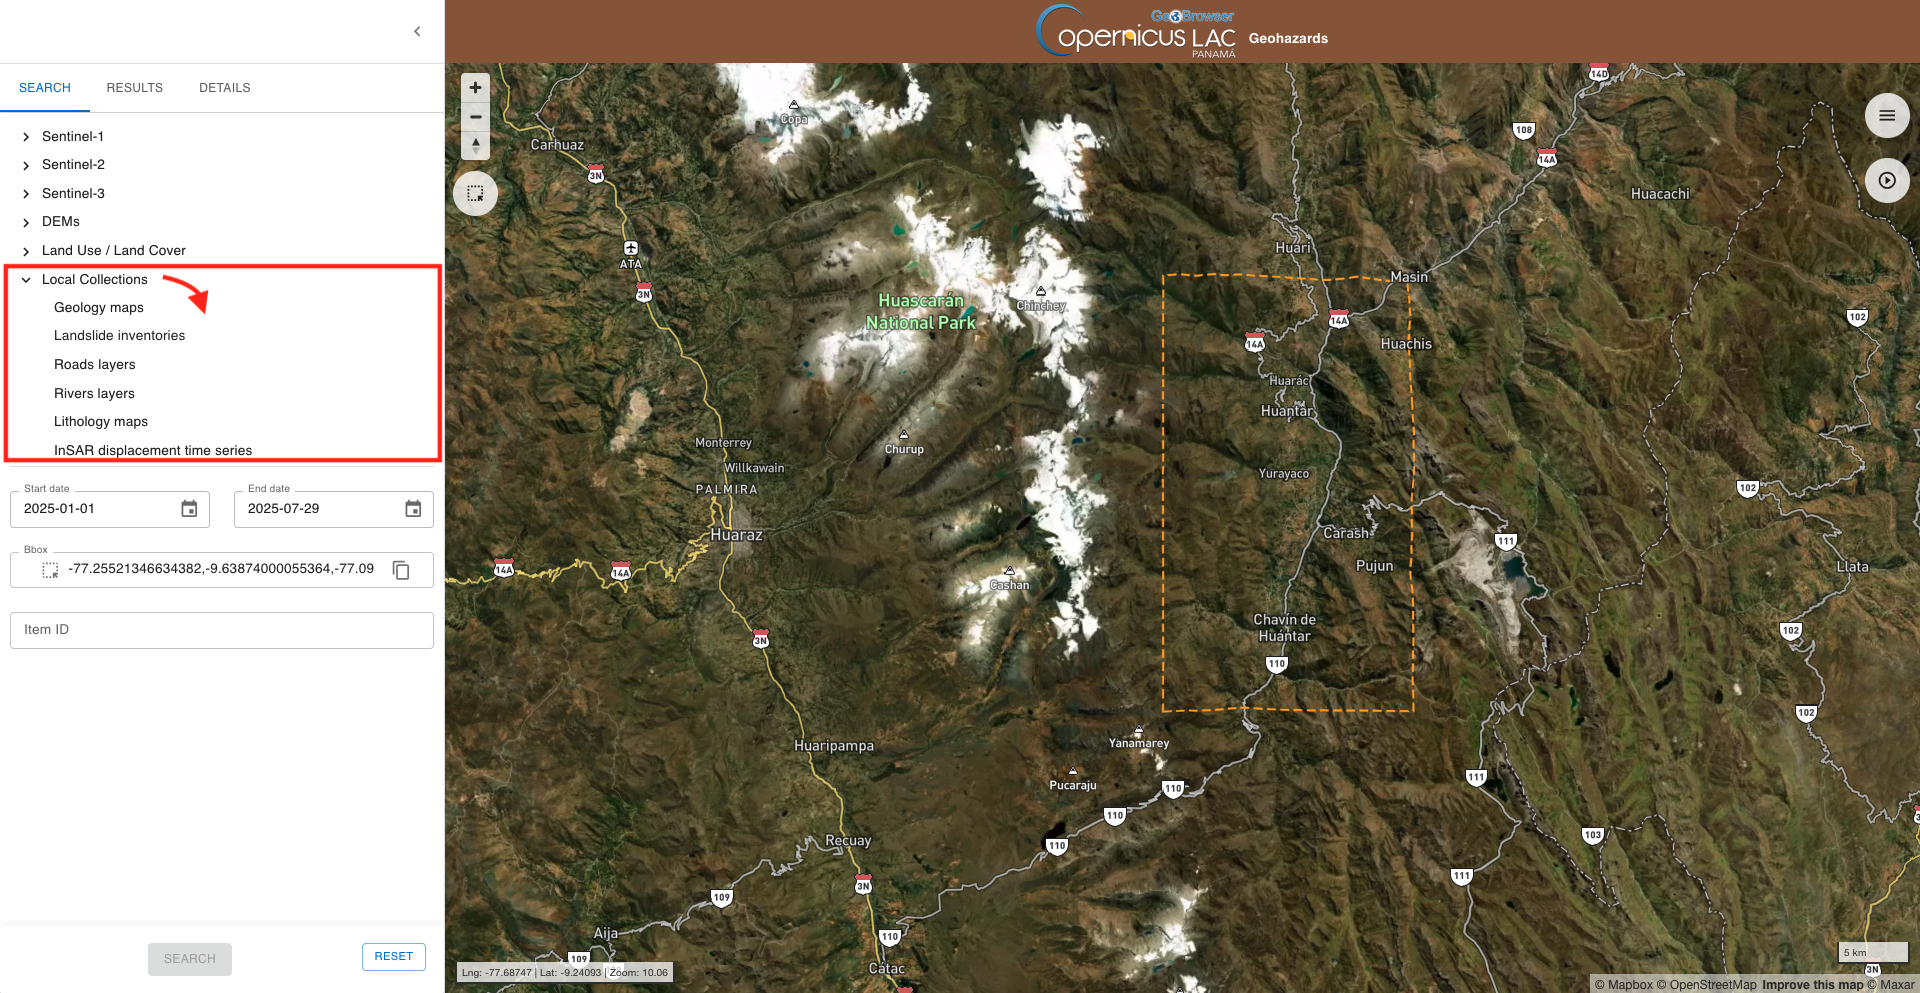
Warning
You can select only one collection from the list.
Search and find results
Once all desired filters are in place you can employ the search by clicking on the SEARCH button located at the bottom of the Search tab of the left panel.
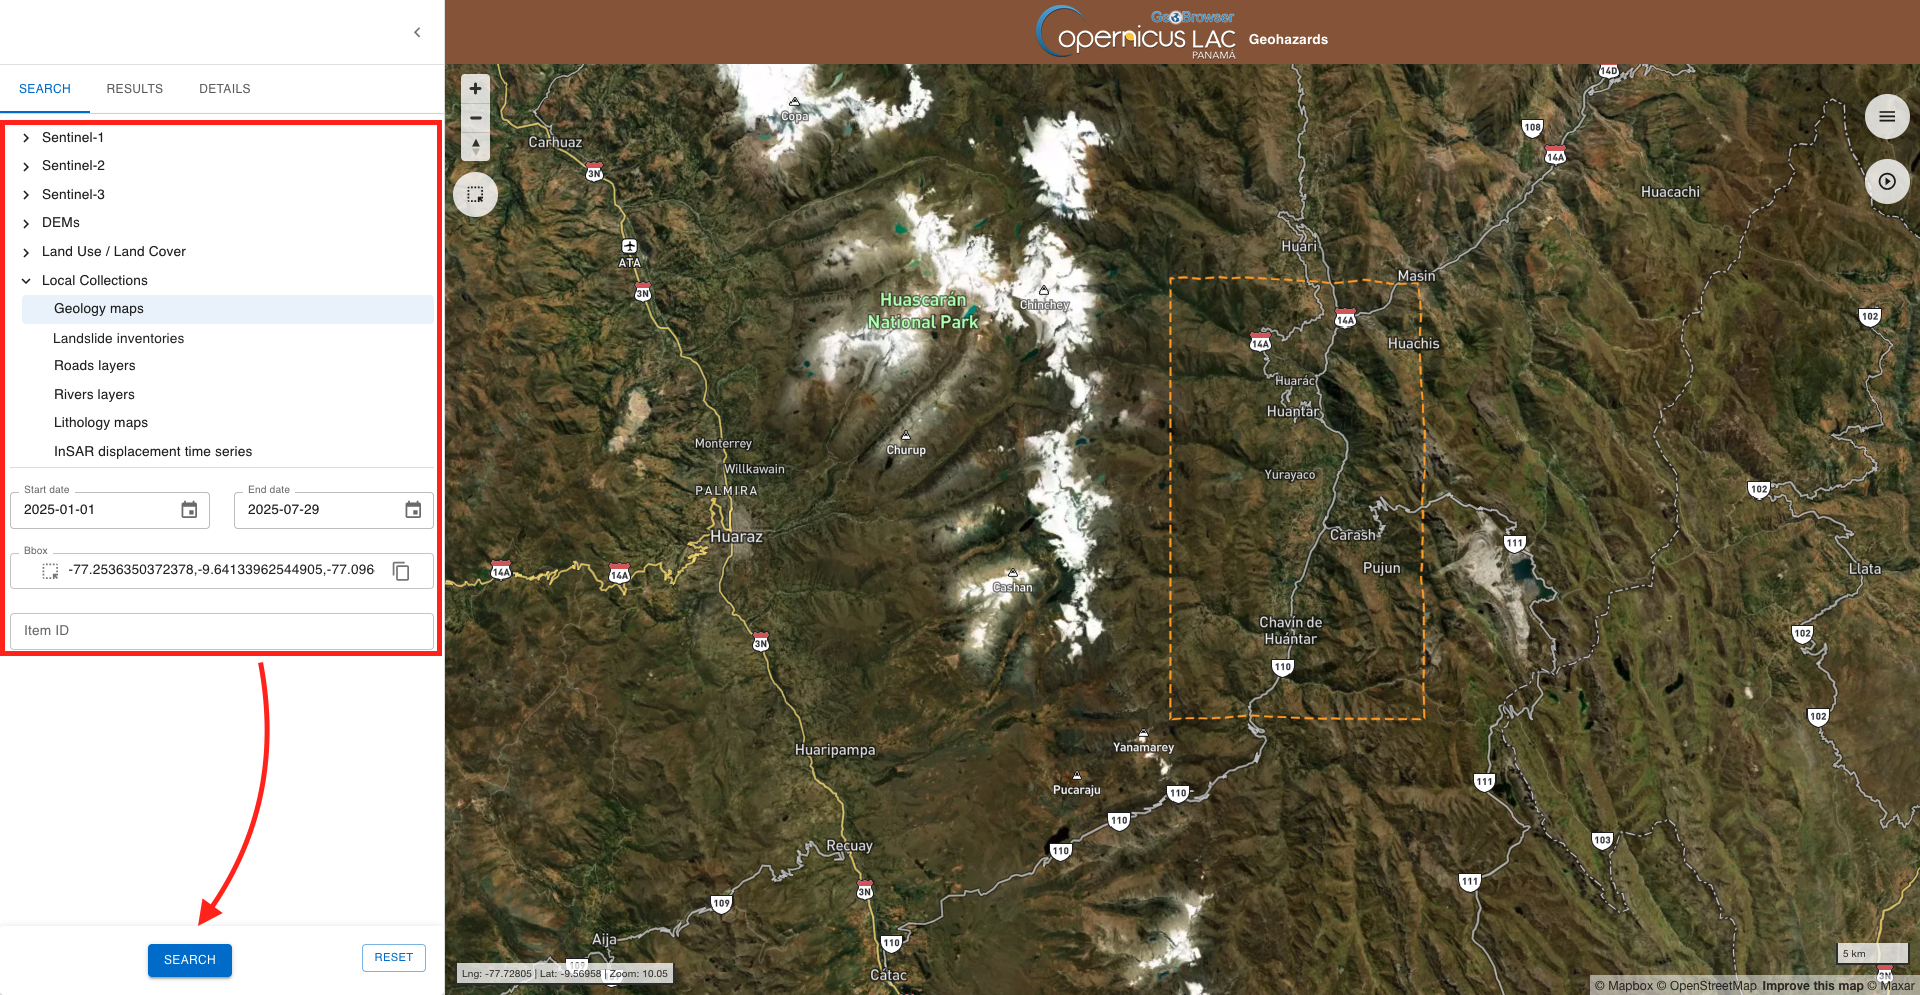
Warning
You cannot employ a search without selecting a collection from the list.
After that the left panel will automatically switch to the Search tab showing the result of your serach.
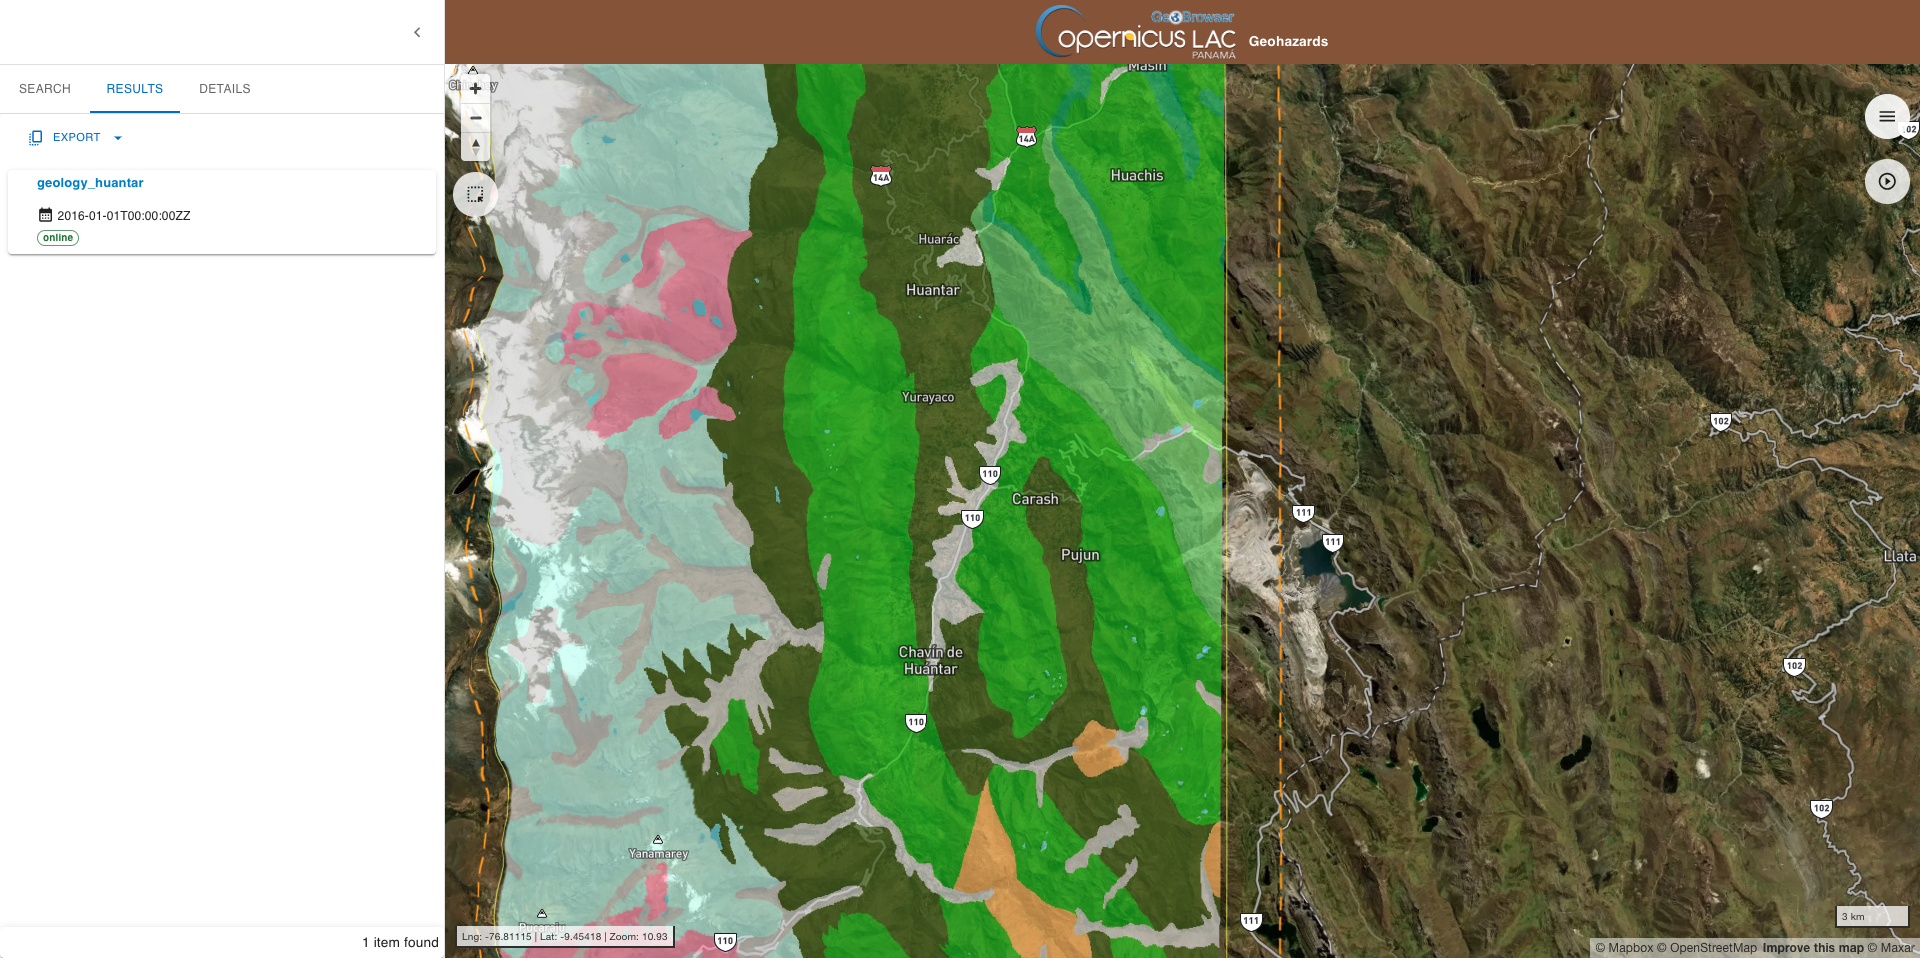
In this case the search made for the Geology maps collections is returning a single feature which is the only Geological map available in the catalog over Chavín de Huántar.
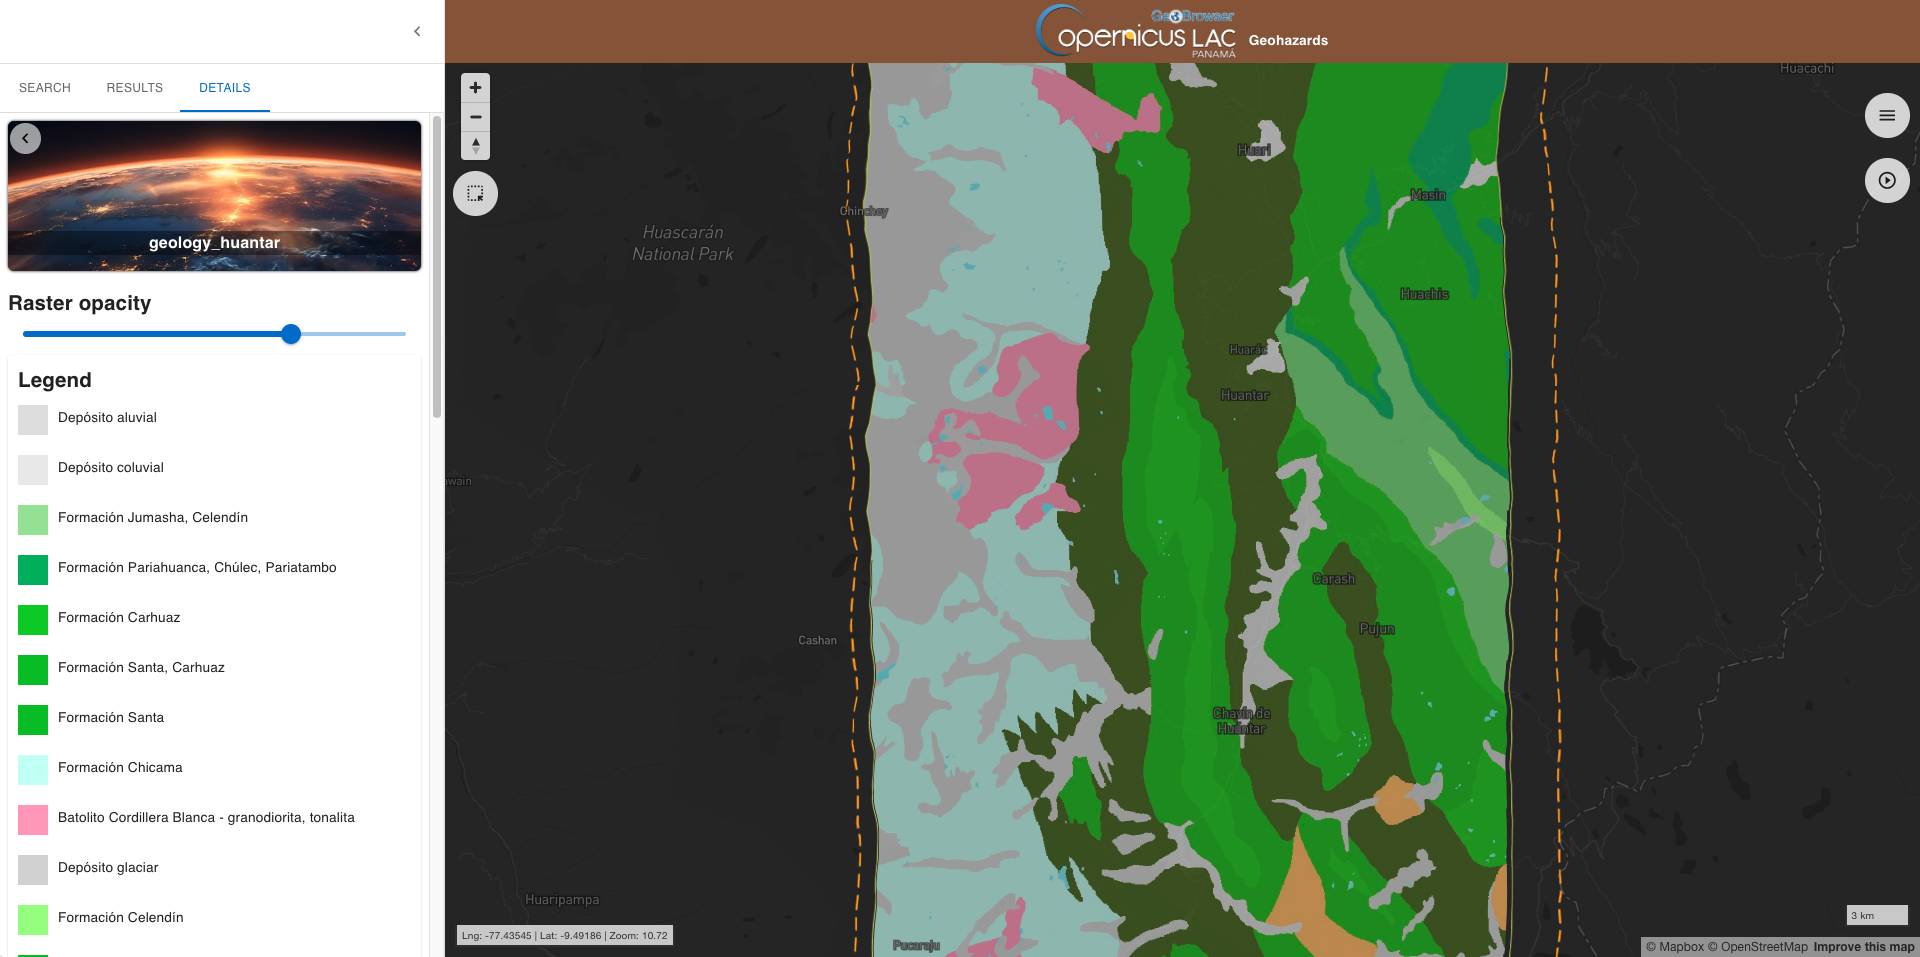
Hint
The legend is available on the left panel after a click on title of the feature. The legend of the geological map has multiple classes and thus you may need to employ the scrollbar when consulting it.
Note
The input geological map and the associated legend for the Huantar site in Peru is derived from the Instituto Geologico, Minero y Metalurgico INGEMMET.
Repeat the search for the following other layers available under Local collections:
- Landslide inventories
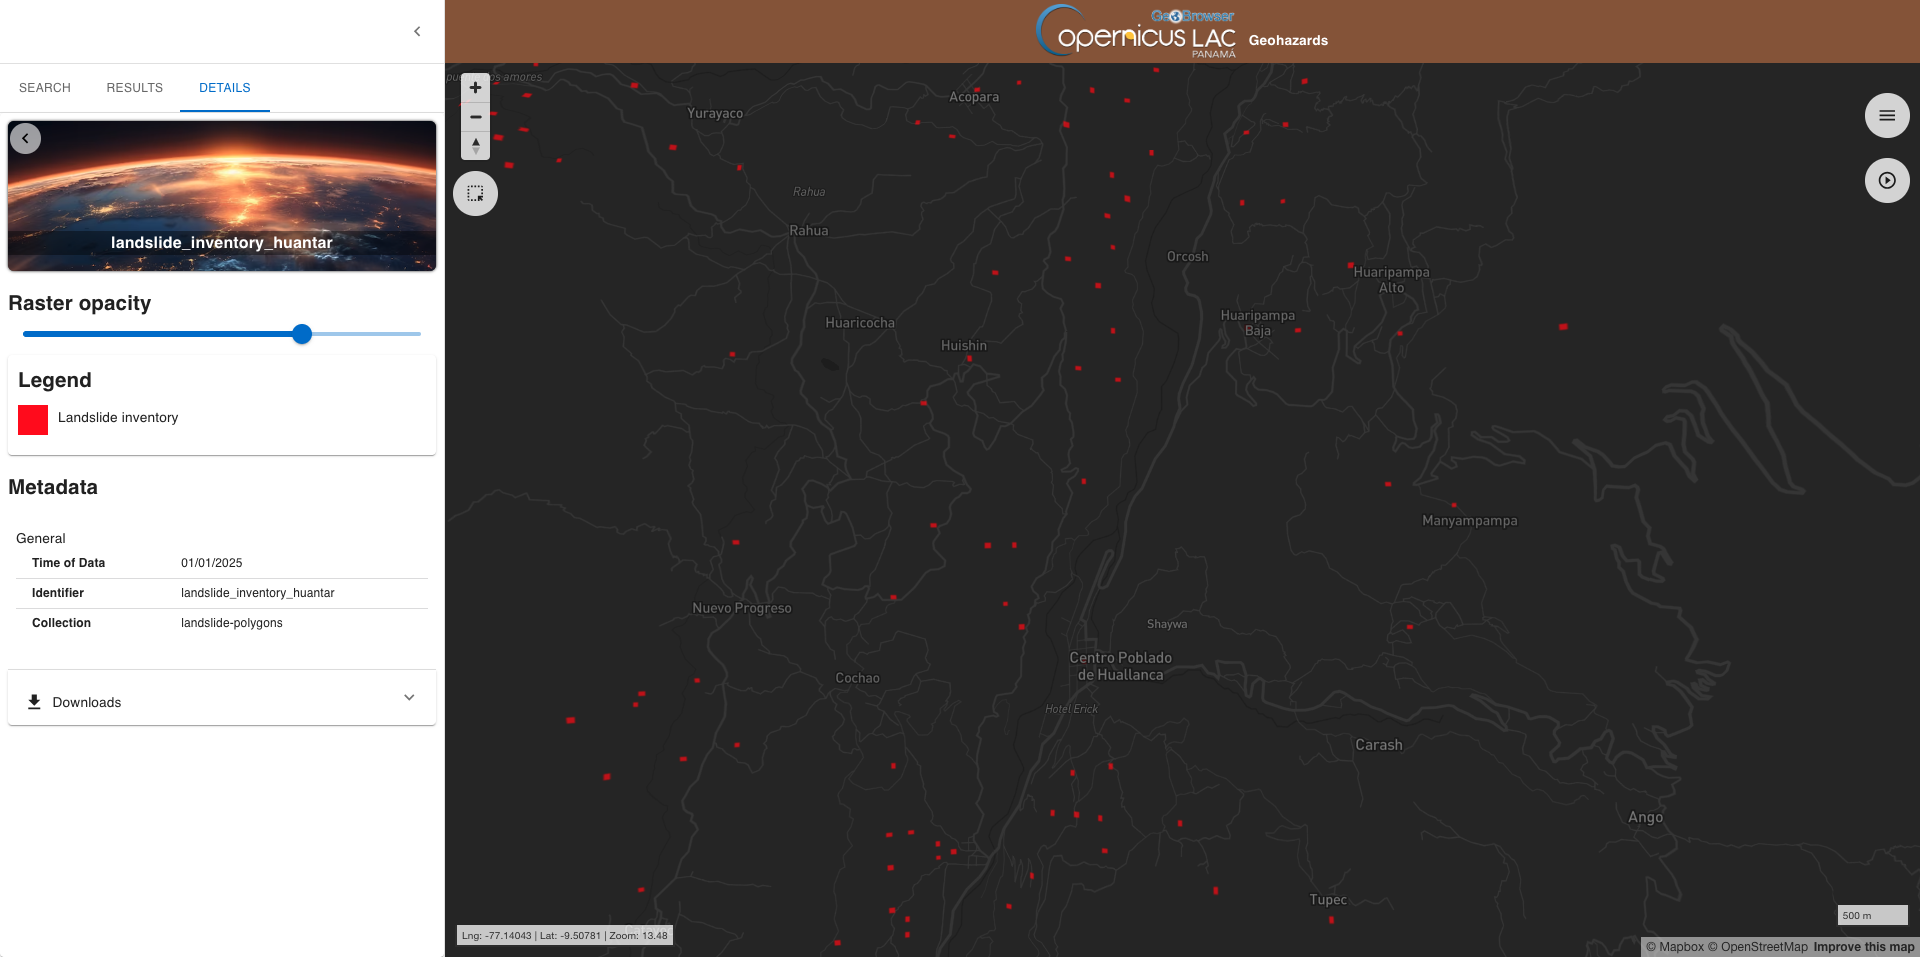
Hint
To better view the landslide inventory product employ the Dark basemap from the dedicated panel on the top right of the UI.
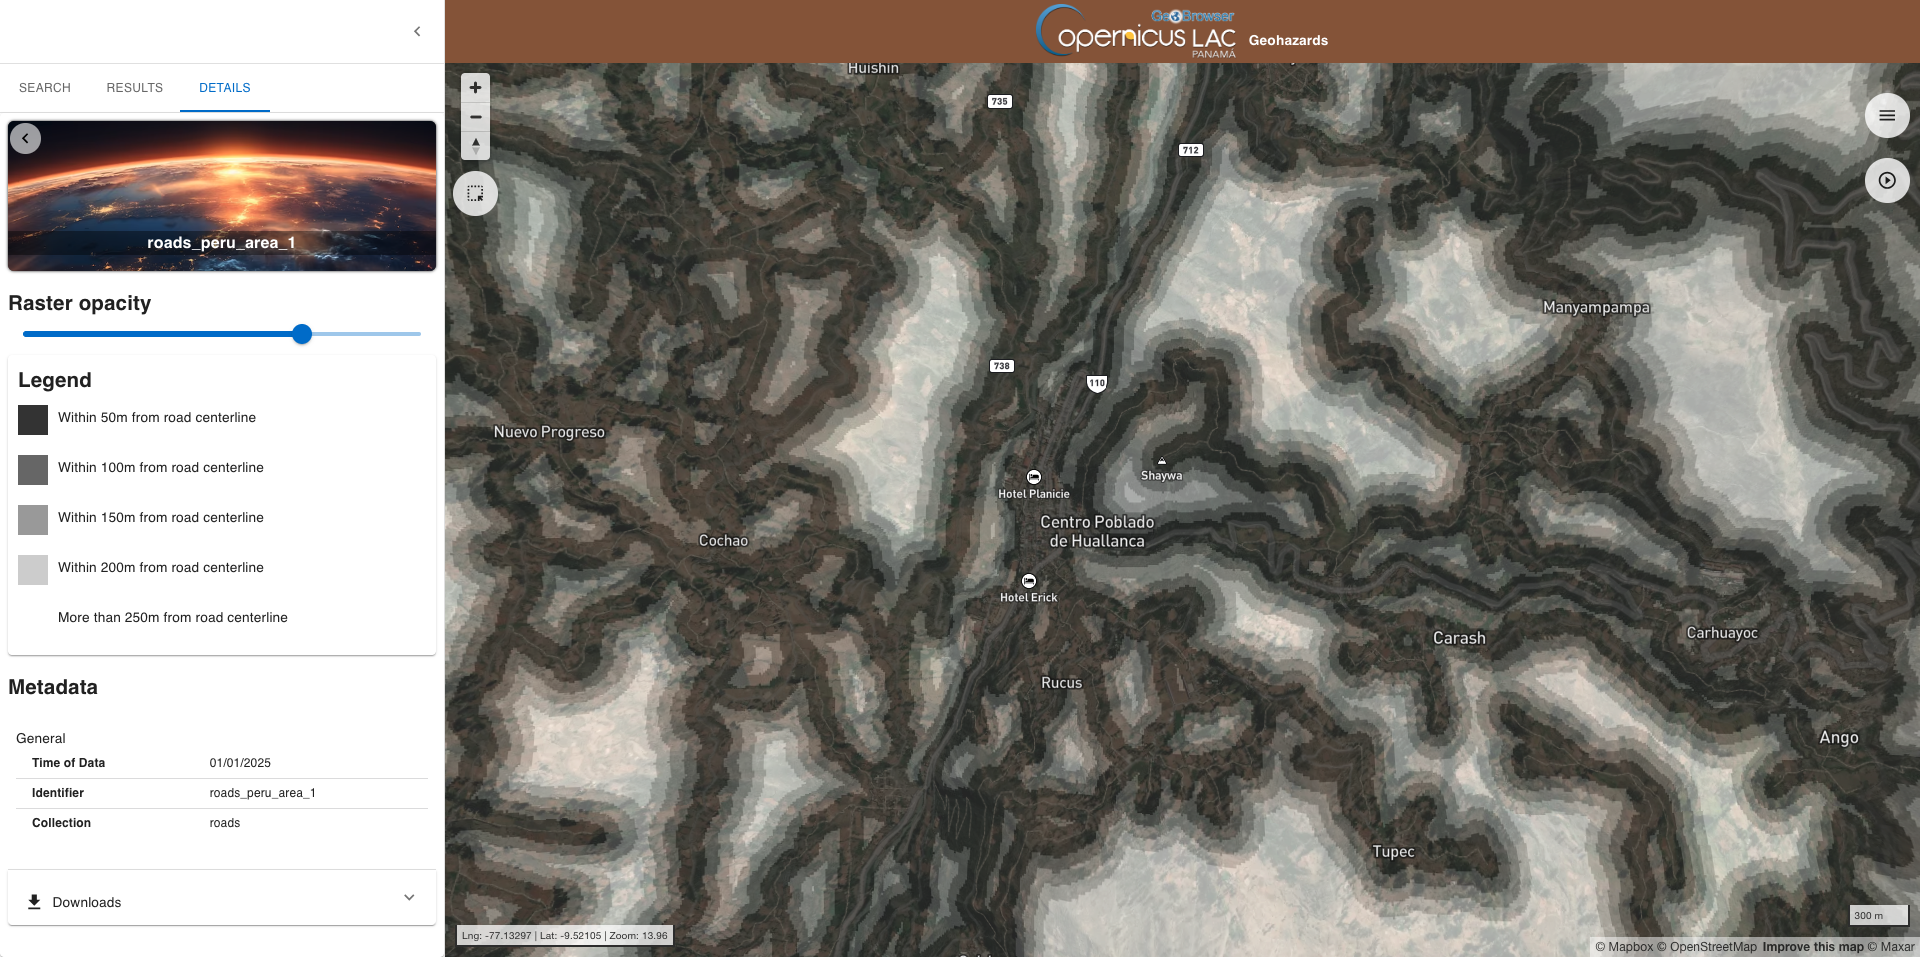
- Roads layers
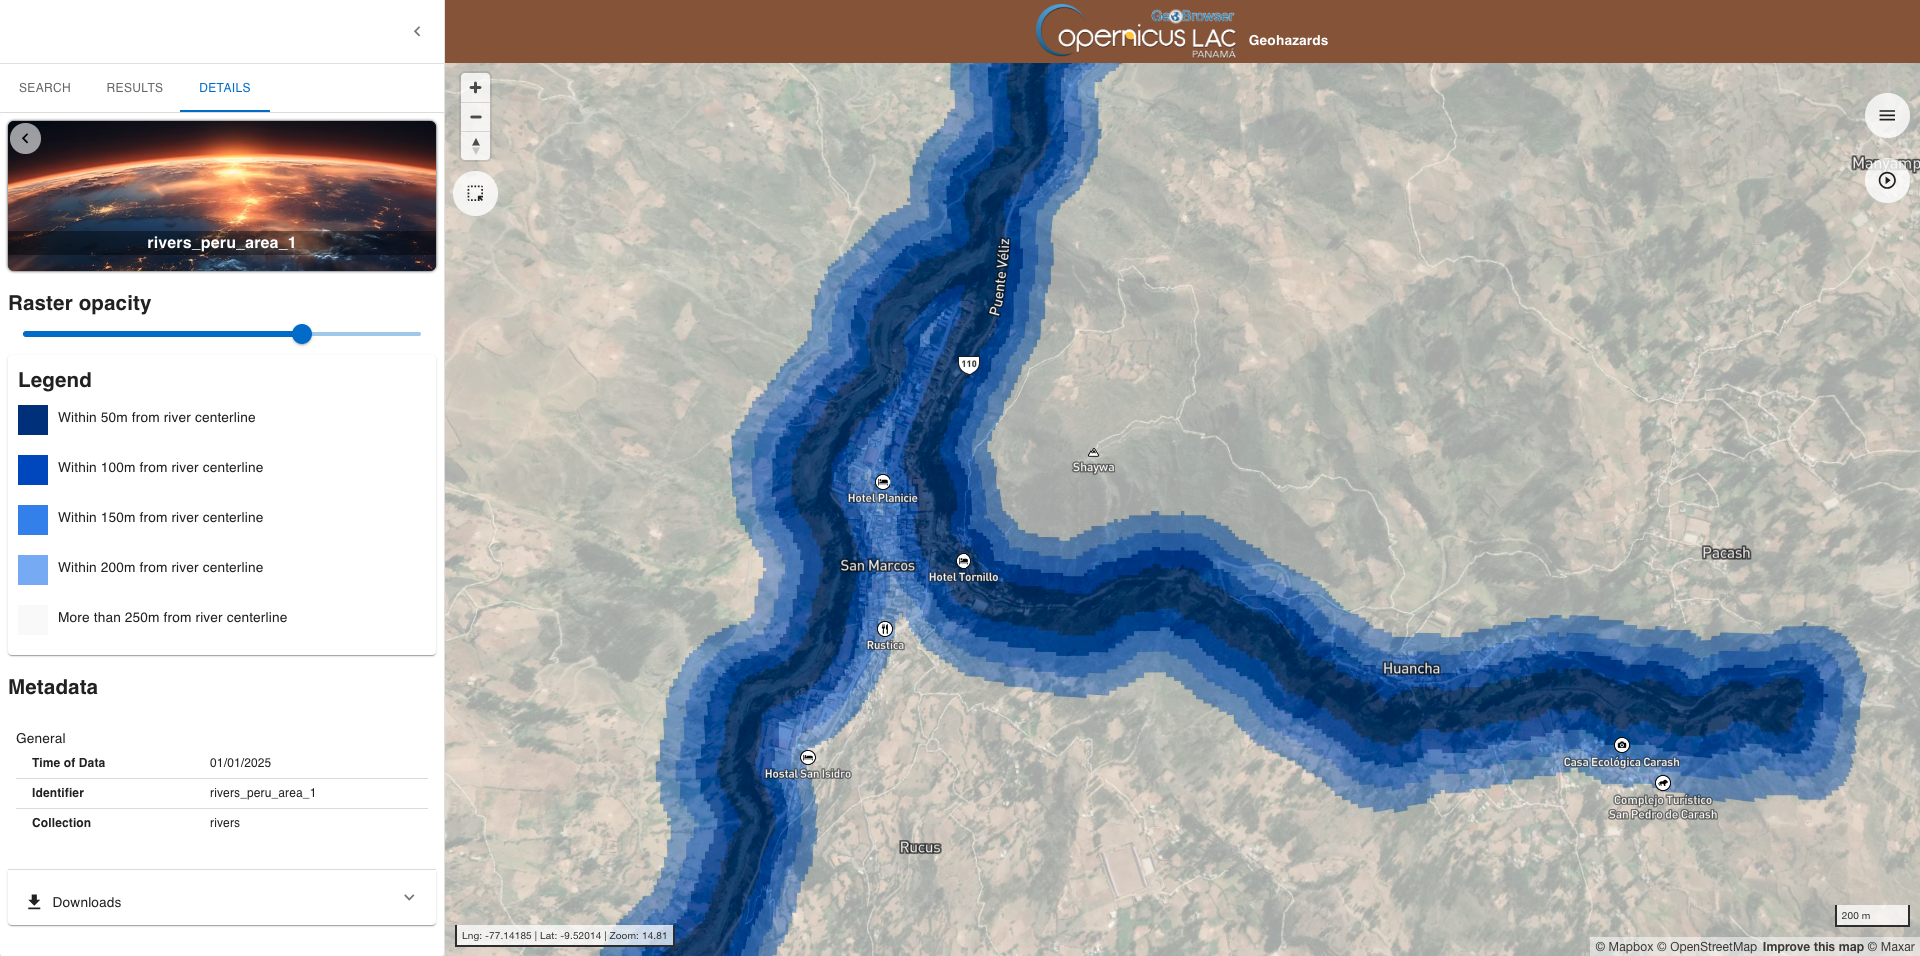
- Rivers layers
- Lithology maps
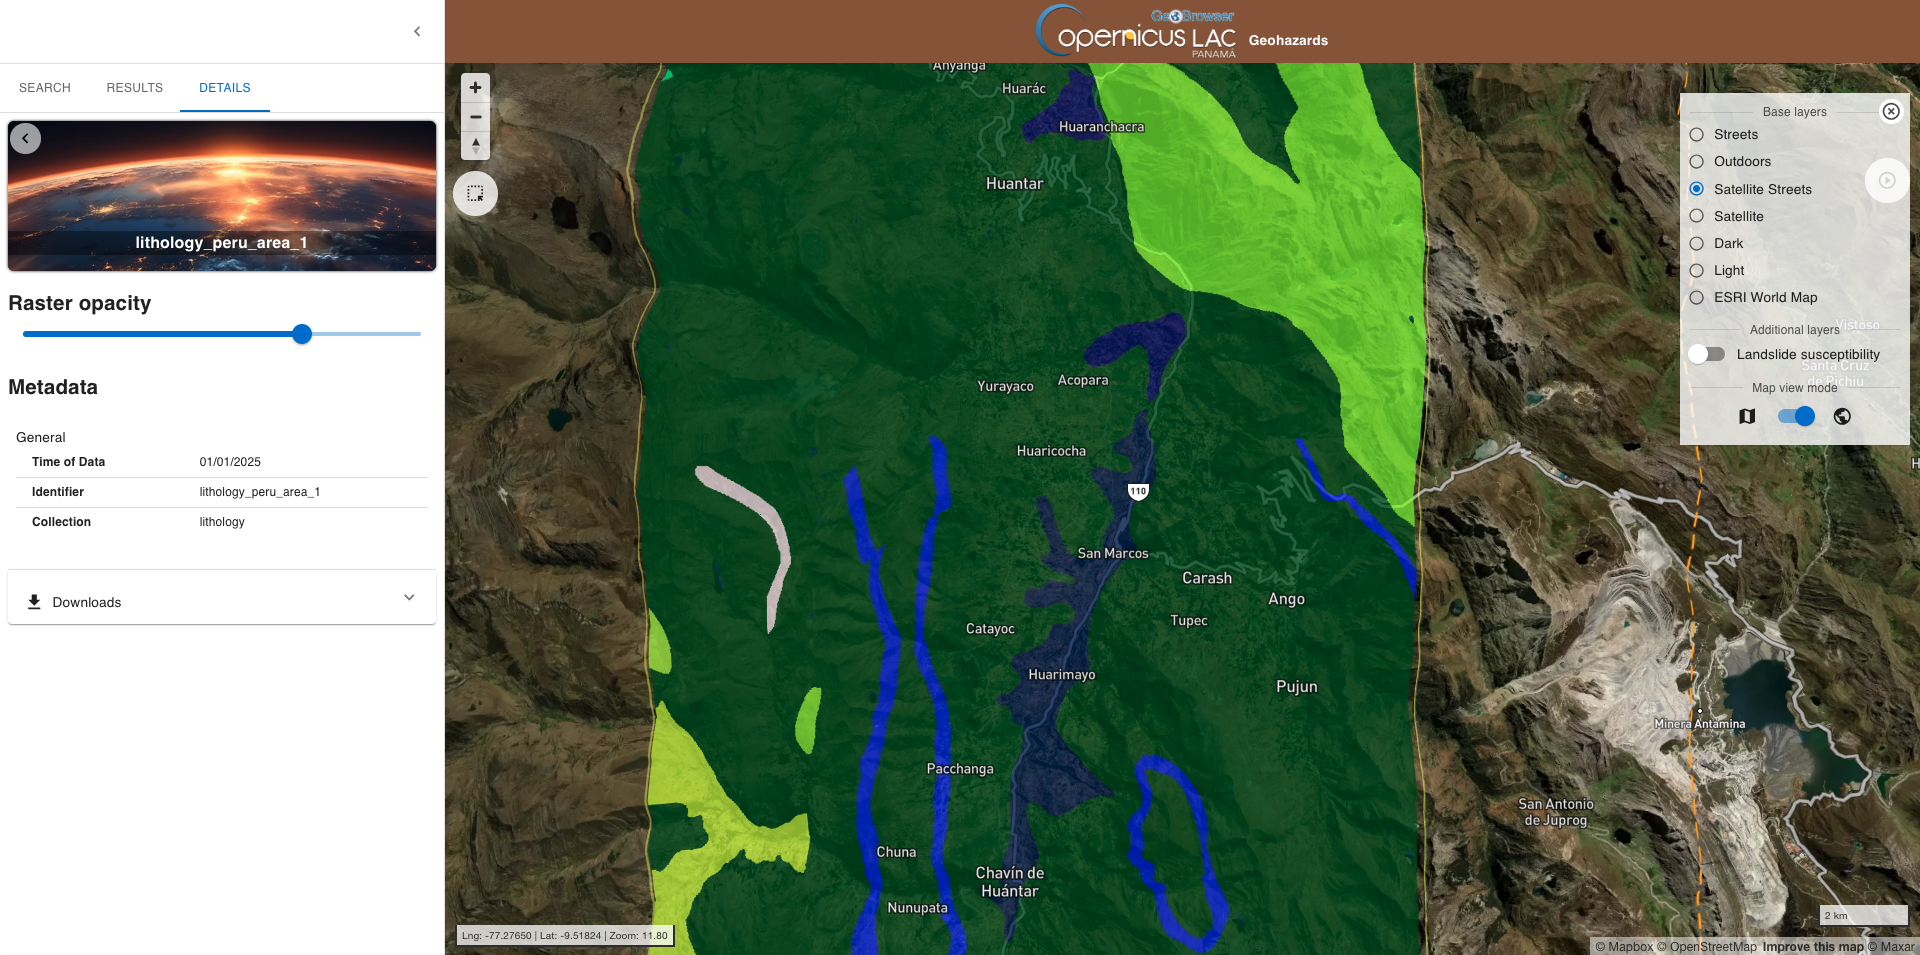
by maintaining the same spatial and temporal filters and clicking again on the SEARCH button. You will find a single feature for each collection available over this area within this temporal range.
Warning
Please note that both the landslide inventory and the geological layer are mandatory. The LSHM service will not execute without these two input layers.
Now let's search for InSAR products available over this area. Remove the temporal filter by manually deleting the dates under Start and End, select InSAR displacement time series as collection and click on Search. In this case the search is returning 4 features from InSAR processing results available in the catalog over this area.
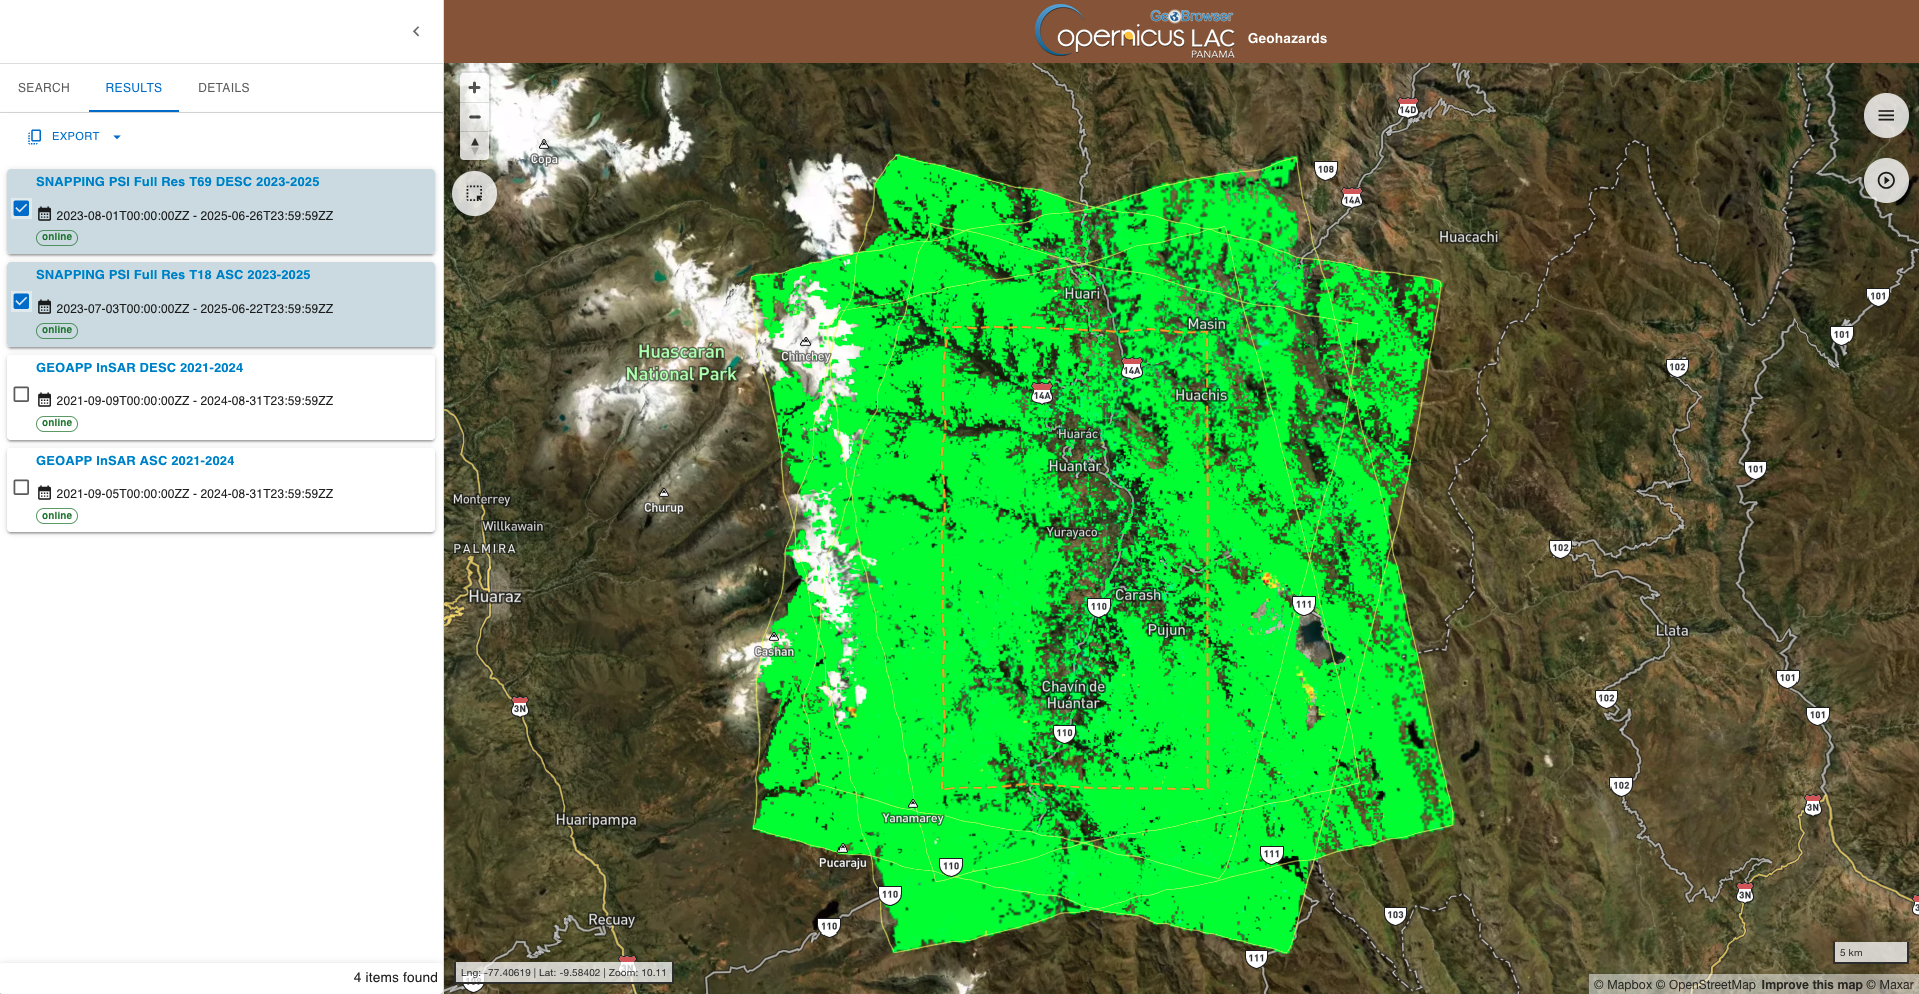
The first two features from the list:
-
SNAPPING PSI Full Res T69 DESC 2023-2025, 2023-08-01T00:00:00Z - 2025-06-26T23:59:59Z -
SNAPPING PSI Full Res T18 ASC 2023-2025, 2023-07-03T00:00:00Z - 2025-06-22T23:59:59Z
are the ones derived with the SNAPPING service that will be used for processing in this tutorial.
Now that you have identified all required input datasets you can submit your on-demand job.
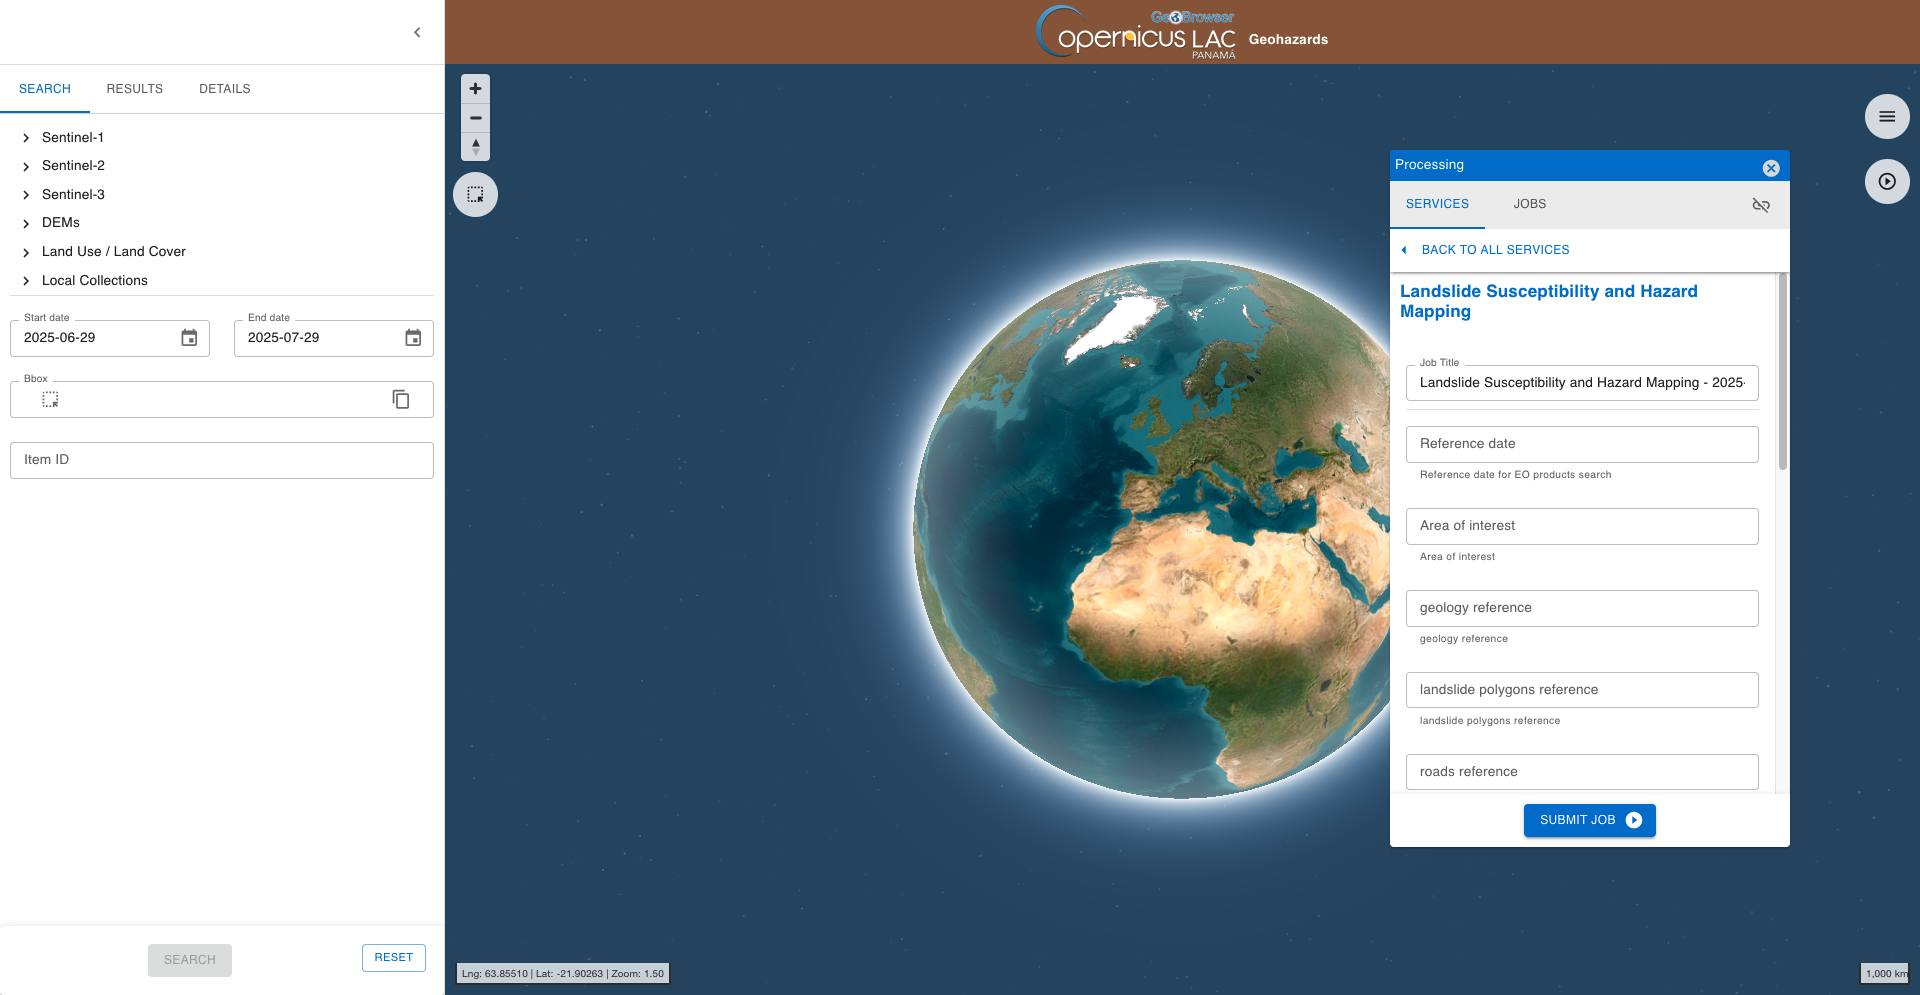
Fill the parameters
Access the Landslide Susceptibility and Hazard Mapping (LSHM) service form and then fill-in the parameters as described in the following sections.
Hint
In case you can't find anymore the LSHM service form:
-
open the Processing panel by clicking on the button on the top right of the map,
-
find the LSHM service from the list of services,
-
click on the button next to it,
-
and then click on the GO TO SERVICE FORM button.
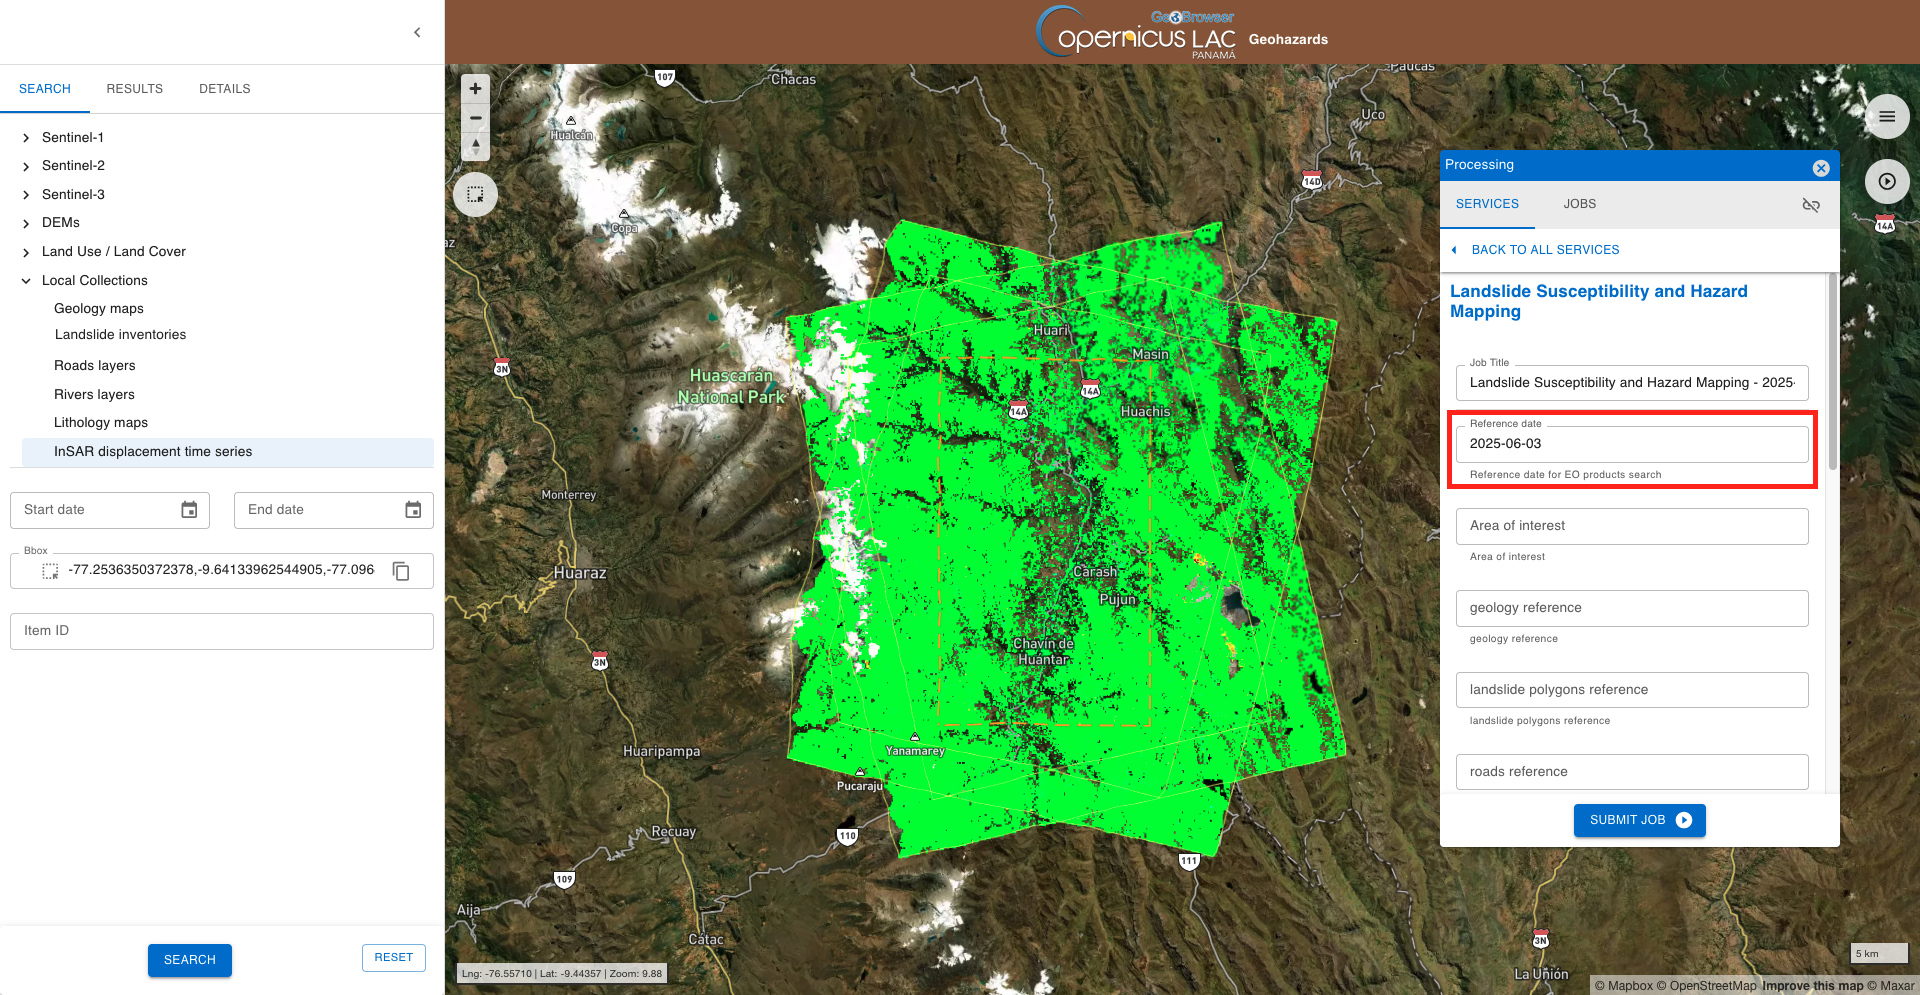
Reference date
In the first parameter you must specify the date to be used for the search of Sentinel-2 data needed to estimate NDVI.
If you plan to employ InSAR data in the LSHM service it is better to insert a date contained within the obseration period of InSAR products and falling around the end of this time period. The time period is shown from the Results panel by consulting the title or the metadata of the InSAR products.
For instance the SNAPPING ASC and DESC results available over this area are derived from Sentinel-1 data acquired between: 2023-07-03 - 2025-06-22. Thus insert for instance 2025-06-03 as reference date.
This date will be used by the system to find in the archive the Sentinel-2 L2A data acquired over the AOI within a 5-day period before the inserted date. If the AOI is intersecting more than a Sentinel-2 tile the service does the mosaicking of the tiles. The resulting Sentinel-2 L2A mosaic over the AOI will be used by the service to compute NDVI.
Warning
The date must be inserted in the form YYYY-MM-DD
Hint
If you plan to employ InSAR data in the LSHM service be sure that the inserted reference date for Sentinel-2 is within the SAR observation period. Insert for instance a date around end date of the input InSAR measurements.
Area of interest
In the second parameter you must insert the geometry of the AOI to be used by the service. This input geometry shall be given as string and in WKT format.
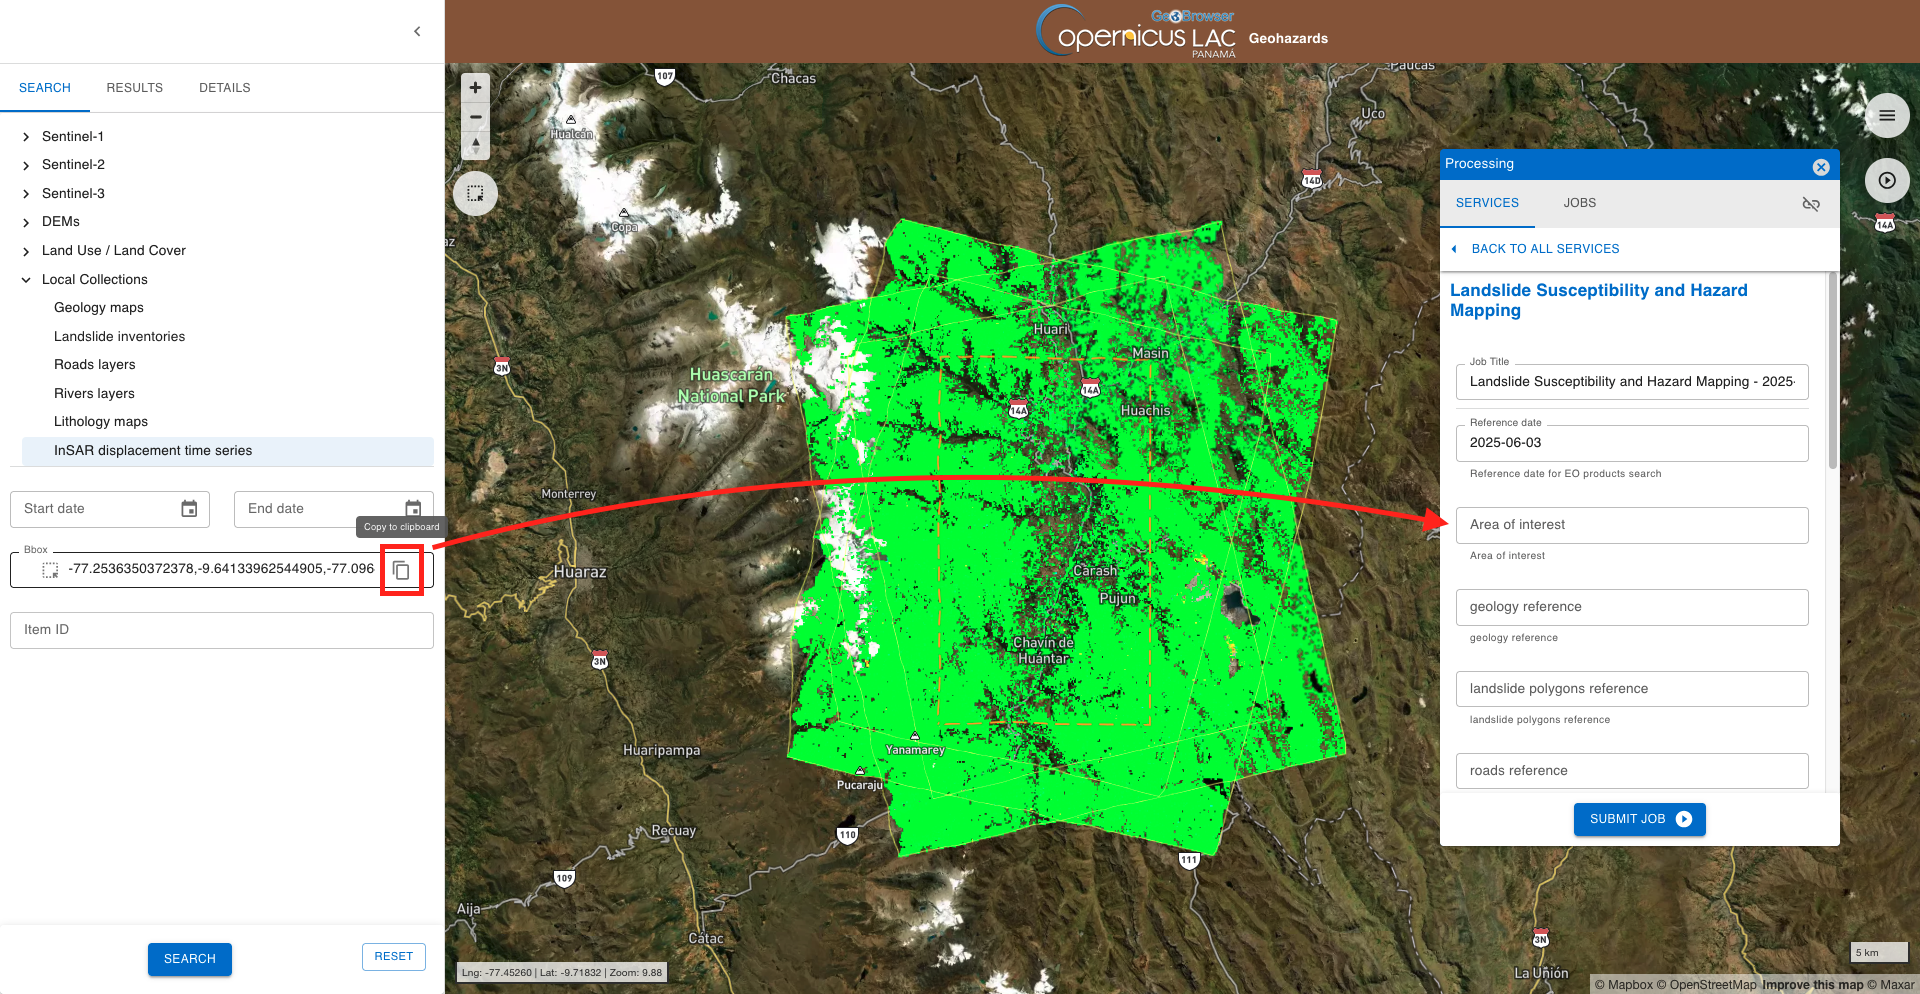
You can employ an AOI using the geometry defined with the spatial search widget. Once you insert an AOI with the spatial search, go to the Search panel and under the BBox field click on the icon to copy the WKT geometry in the clipboard and then paste it as value in the AOI parameter.
Insert as WKT value the following one:
POLYGON((-77.24409637398699 -9.632820143684455, -77.09770699966981 -9.632820143684455, -77.09770699966981 -9.371626647657138, -77.24409637398699 -9.371626647657138, -77.24409637398699 -9.632820143684455))
Warning
You must insert an AOI that is contained within the image footprint of all your data.
Geology map
In the third parameter you must insert a catalog reference to a geology map in raster format. This input shall be a discrete raster in GeoTIFF format providing all needed geology classes.
To easily fill-in the parameter, you can just employ the search from the Geological maps collection and retrieve required input products over the area from the Search panel as shown in the above section.
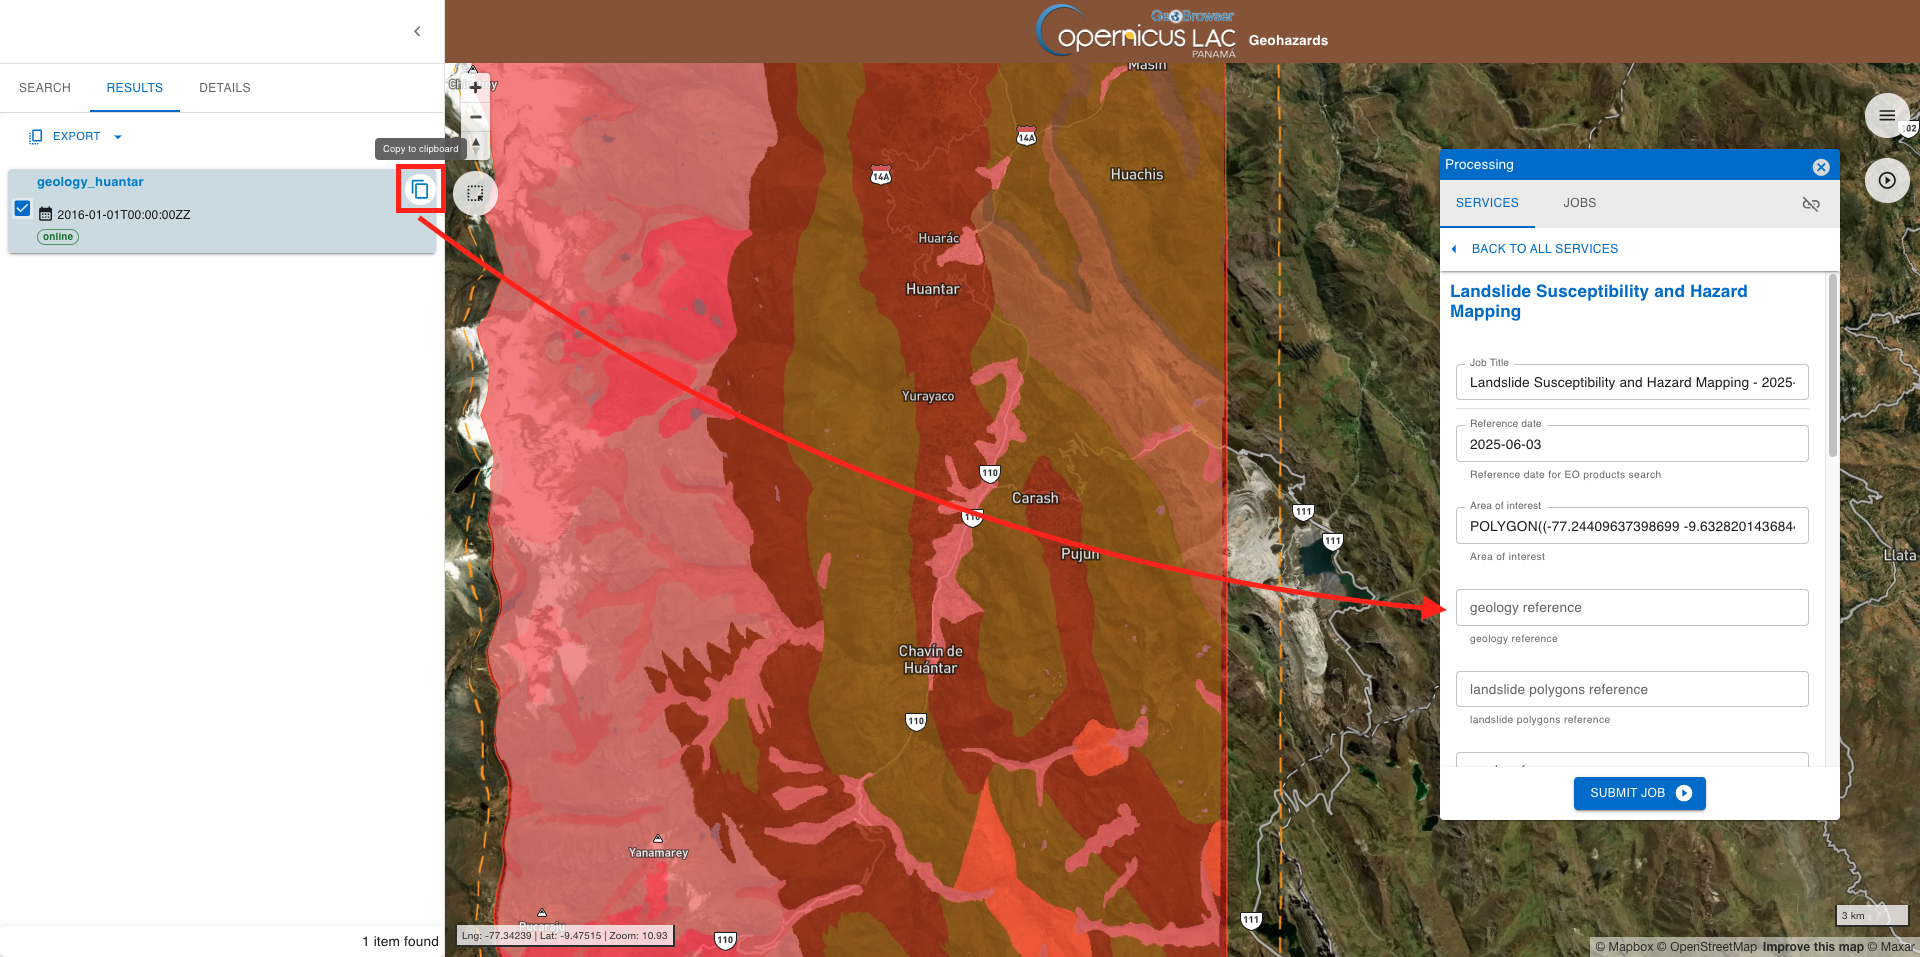
Once you find the product under the Results tab, select it and click on the icon to copy its catalog reference in the clipboard and then paste it in the Geology map parameter.
Landslide inventory
In the forth parameter you must insert a catalog reference to a landslide inventory in vector format. This input shall be a single point vector file in GeoJSON format providing multiple geolocations of historical landslides.
To easily fill-in the parameter, you can just employ the search from the Landslide inventories collection and retrieve required input products over the area from the Search panel as shown in the above section.
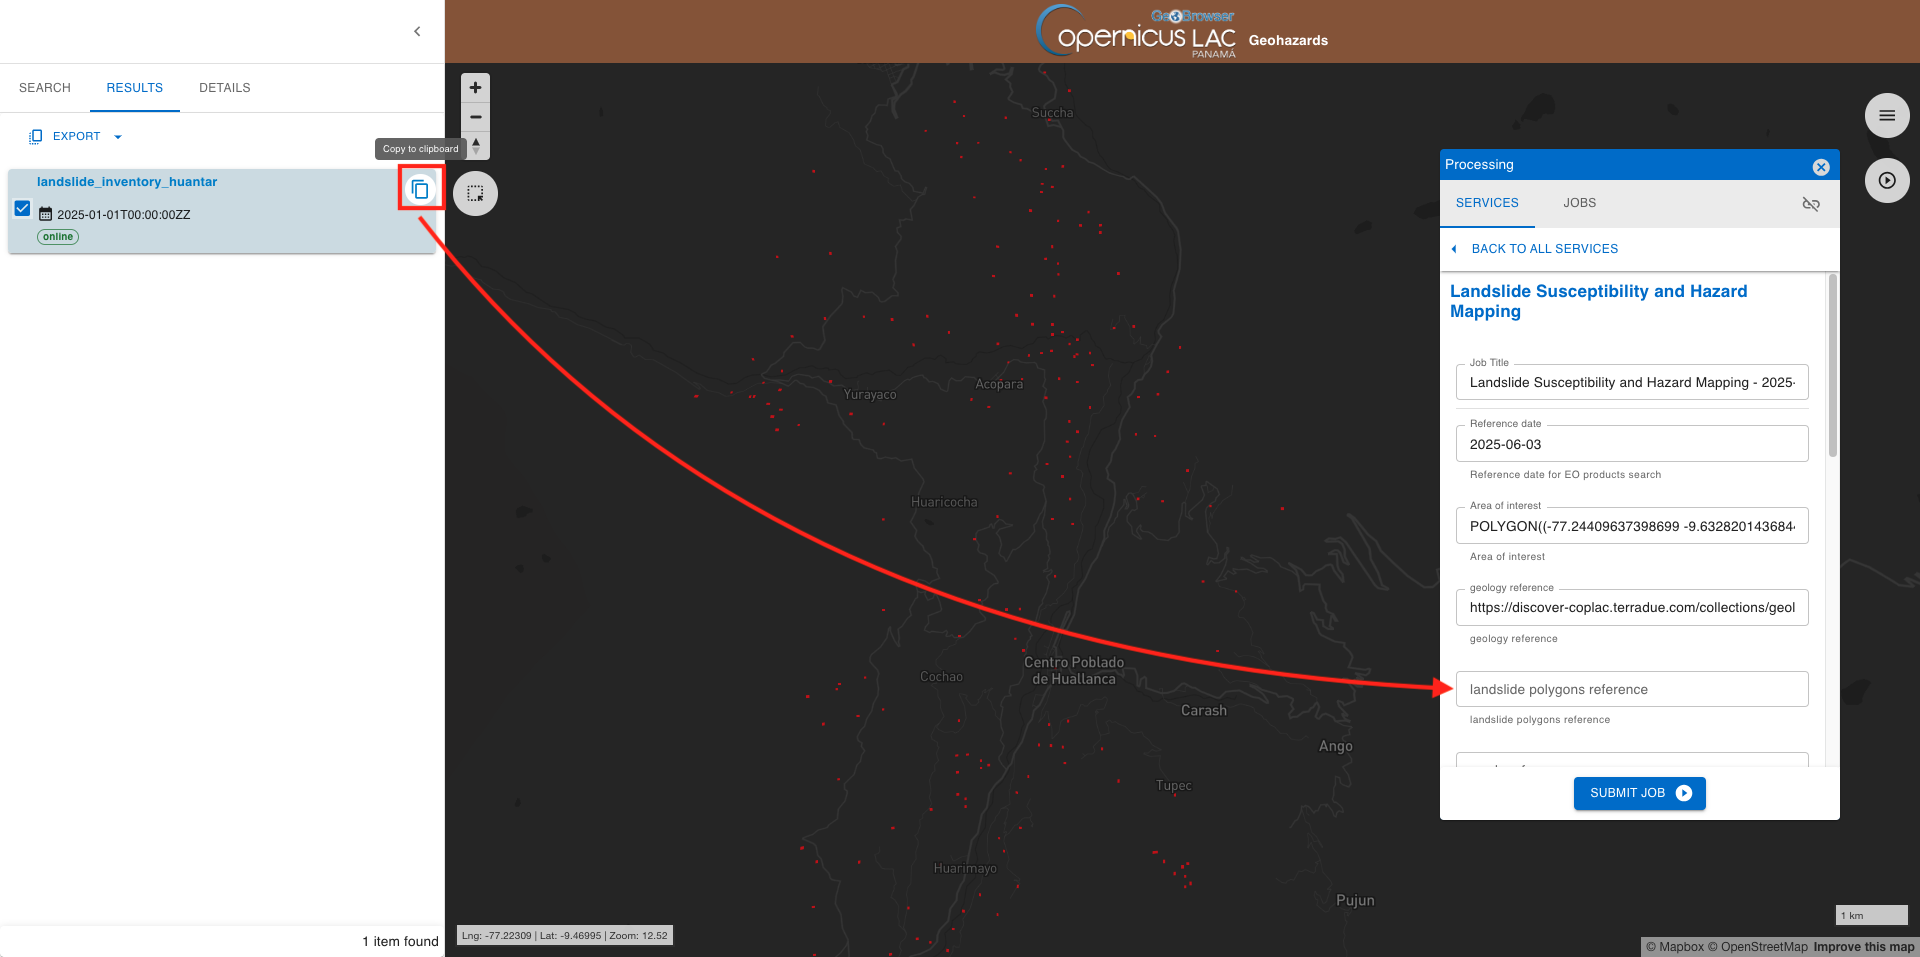
Once you find the product under the Results tab, select it and click on the icon to copy its catalog reference in the clipboard and then paste it in the Landslide inventory parameter.
Road network (optional)
In the fifth parameter you can insert a catalog reference to a binary raster representing the road network. This input shall be a single binary raster file (1 = road, 0 = background) in GeoTIFF format.
To easily fill-in the parameter, you can just employ the search from the Roads layers collection and retrieve required input products over the area from the Search panel as shown in the above section.
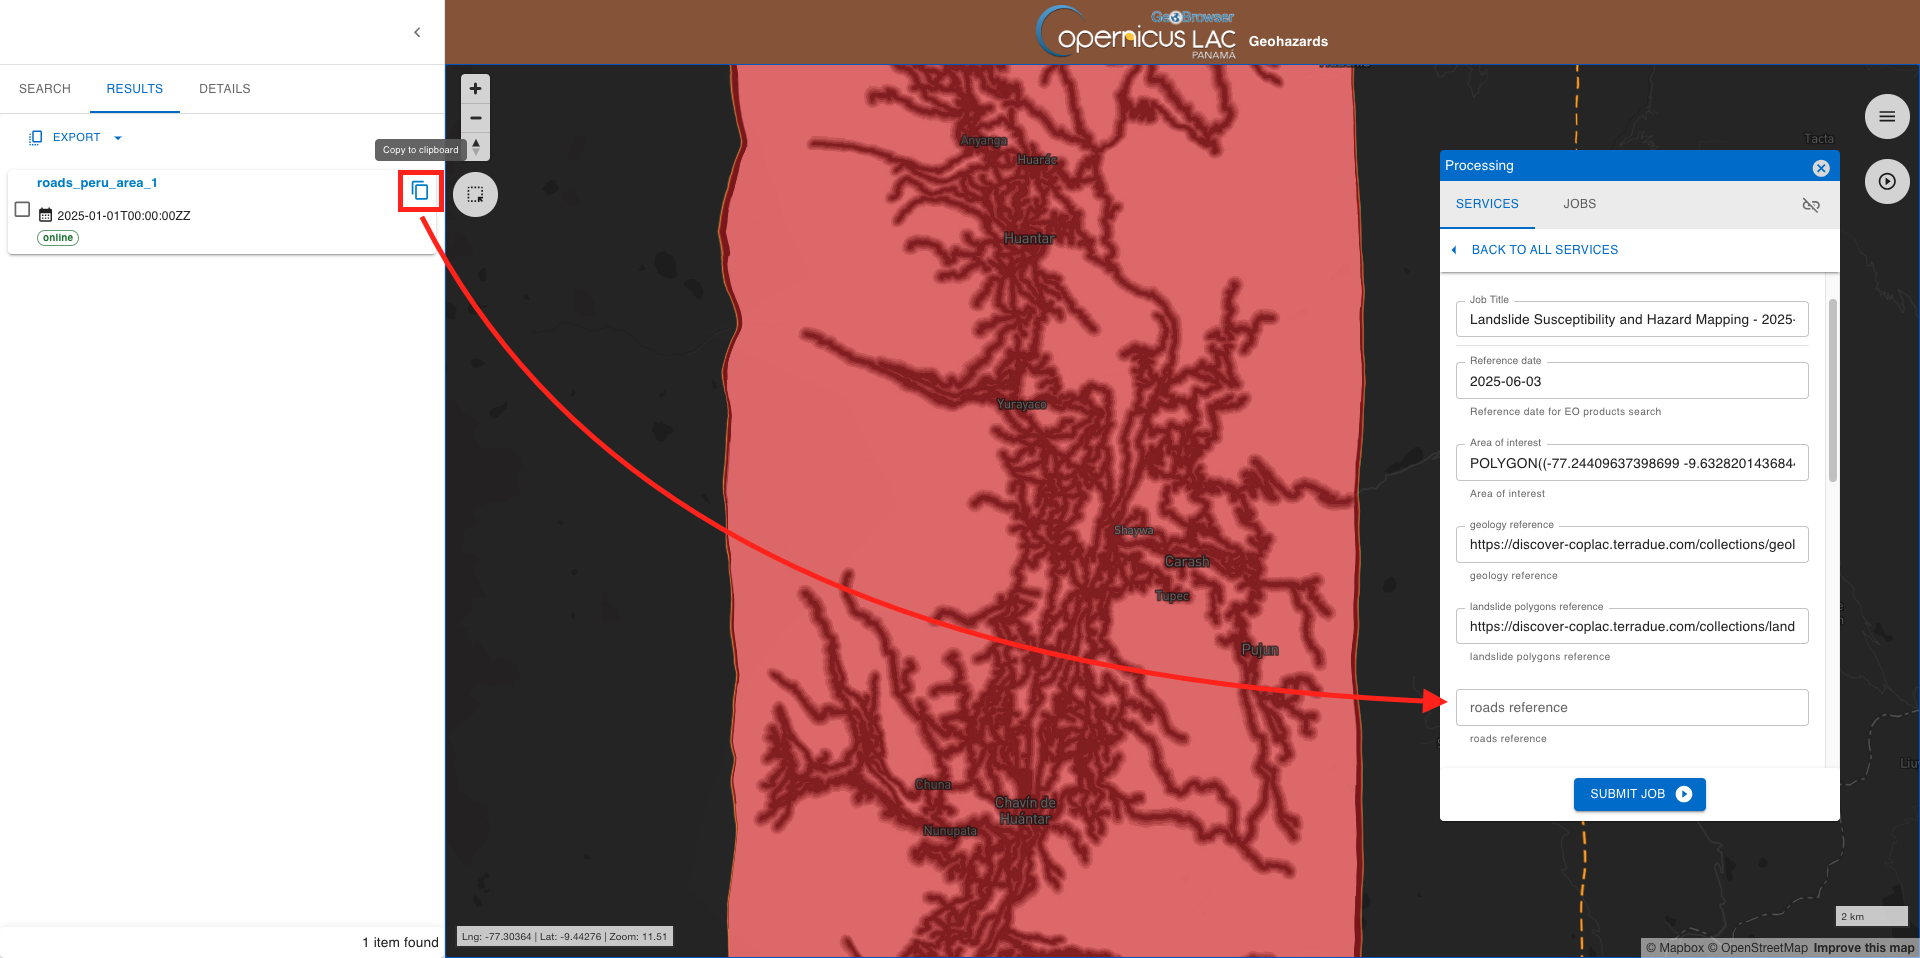
Once you find the product under the Results tab, select it and click on the icon to copy its catalog reference in the clipboard and then paste it as value for the present parameter.
River network (optional)
In the sixth parameter you can insert a catalog reference to a binary raster representing the river network. This input shall be a single binary raster file (1 = river, 0 = background) in GeoTIFF format.
To easily fill-in the parameter, you can just employ the search from the Rivers layers collection and retrieve required input products over the area from the Search panel as shown in the above section.
Once you find the product under the Results tab, select it and click on the icon to copy its catalog reference in the clipboard and then paste it as value for the present parameter.
Lithology map (optional)
In the seventh parameter you can insert a catalog reference to a Lithology map as a single raster. This input shall be a single band discrete raster file (providing all needed lithology classes) in GeoTIFF format.
To easily fill-in the parameter, you can just employ the search from the Lithology maps collection and retrieve required input products over the area from the Search panel as shown in the above section.
Once you find the product under the Results tab, select it and click on the icon to copy its catalog reference in the clipboard and then paste it as value for the present parameter.
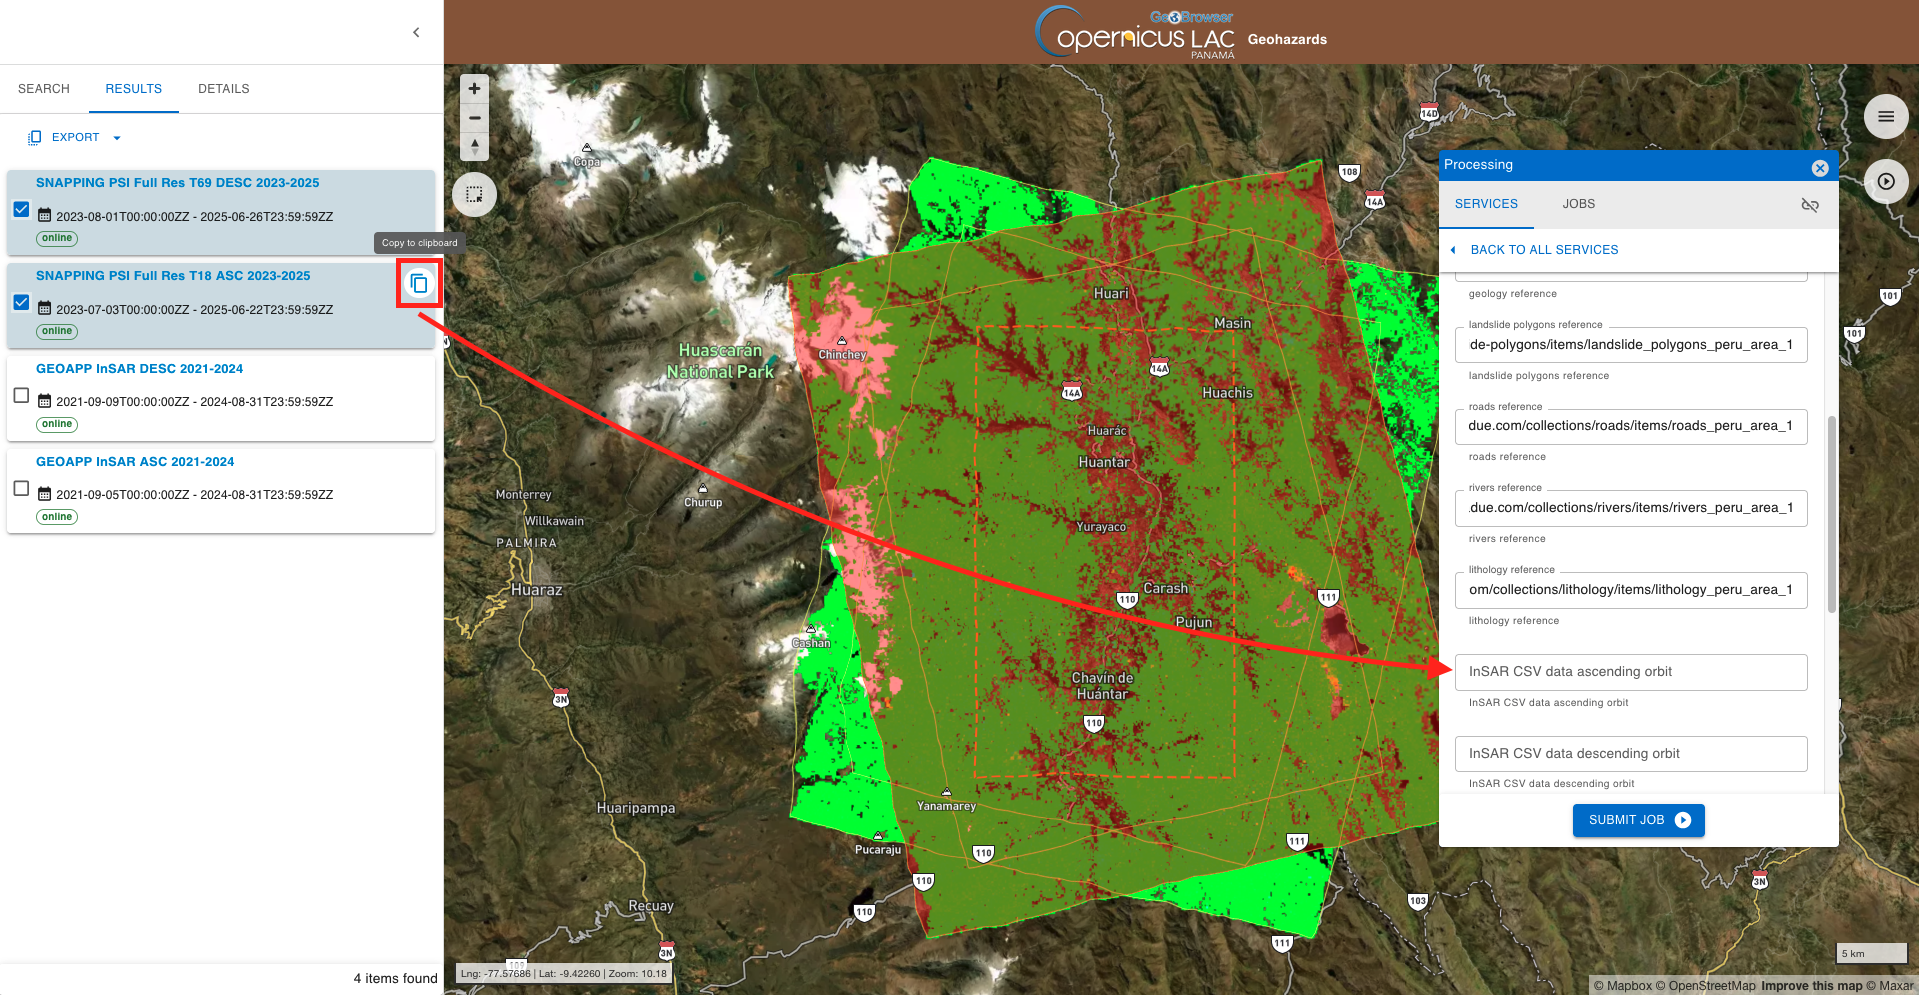
InSAR terrain motion ascending and descending (optional)
In the eightth and nineth optional parameters the user can specify the catalog reference to InSAR point measurements (as CSV files) providing average velocity in mm/year derived from ascending and descending passes.
To easily fill-in the parameter, you can just employ the search from the InSAR Displacement Time Series collection and retrieve the available InSAR products available over the area from the Search panel as shown in the above section.
Once you retrieve the input pair of products under the Results tab, select one by one and click on the icon to copy its catalog reference in the clipboard and then paste it as value for the corresponding ASC or DESC parameters.
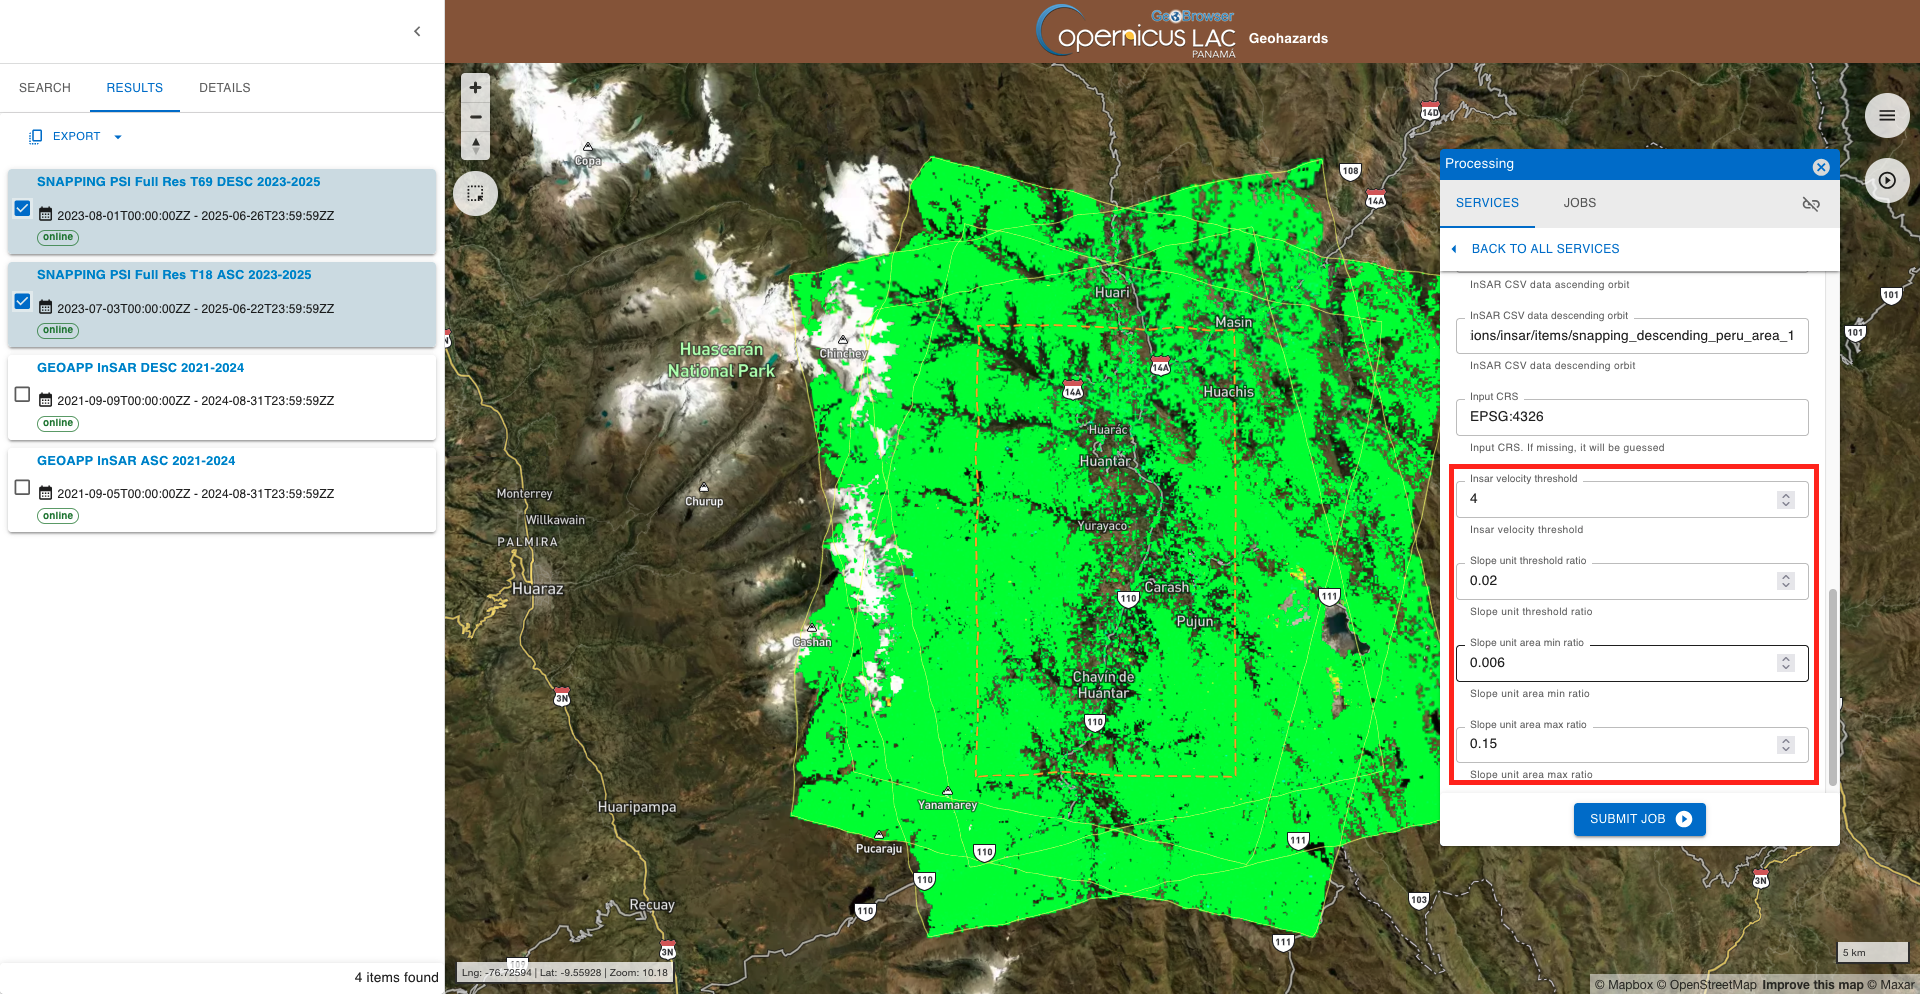
CRS value (optional)
In this tenth parameter you can define the CRS for the AOI and optional vector input. If not specified the service employs the default CSR value EPSG:4326. Leave the parameter blank.
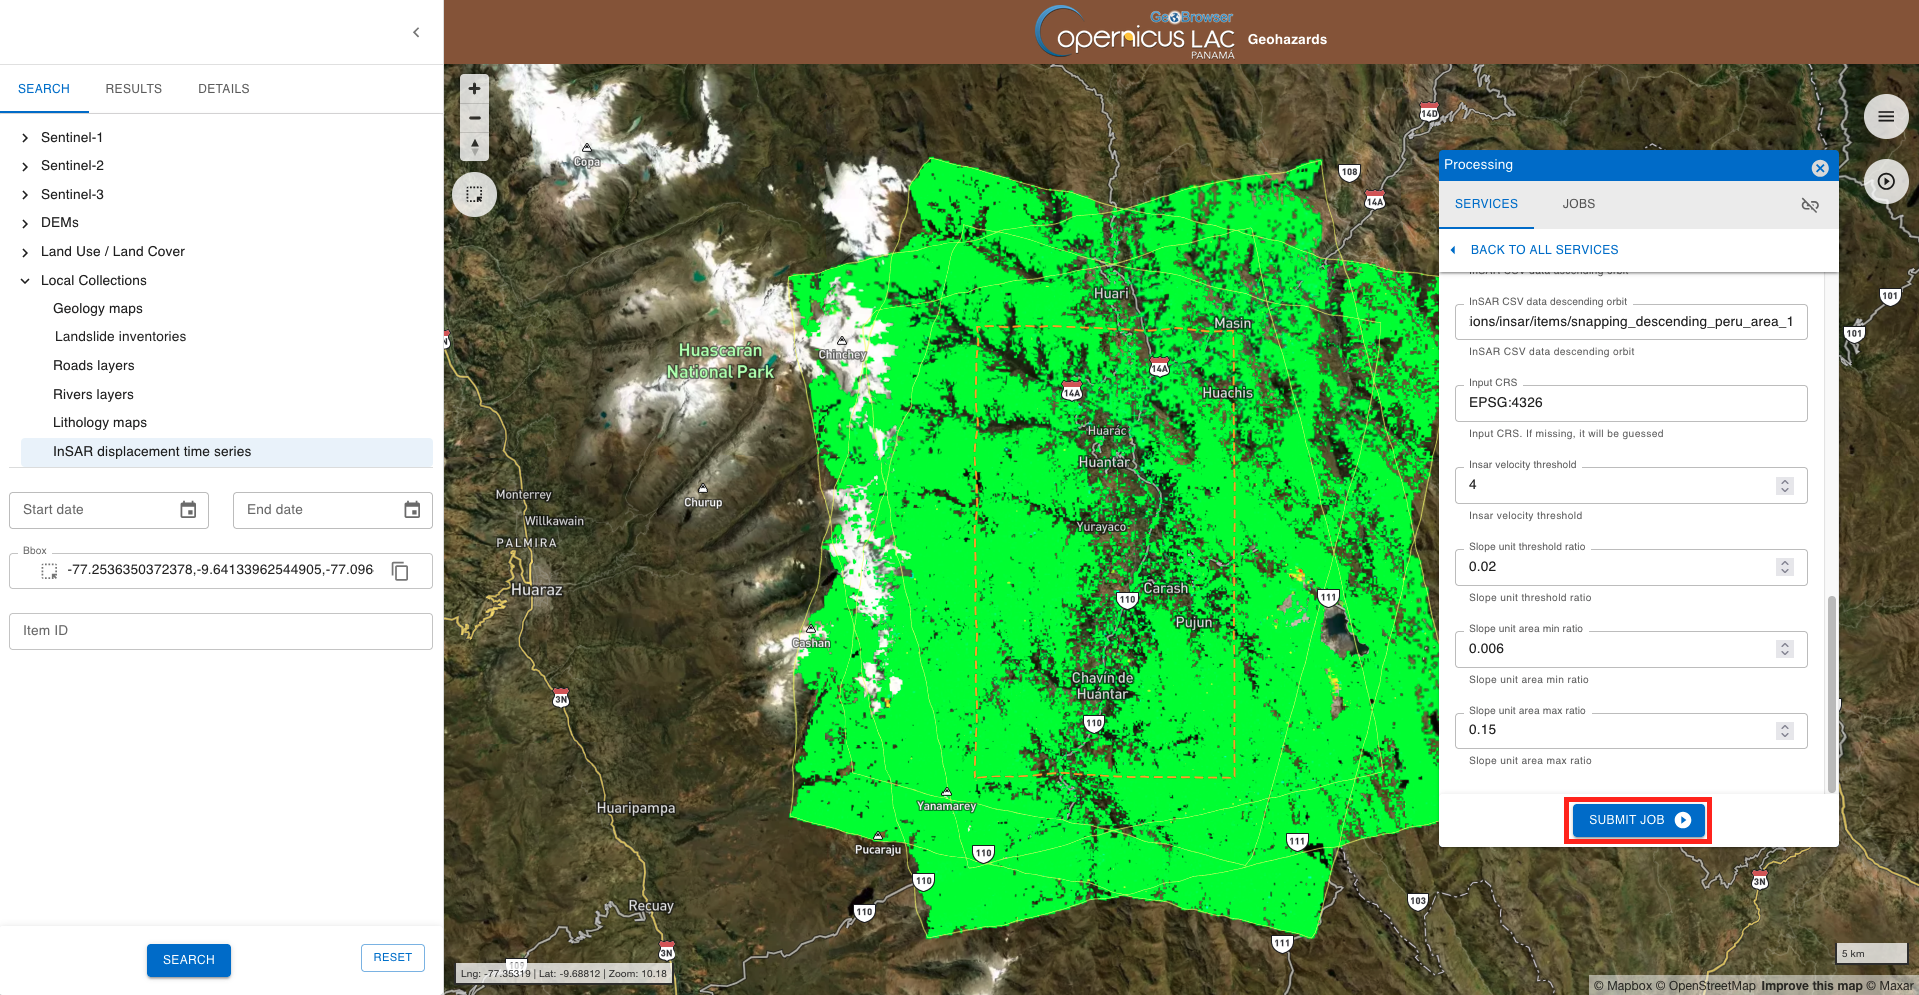
Insar velocity and slope unit thresholds
In the last 4 parameters the user shall specify the value for:
-
Insar velocity threshold: insar_velocity_threshold. Default = 4 mm/yr. -
Slope unit threshold ratio: fraction of AOI area used as the base threshold for GRASS GIS watershed segmentation (smaller = finer segmentation). Default = 0.02. -
Slope unit area min ratio: minimum allowed slope-unit area (fraction of AOI). Default = 0.006 -
Slope unit area max ratio: maximum allowed slope-unit area (fraction of AOI). Default = 0.15
Leave default values for all the parameters
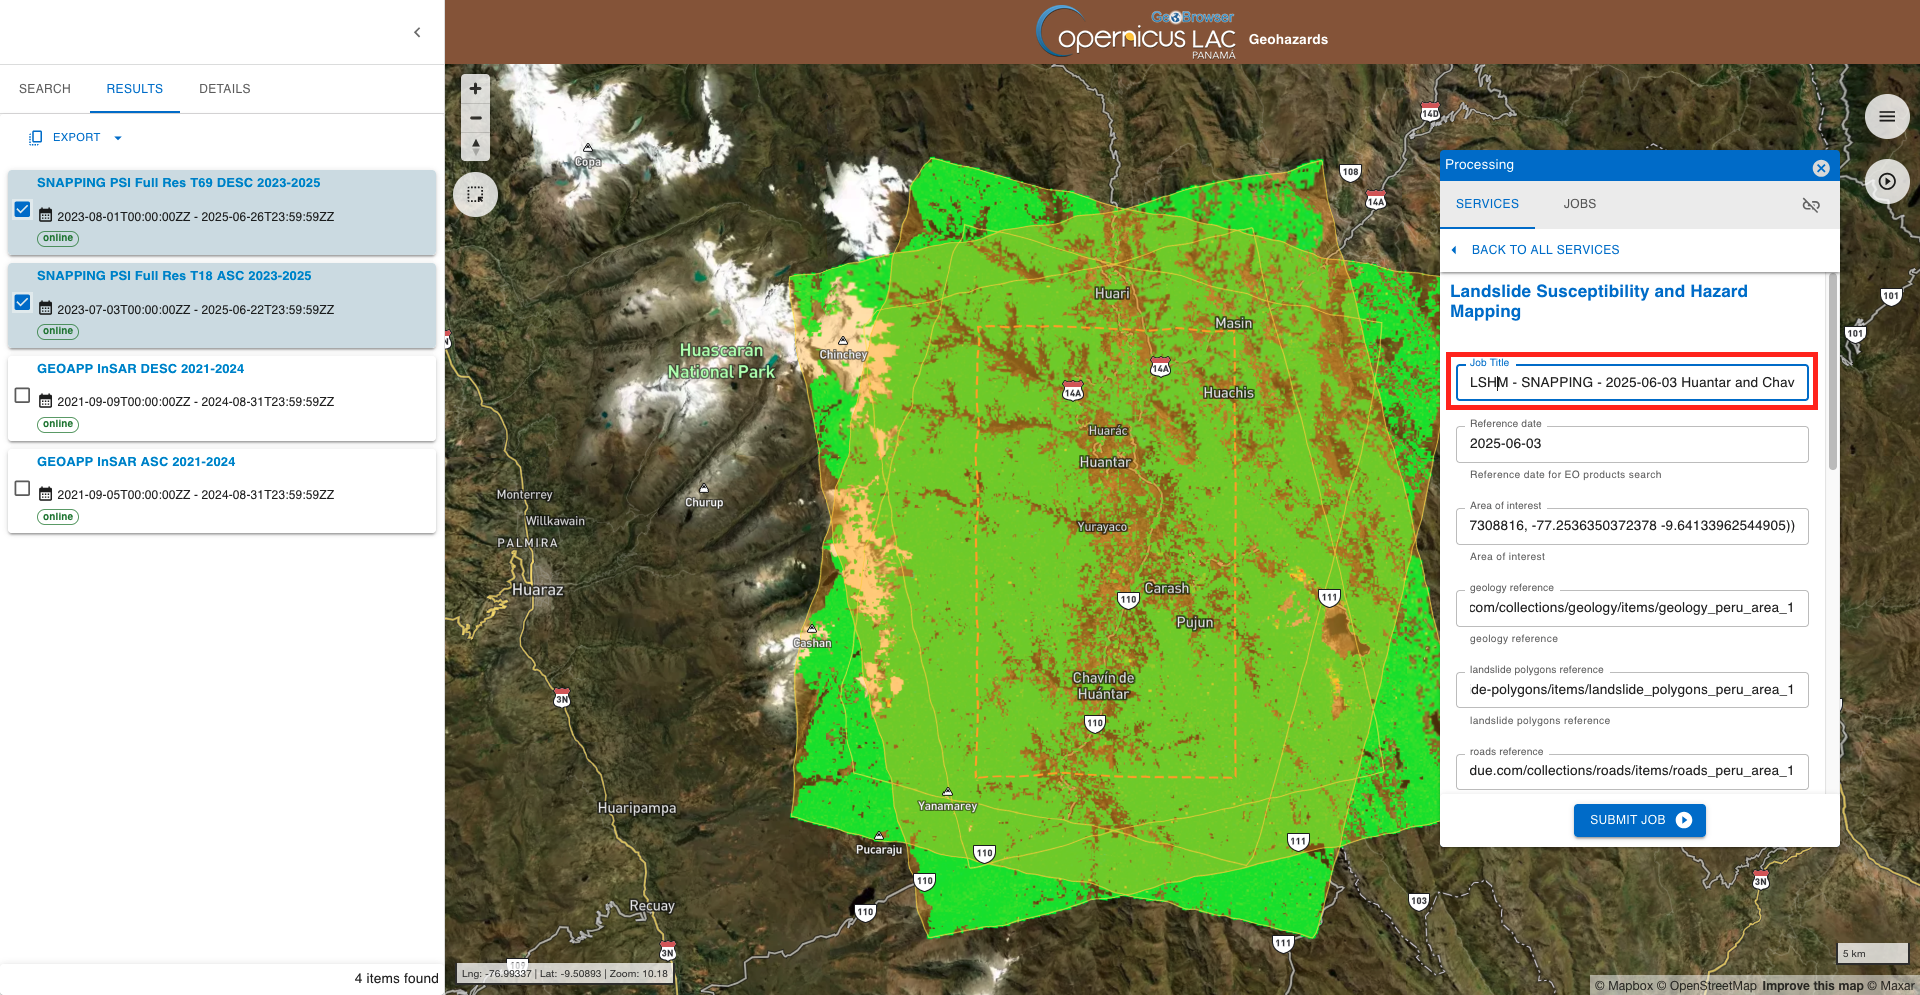
Job Title
Insert as Job title
LSHM - SNAPPING - 2025-06-03 Huantar and Chavín de Huantar
Run the job
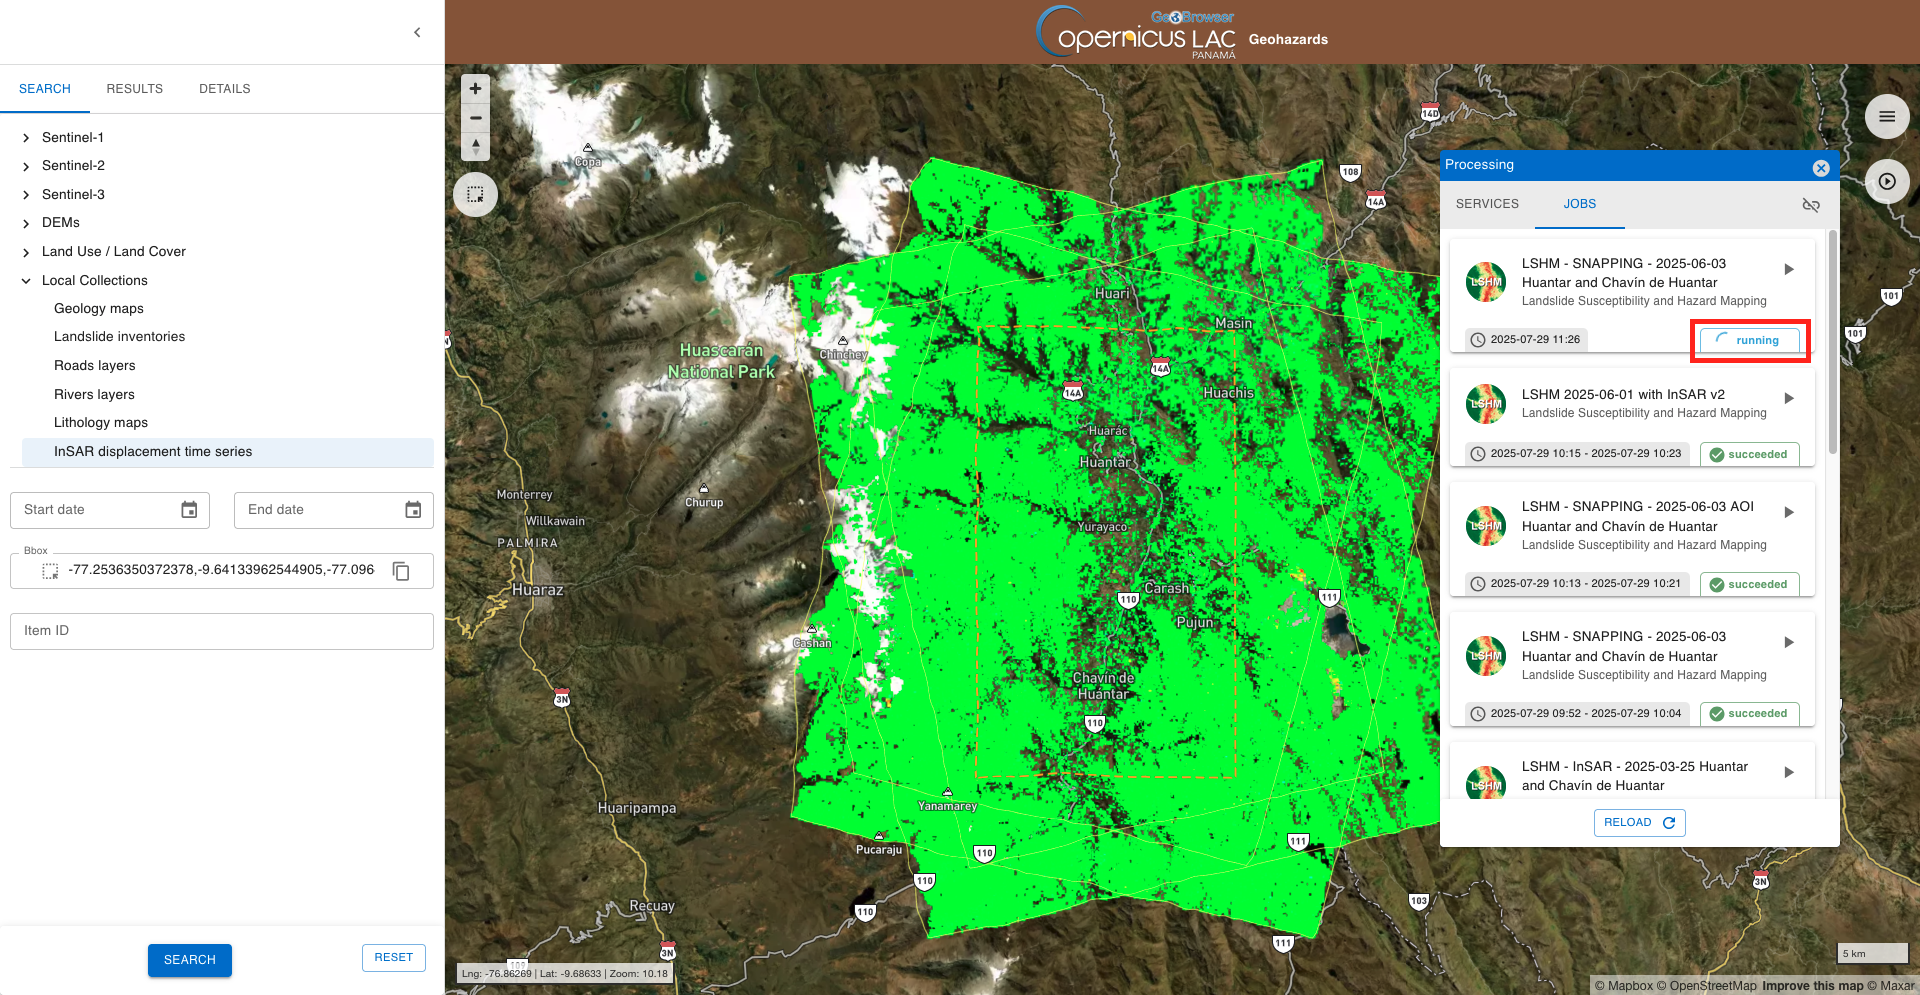
Once all parameters are filled-in click on the button Submit Job button and see the Running Job.
You can monitor the status of the job (Running, Success or Failed) progress through the List of jobs tab or the Job details one.
Note
Typically, the service execution is ranging from a few minutes to a few hours depending on the extent of the user’s AOI, the observation time period, and the allocation of processing resources for the job to be executed. As an example, to employ the LSHM service over an AOI of 75000 ha with all inputs the processing time is of approximately 30 minutes.
Visualize the results
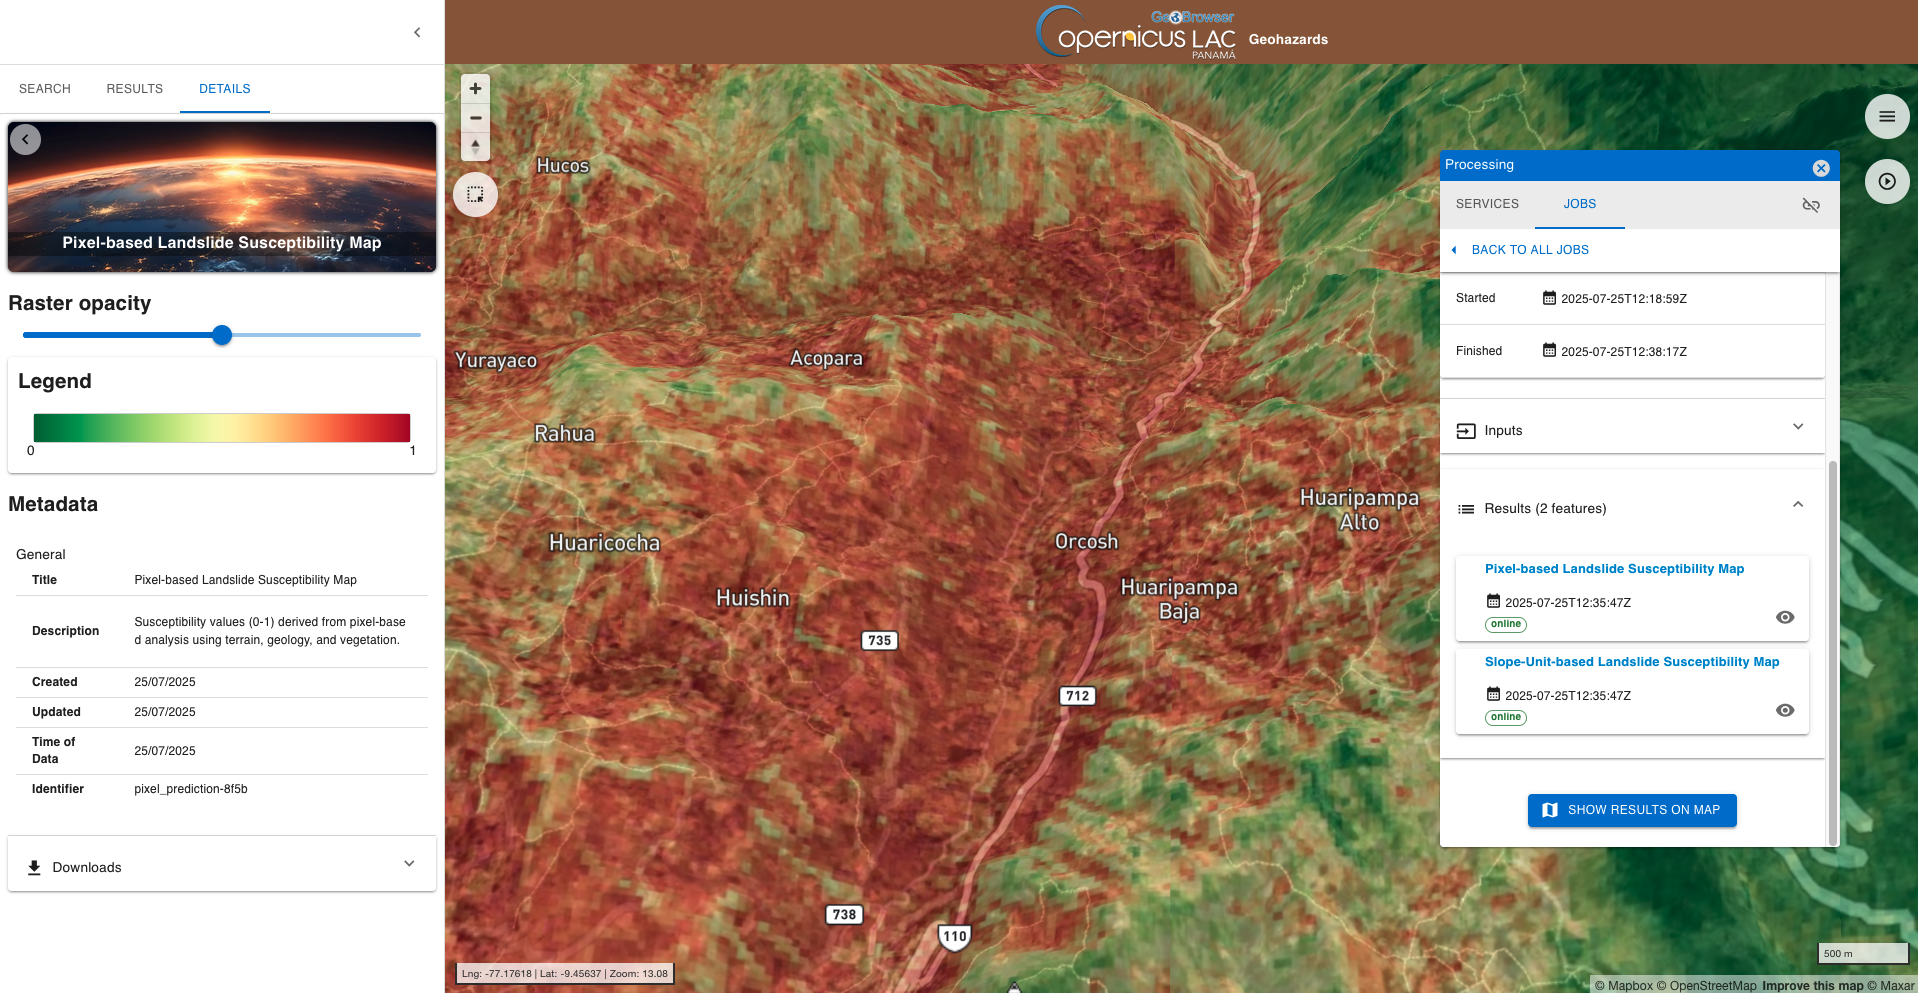
Once the job is successfully accomplished, under the job details click on the button SHOW RESULTS ON MAP located in the JOBS tab of the left panel.
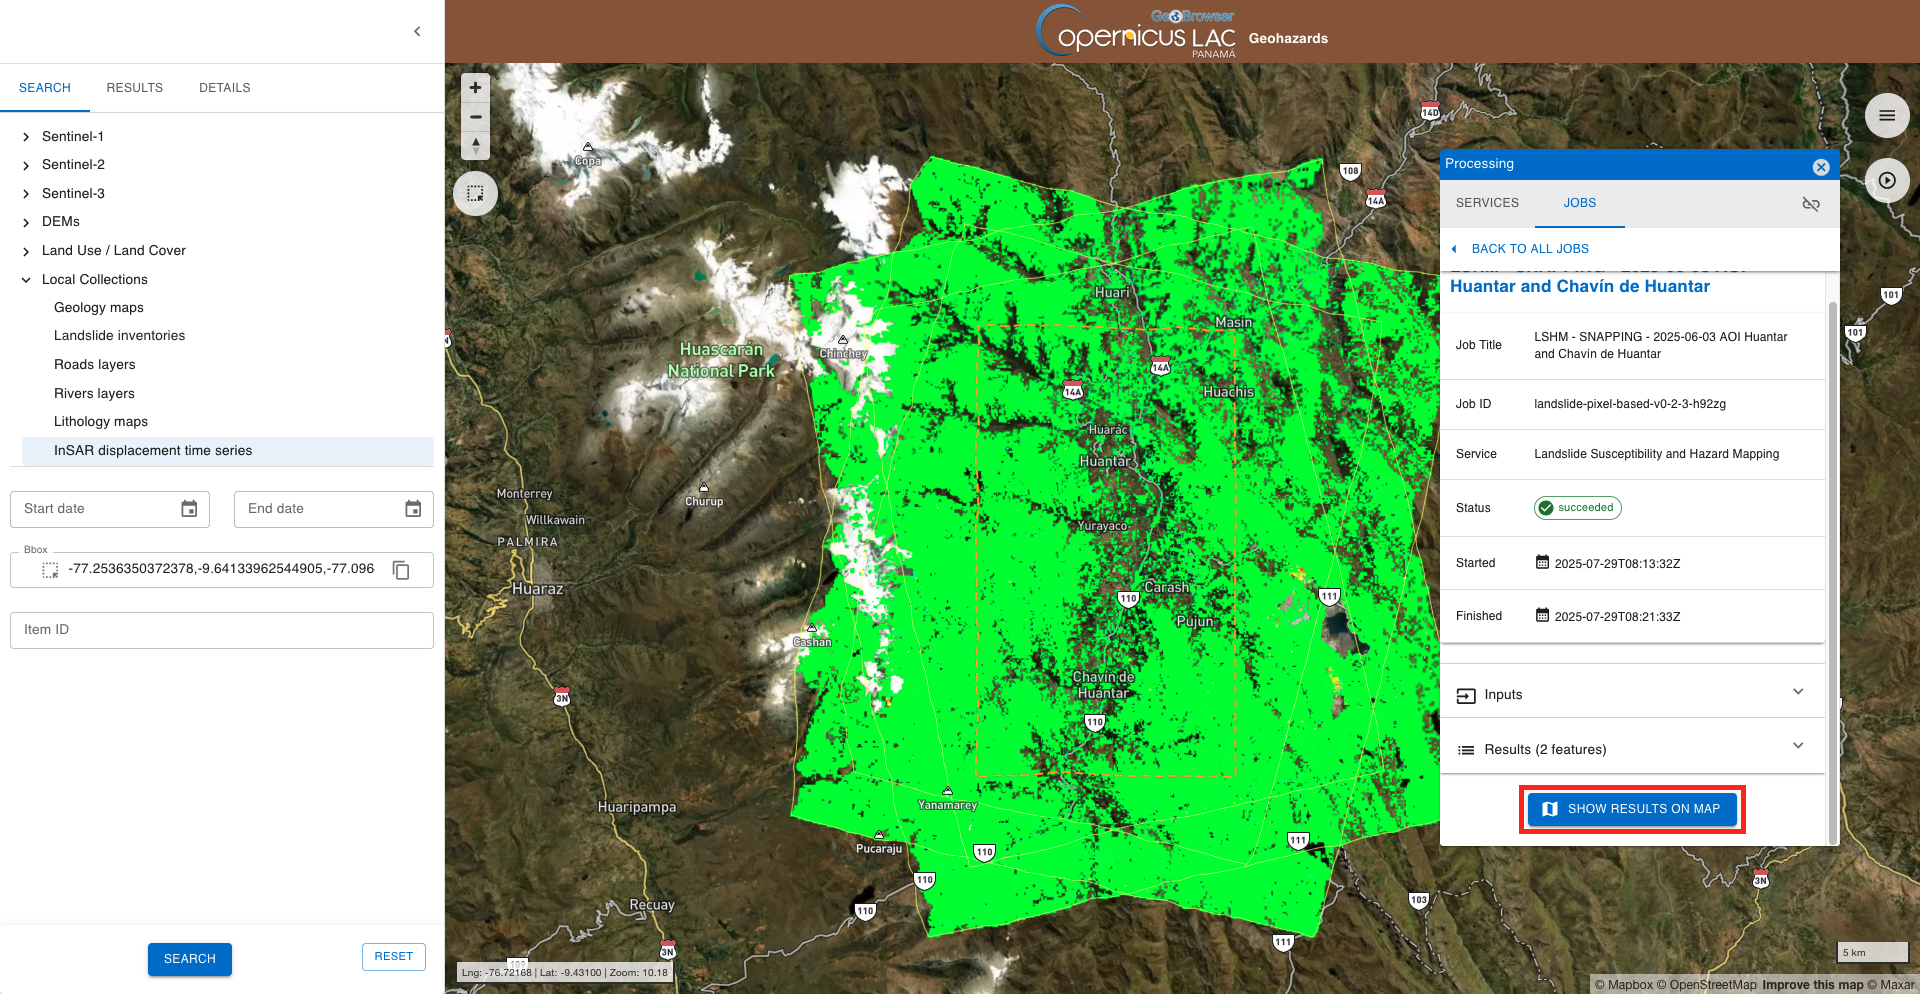
After that the result generated by the service will be displayed on the map.
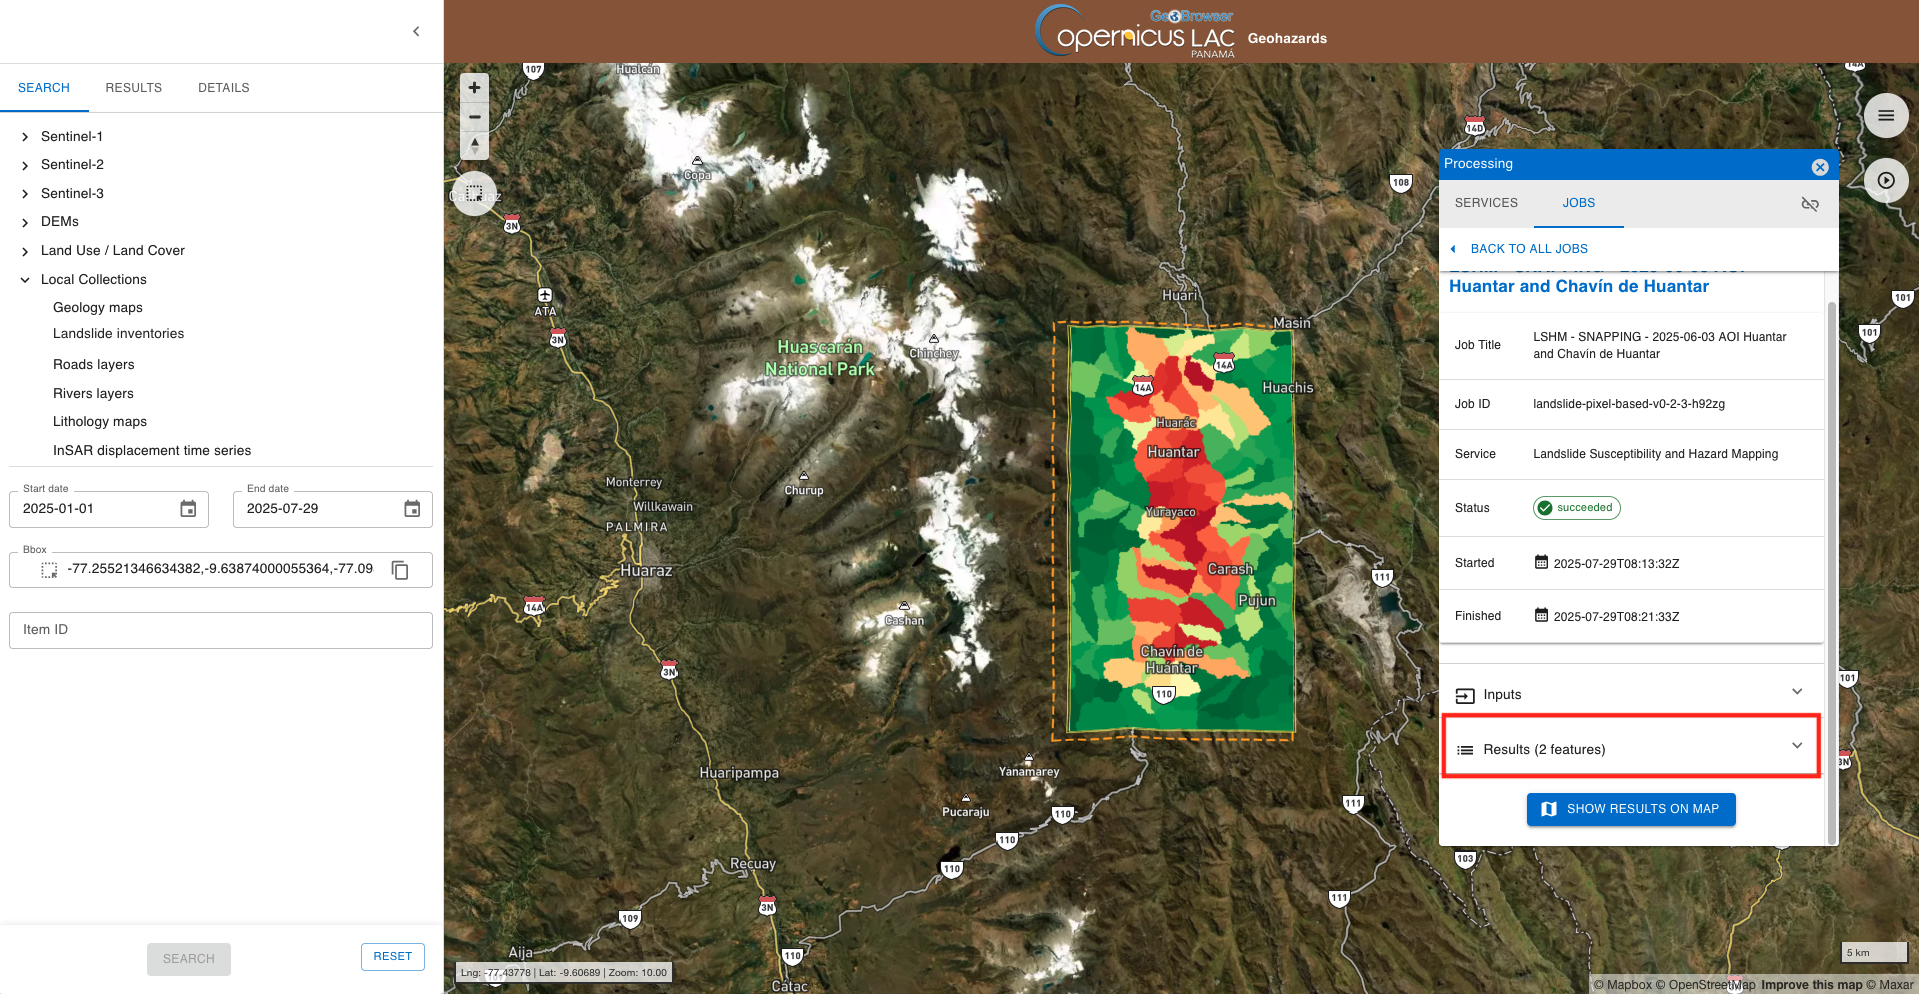
From the details of the job, accessible in the JOBS tab of the left panel, you can consult the input employed in this job and find the result generated by the service. These are accessible by clicking on the Input or Results dropdown list buttons.
Click on the Results (2 features) button to find the 2 assets generated by the LSHM service that can be visualized in the map.
Select the Pixel-based Landslide Susceptibility Map asset. After that the asset will be displayed on the map and product metadata will be shown in the DETAILS tab of the left panel.
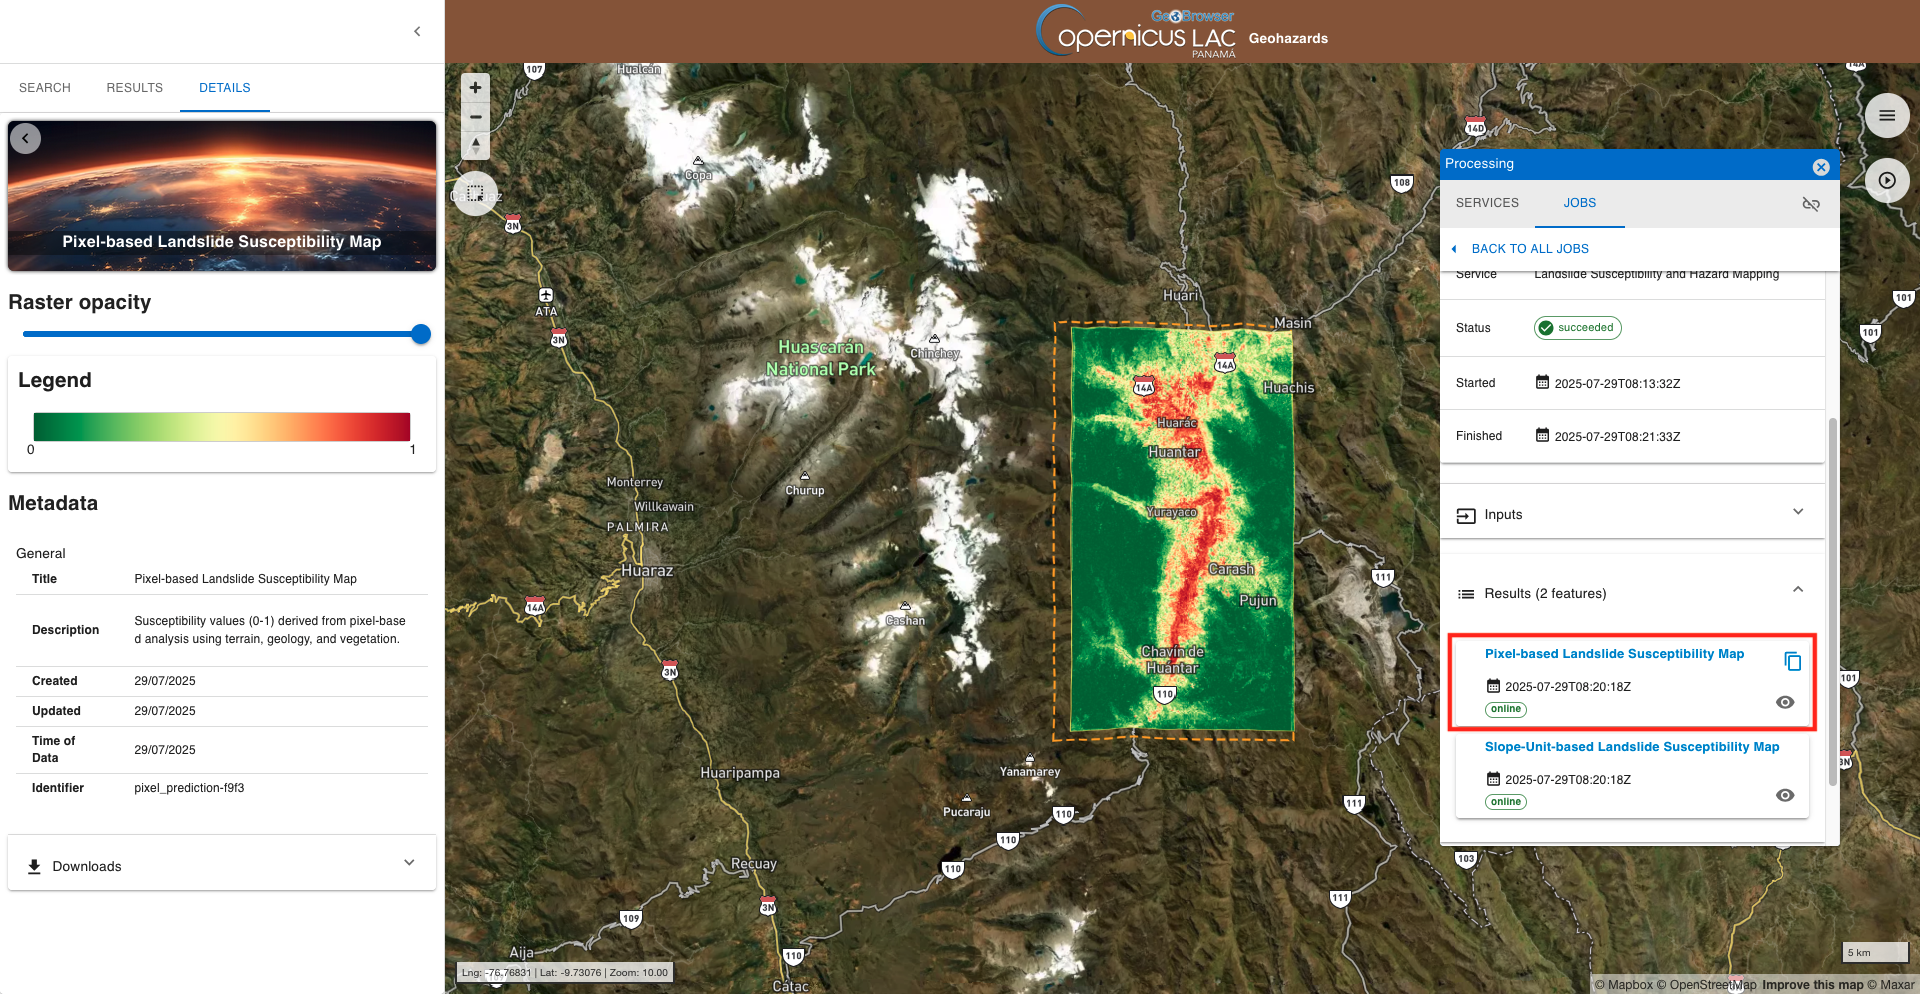
From DETAILS tab in the left panel it is also possible to:
-
change layer selection,
-
change the opacity of the layer,
-
visualize the legend of the product,
-
and download it.
Select the Slope-based Landslide Susceptibility Map asset. After that the asset will be displayed on the map and product metadata will be shown in the DETAILS tab of the left panel.
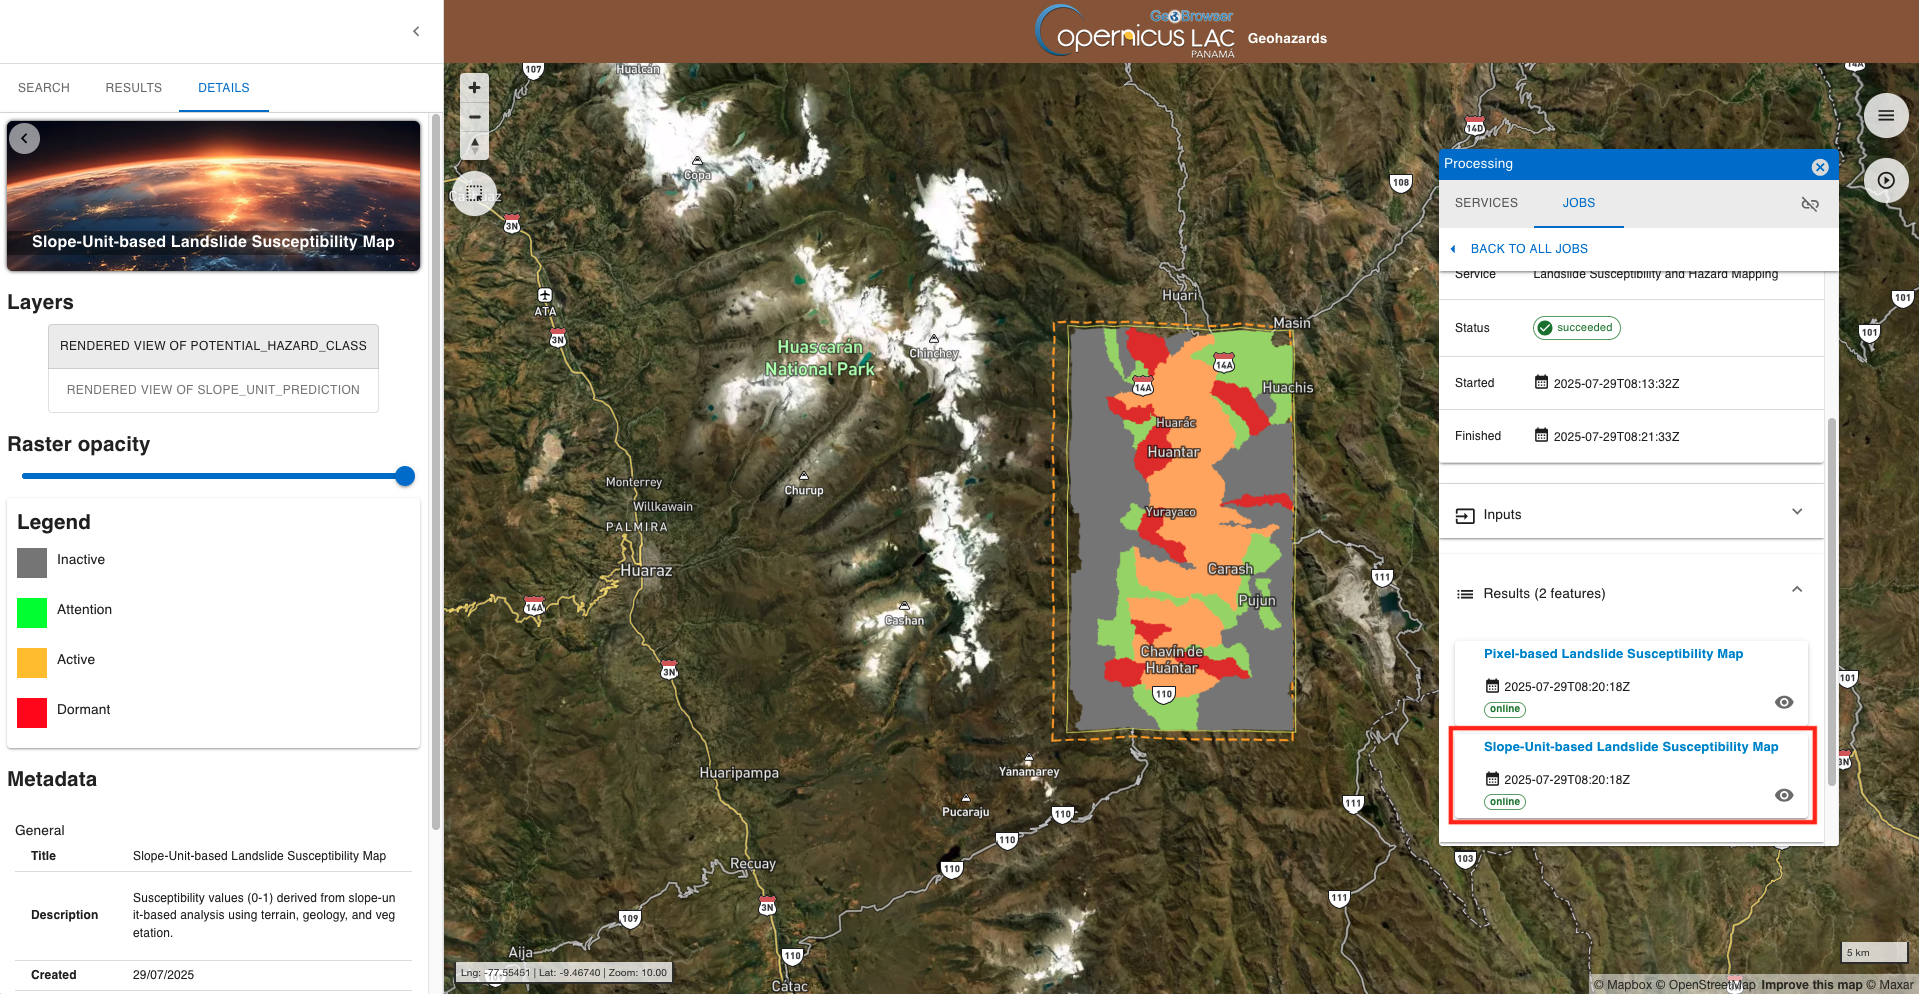
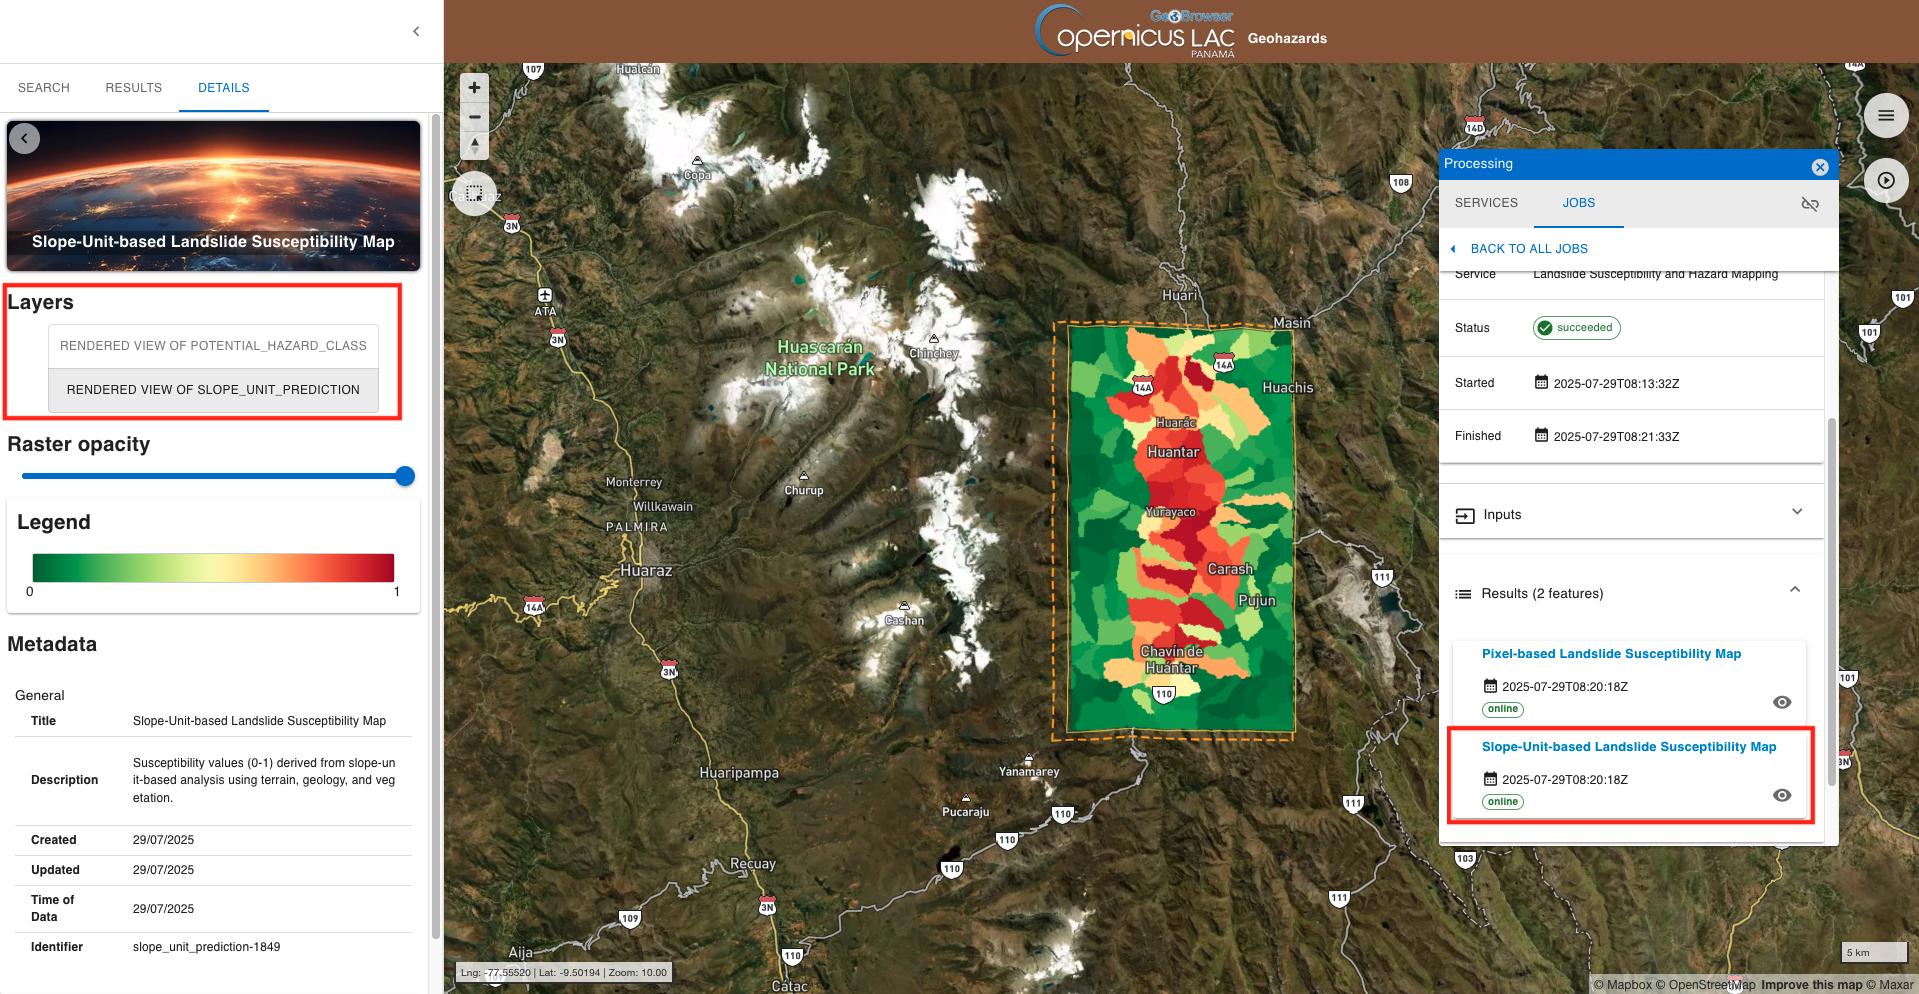
From the left panel switch now from the current layer RENDERED_VIEW_OF_POTENTIAL_HAZARD_CLASS to the other one RENDERED_VIEW_OF_SLOPE_UNIT_PREDICTION. After that the other layer will be shown on the map.
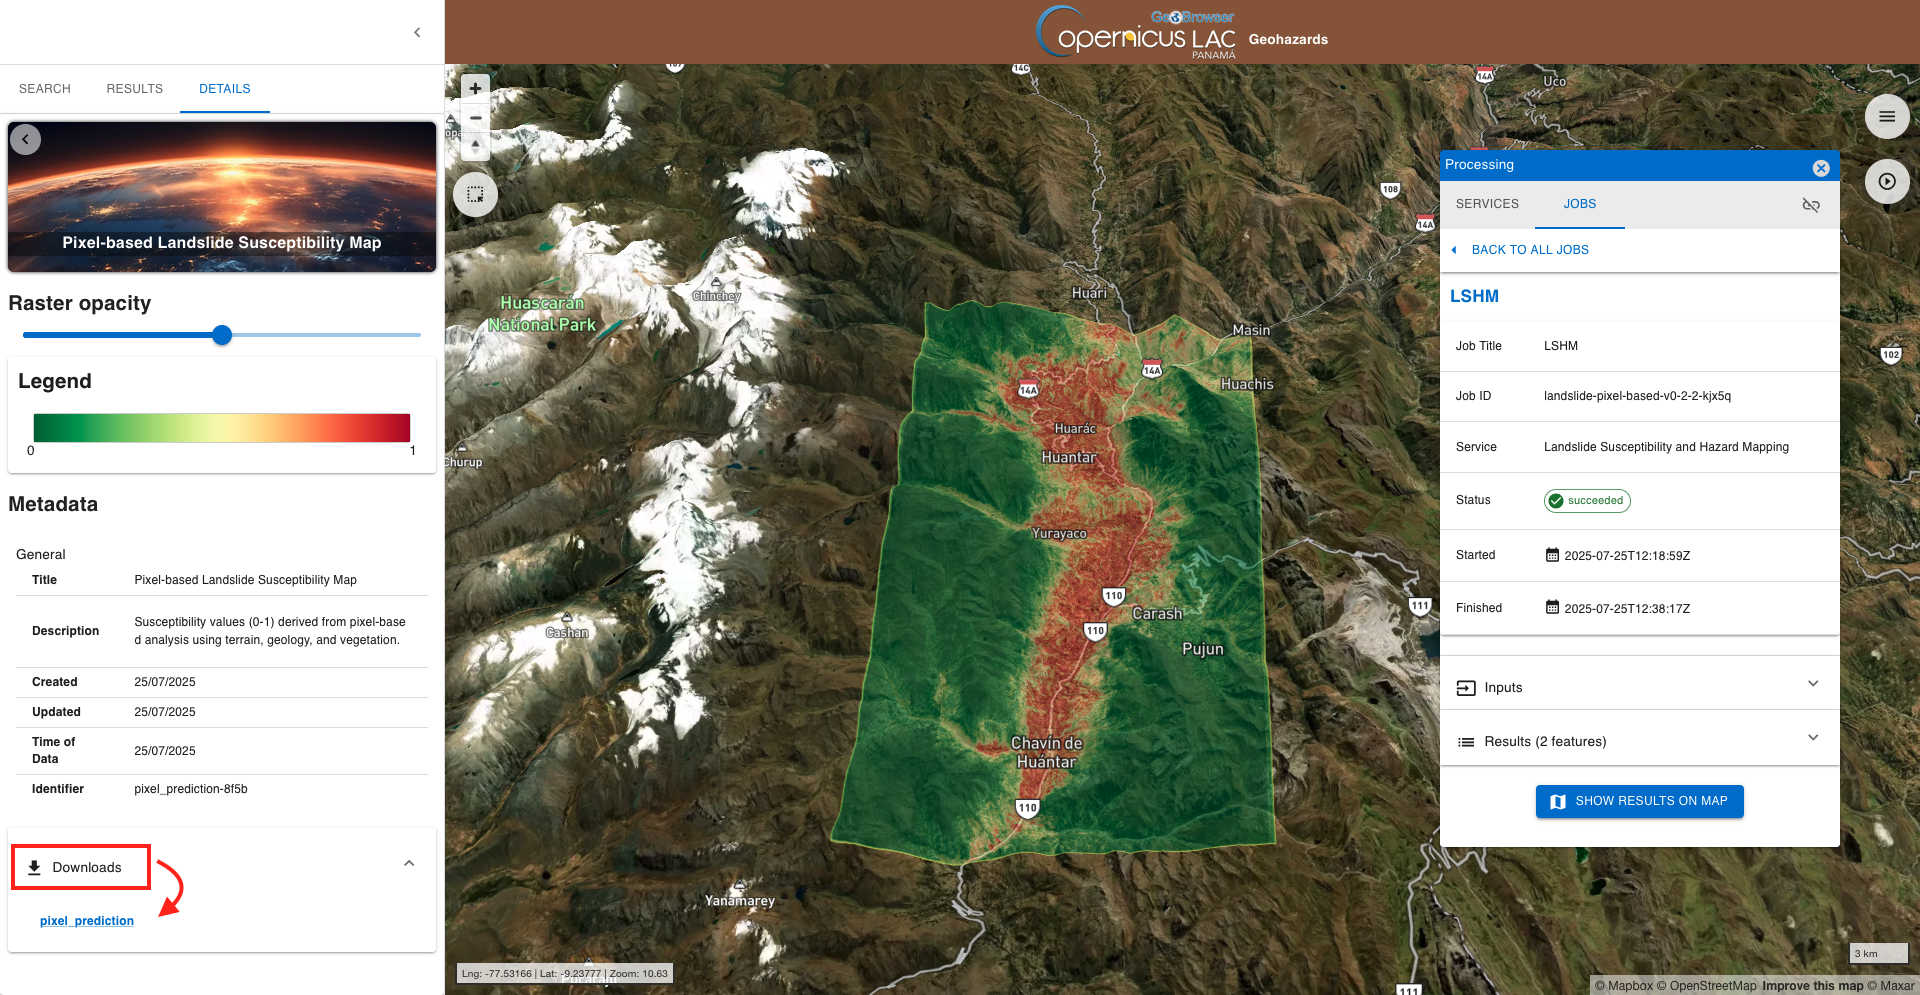
Select back the Pixel-based Landslide Susceptibility Map product and now change the 3D view of the product and set the opacity as 50% from Raster Opacity to see the labels of the basemap layer.
To download the product from the left panel click on the Downloads dropdown button and then on the hyperlink of the single asset.
Job resubmit
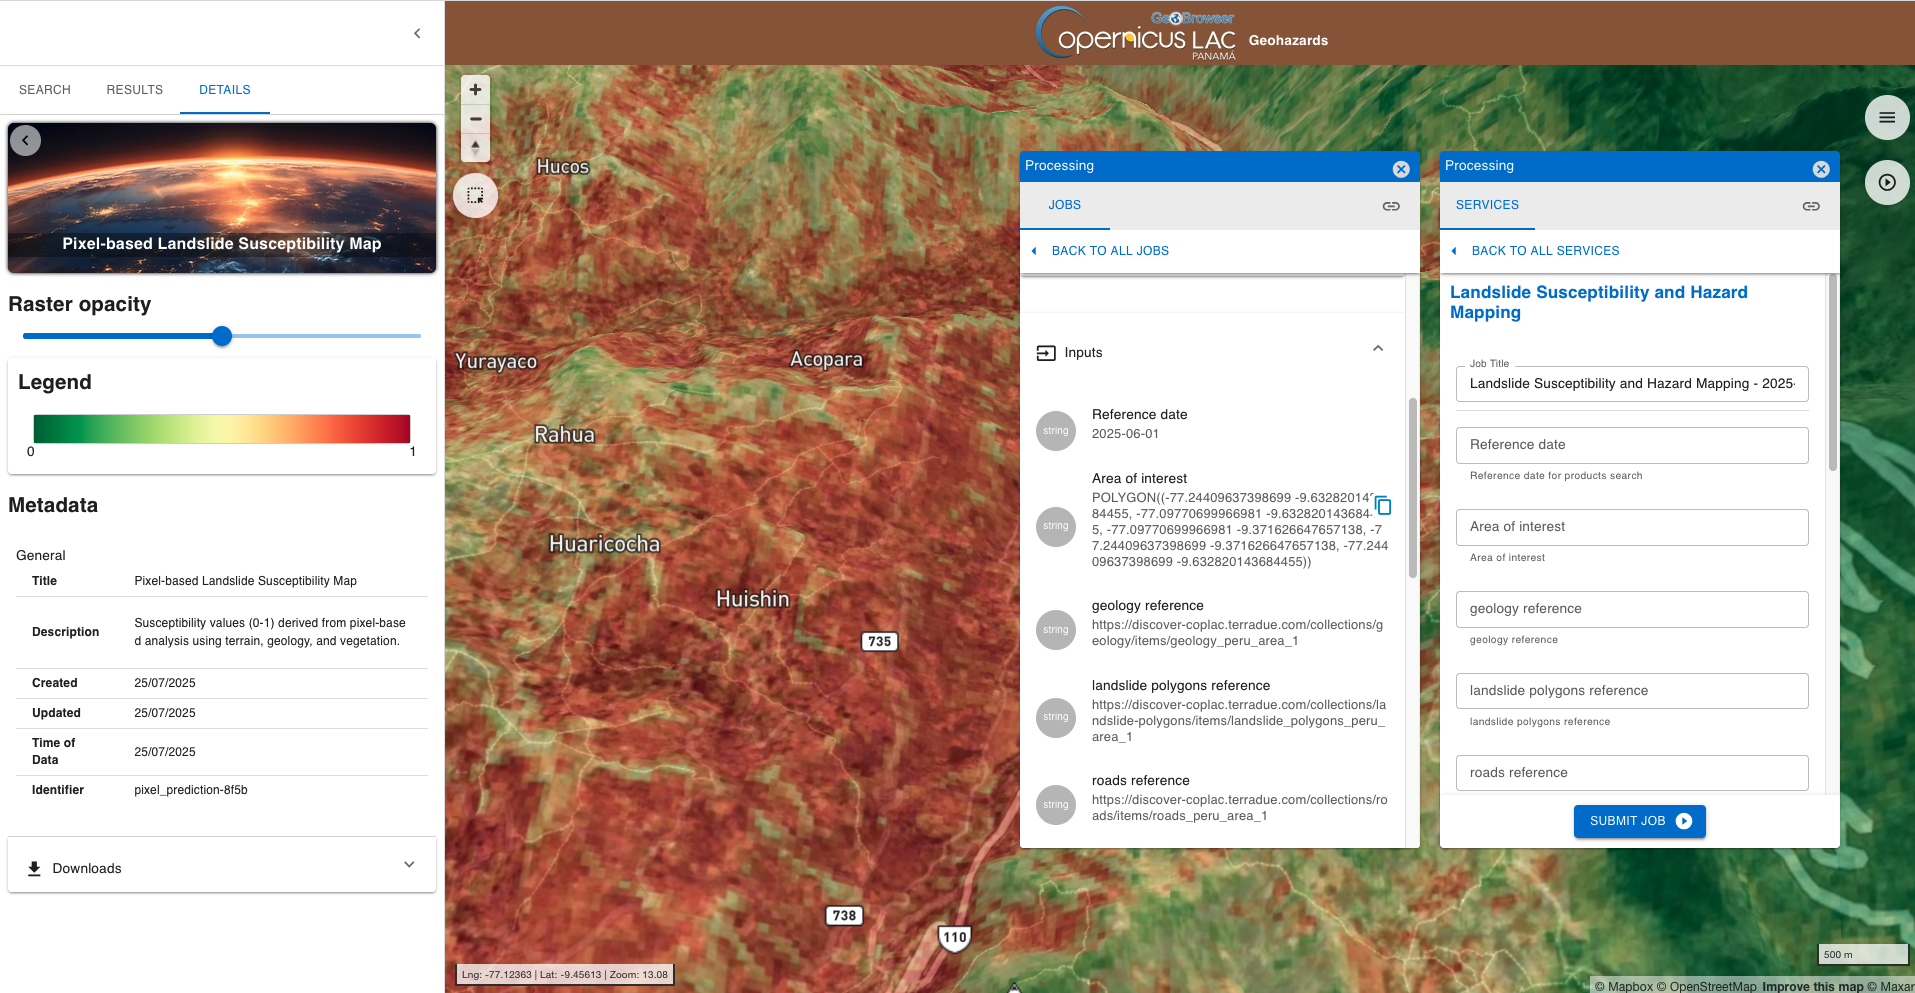
Aren't you happy with this result? Or, do you want to fine tune one of the employed parameters? If yes, it is possible to easily resubmit another job by clicking on the Detach tabs button located on the top right corner of the Processing panel.

After clicking on it the two tabs JOBS and RESULTS will be shown separately over the map.
In this way you can quickly find and copy input parameters employed in other jobs and easily paste them while filling-in again the service form.
Extra material
Try employing the LSHM service also over another area, for instance over the Colca site in Peru.
This time insert only the mandatory parameters and do not specify the optional input layers: roads, rivers, lithology and InSAR terrain motion ascending and descending.
The below figure shows the Slope-based Landslide Susceptibility Map obtained with the LSHM service over the Colca site.
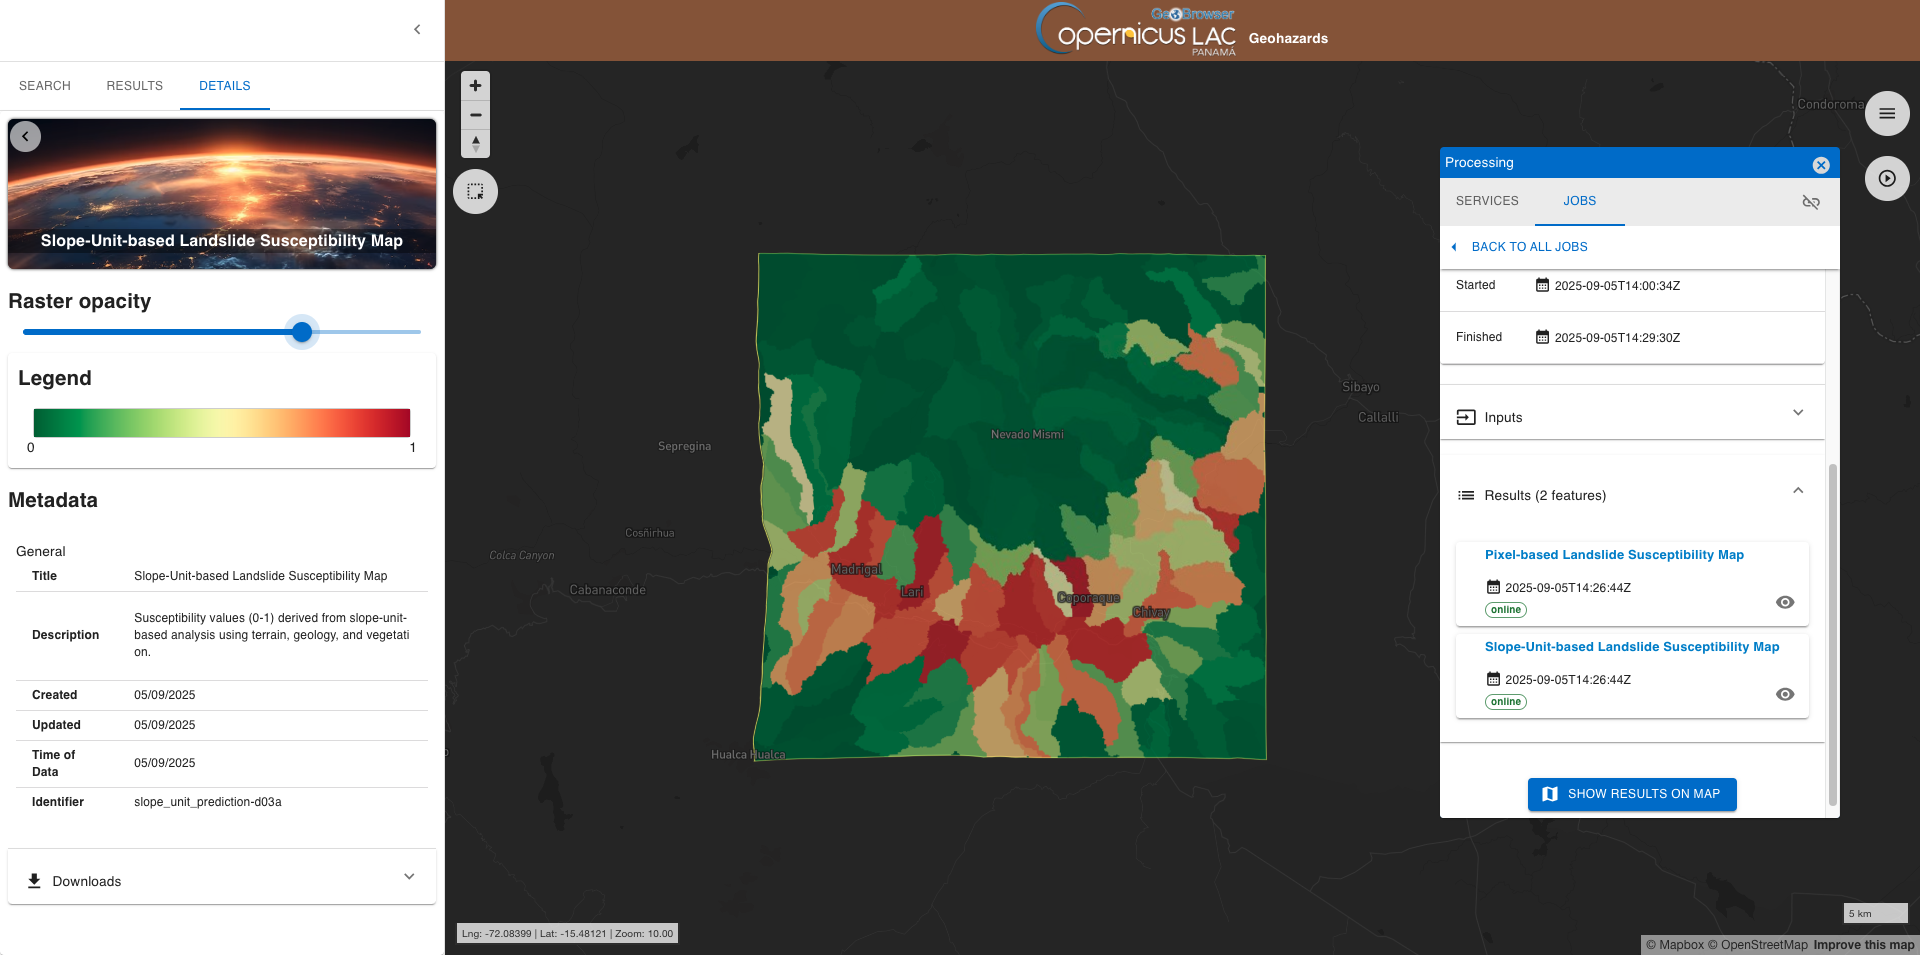
This product is derived using the following parameters:
Reference date
2025-08-13
Area of interest
POLYGON((-71.86779817265071 -15.730698855698407, -71.52364335649561 -15.730698855698407, -71.52364335649561 -15.400936314750695, -71.86779817265071 -15.400936314750695, -71.86779817265071 -15.730698855698407))
geology reference
https://discover-coplac.terradue.com/collections/geology/items/geology_colca
landslide polygons reference
https://discover-coplac.terradue.com/collections/landslide-polygons/items/landslide_inventory_colca
Input CRS
EPSG:4326
Insar velocity threshold
4
Slope unit threshold ratio
0.02
Slope unit area min ratio
0.006
Slope unit area max ratio
0.15