kinesIS service tutorial
![]()
Find kinesIS service description and specifications here.
Select the processing service
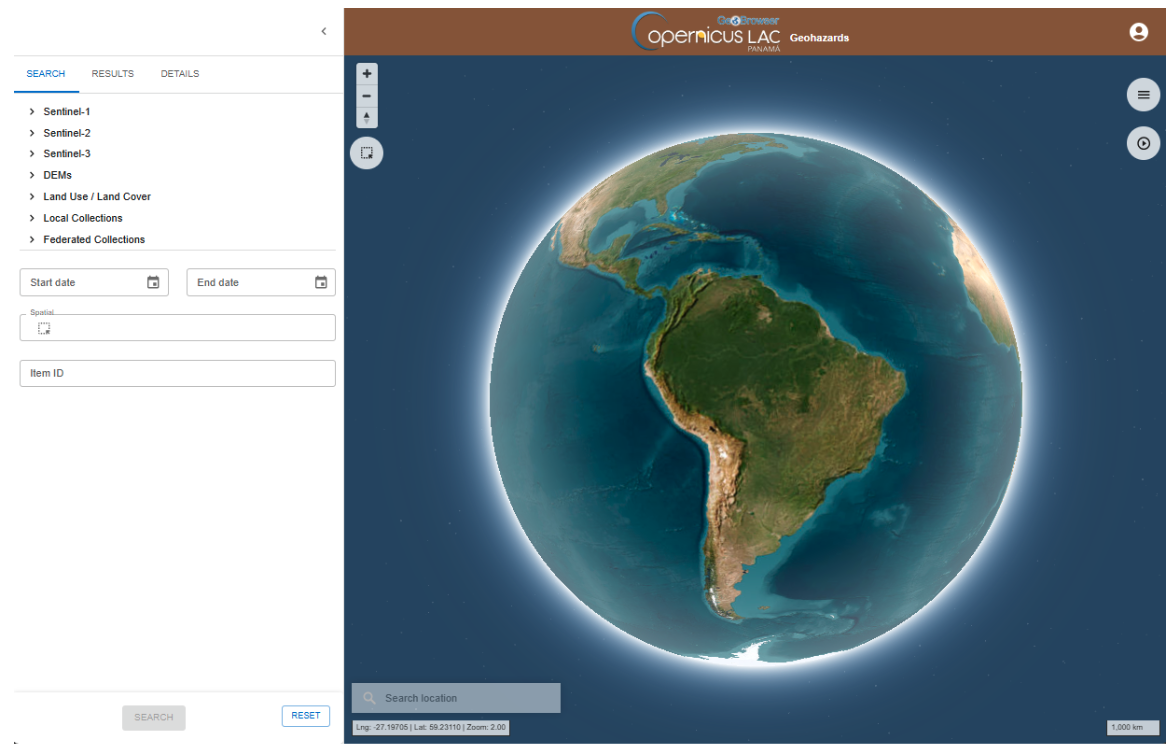
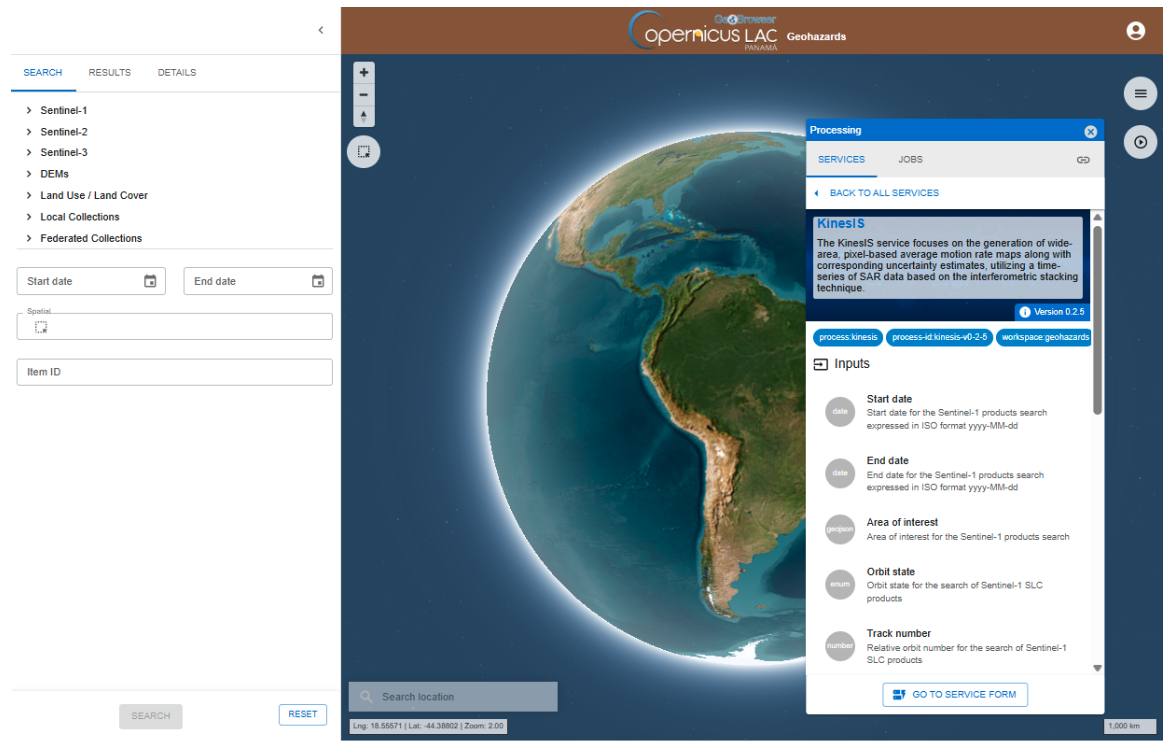
After the opening of the Geohazards workspace of the CopernicusLAC Platform open the Processing Services panel by clicking on the button located on the top right of the map.
The Processing panel will be displayed with the list of on-demand services available for this workspace.
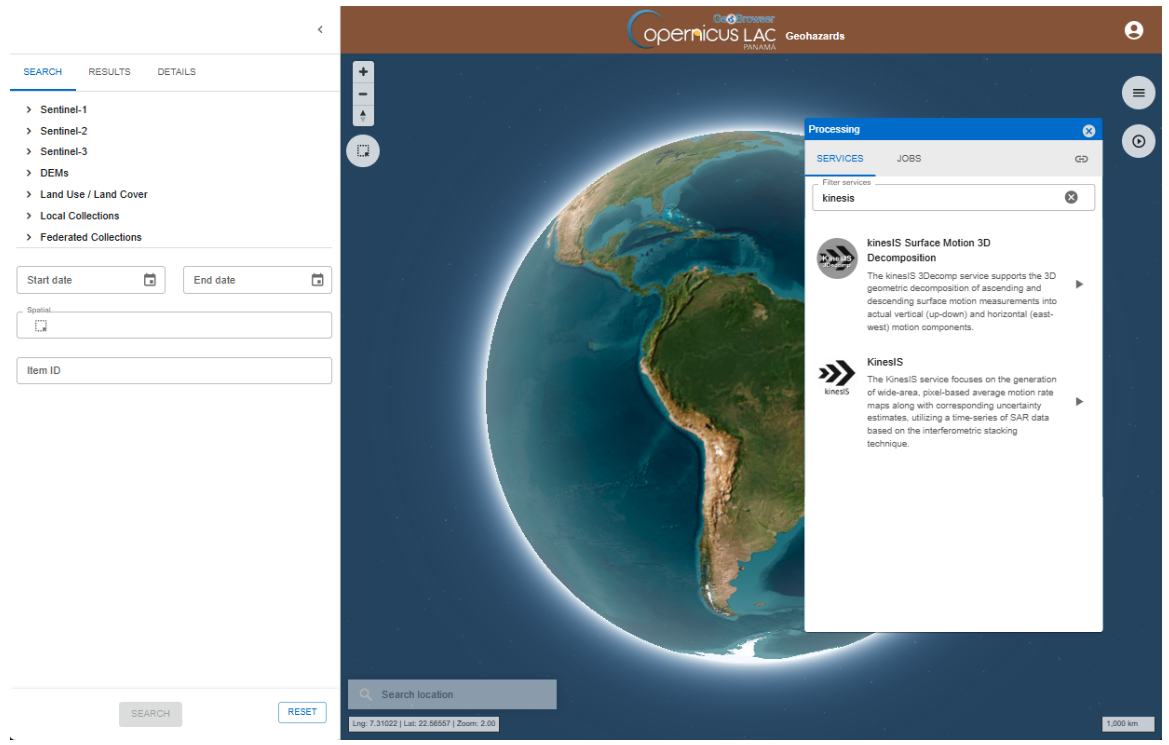
Find the kinesIS service from the list and click on the button next to it.
This tab provides a quick description of the service. In the upper part of the tab are shown:
-
service full name,
-
service caption,
-
hyperlink to the online documentation,
-
version of the service.
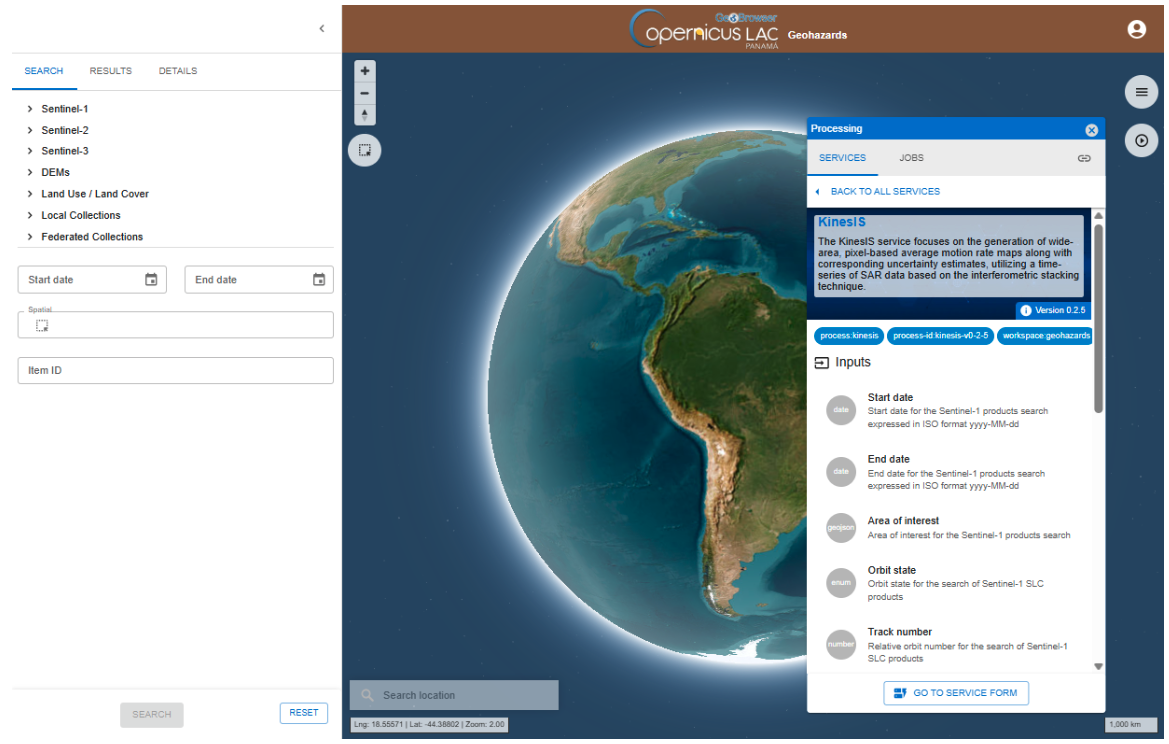
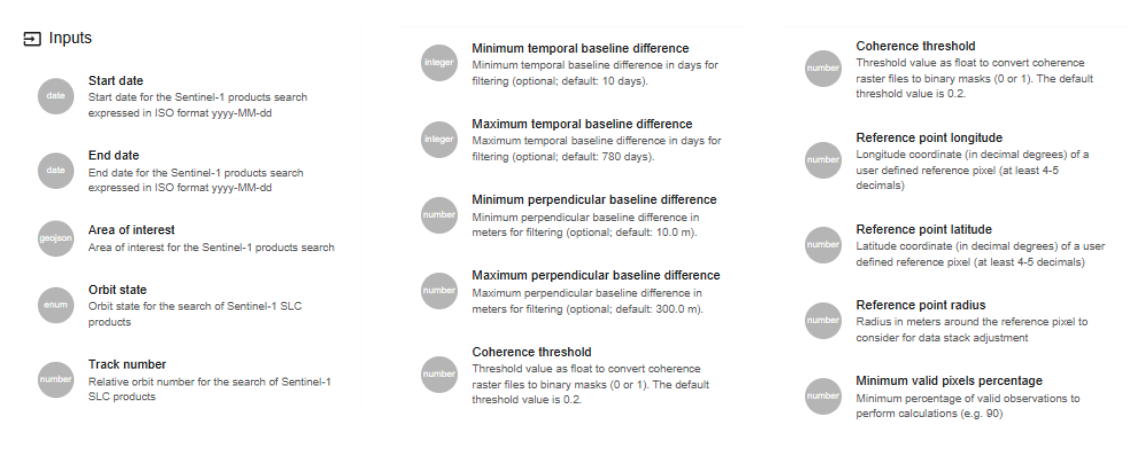
Below that are listed all mandatory and optional parameters that the user must define when submitting the on-demand processing. Each parameter is described with:
-
a grey circle on the left indicating the format of input value required for the parameter. As an example if the parameter is a string (e.g. catalog reference) or a number (e.g. a threshold),
-
the identifier of the parameter,
-
a brief description of the parameter.
At the bottom of the tab is located the GO TO SERVICE FORM button. Click on it to move to the next tab where the user can fill-in all service parameters and submit the on-demand job.
Hint
To go back to the service panel click on the BACK TO ALL SERVICES button.
Fill the parameters
To start the kinesIS service, you need to define input parameters. Access the kinesIS service form and then fill-in the parameters as described in the following sections.
Hint
In case you can’t find anymore the kinesIS service form:
- open the Processing panel by clicking on the button on the top right of the map,
- find the kinesIS service from the list of services,
- click on the button next to it,
- and then click on the GO TO SERVICE FORM button.
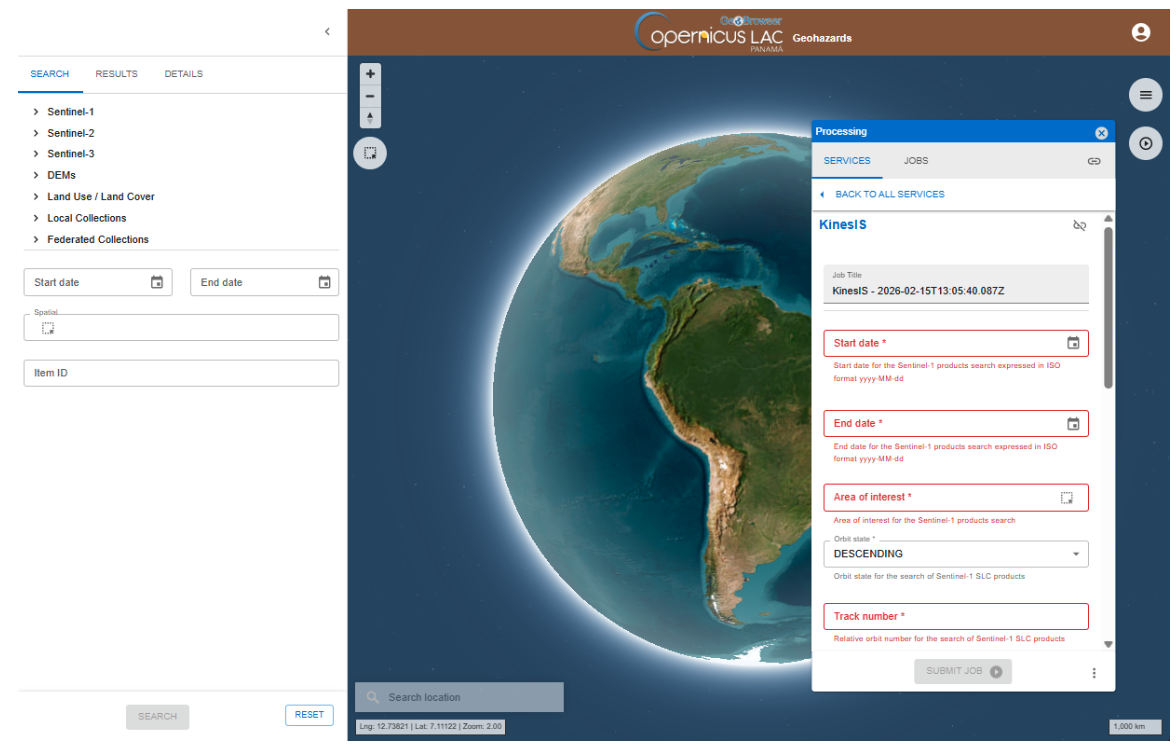
Job Title
First of all, you can assign a name to the on-demand job you are launching. A predefined title is generated by the platform. Modify this title and assign the title you prefer. For instance, insert as Job title:
panama_kinesIS_s1_d113_202401_202412
Note
If you don’t specify a name, the system automatically assigns one using the service name kinesIS and the date and time of job creation.
Start Date
In this parameter you shall insert the start date of the required observation period. The date must be entered as a string in the format YYYY-MM-DD (for example, 2024-01-01).
End Date
In this parameter you shall insert the end date of the required observation period. The date must be entered as a string in the format YYYY-MM-DD (for example, 2024-12-31).
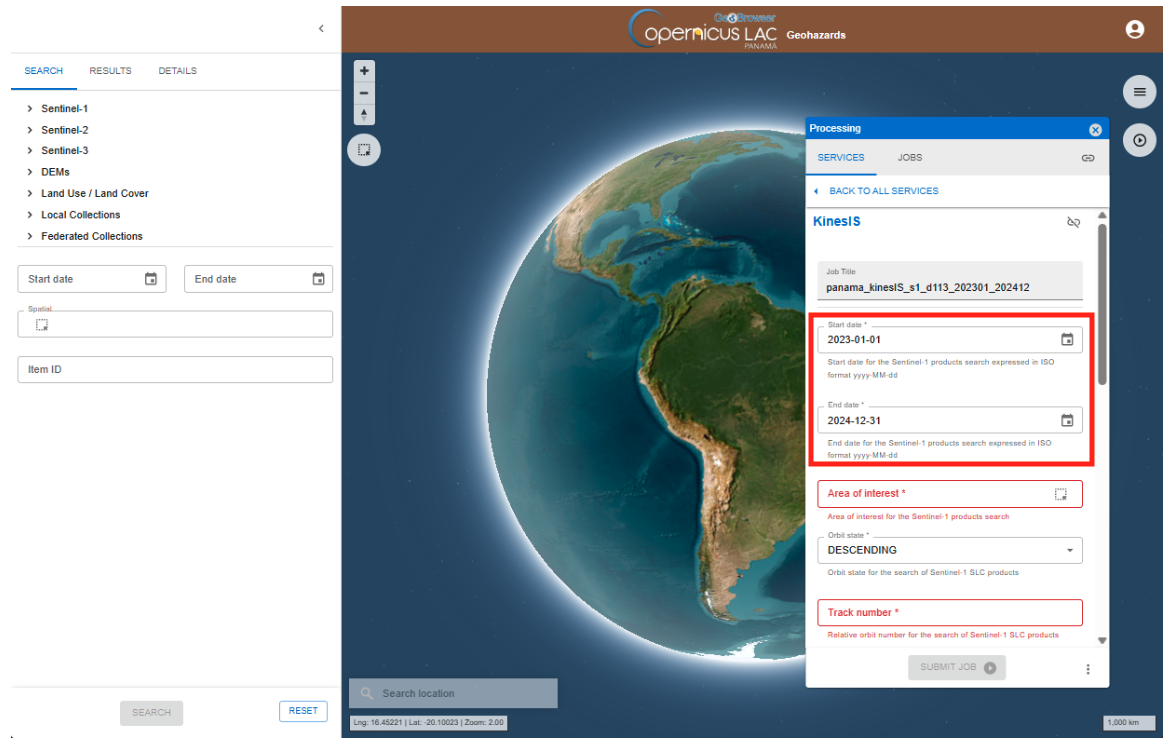
The service will use these dates to search for available S1 acquisitions.
Warning
Use the date picker widget to define the date. The value inserted shall be in the form YYYY-MM-DD. Do not insert for instance 30-05-2024 or 2024/05/30 but 2024-05-30
Area of interest
This mandatory parameter allows you to specify the geographic area to perform the analysis, and thus, will be the area where the surface motion measurements will be produced by the service. The AOI must be provided as a WKT string representing the geometry of the area (polygon).
To define the AOI through the platform:
- Navigate the map to your AOI (e.g. Panama City).
Hint
Navigation controls are located on the top left of the map. From these buttons the user can:
-
Zoom in (+): left click on the button
-
Zoom out (-): left click on the button
-
Change the viewing angle by setting inclination and orientation: left click and hold the compass button while you drag left and right or up and down.
-
Reset bearing to the north: left click on the compass button
In the 3D view the user can tilt the map in any direction. The 3D tilt control is useful to for viewing hills and mountains.
Hint
To see labels change to another base layer as an example the Streets one.
Hint
For a quick search of a place of interest you can type the name of the location using the Search Location tool available in the lower left corner of the map. After the search the map will be automatically zoomed to a BBOX covering the location of interest.
- On the map interface, use the drawing tool “Filter by bbox” to draw a polygon describing your AOI.

Hint
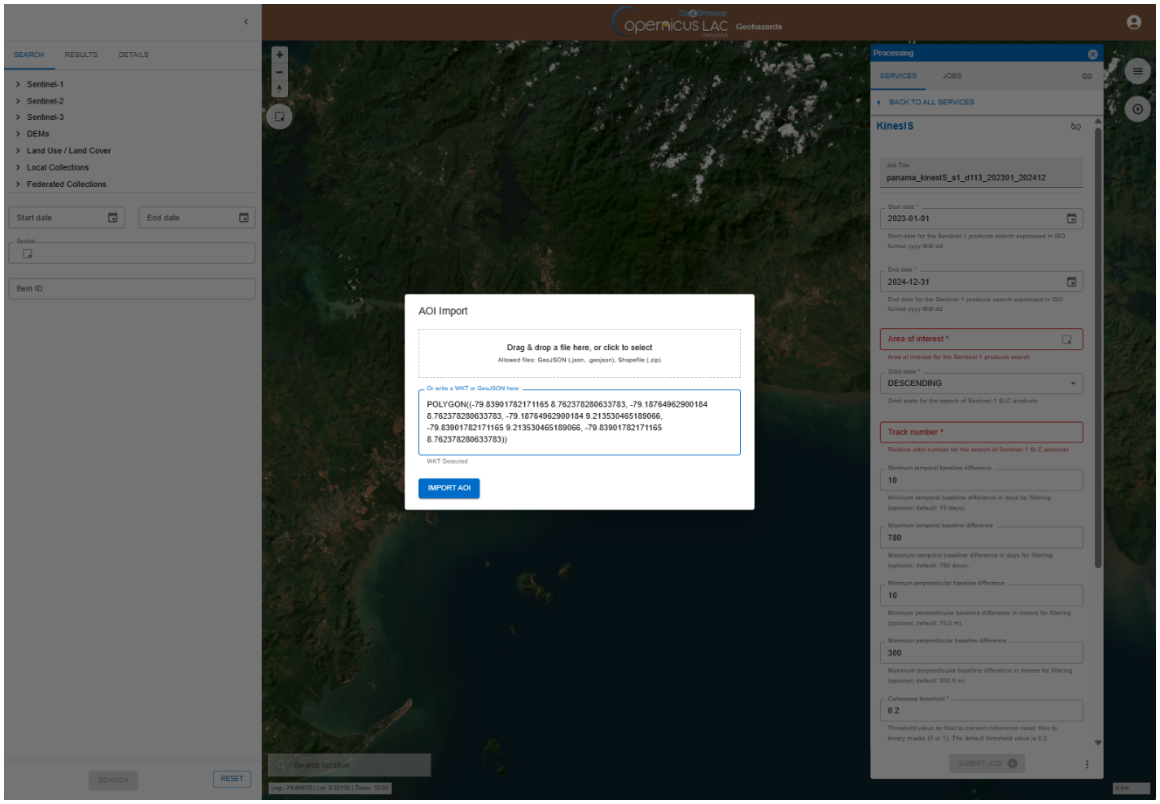
Do you already have a geometry as WKT string or a GeoJSON file and you want to employ it as AOI in your job? There is the option to import your AOI by clicking on Filter by AOI import button located in the upper left corner of the map under the navigation toolbar.
After that paste your WKT value in the dedicated field and click on IMPORT AOI button.
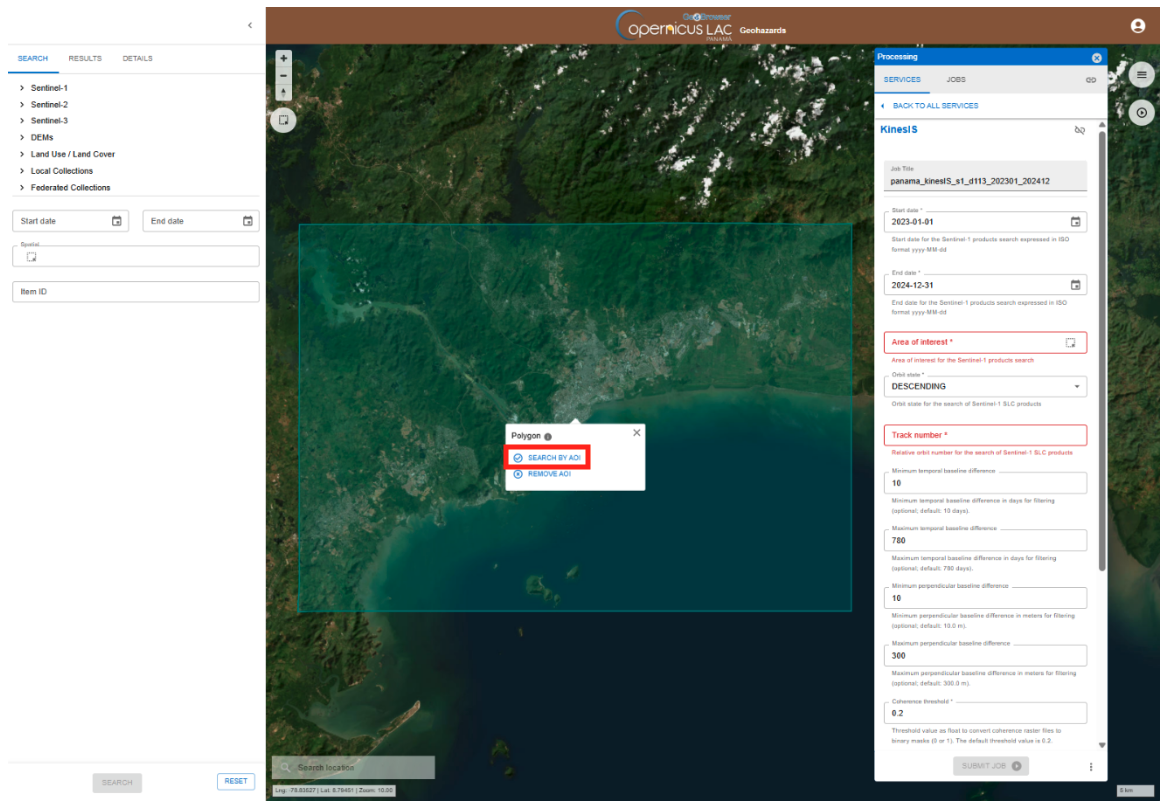
Once you finish drawing a polygon, a popup box will appear providing the options to SEARCH BY AOI or REMOVE AOI. Click on SEARCH BY AOI to employ this polygon in the search.
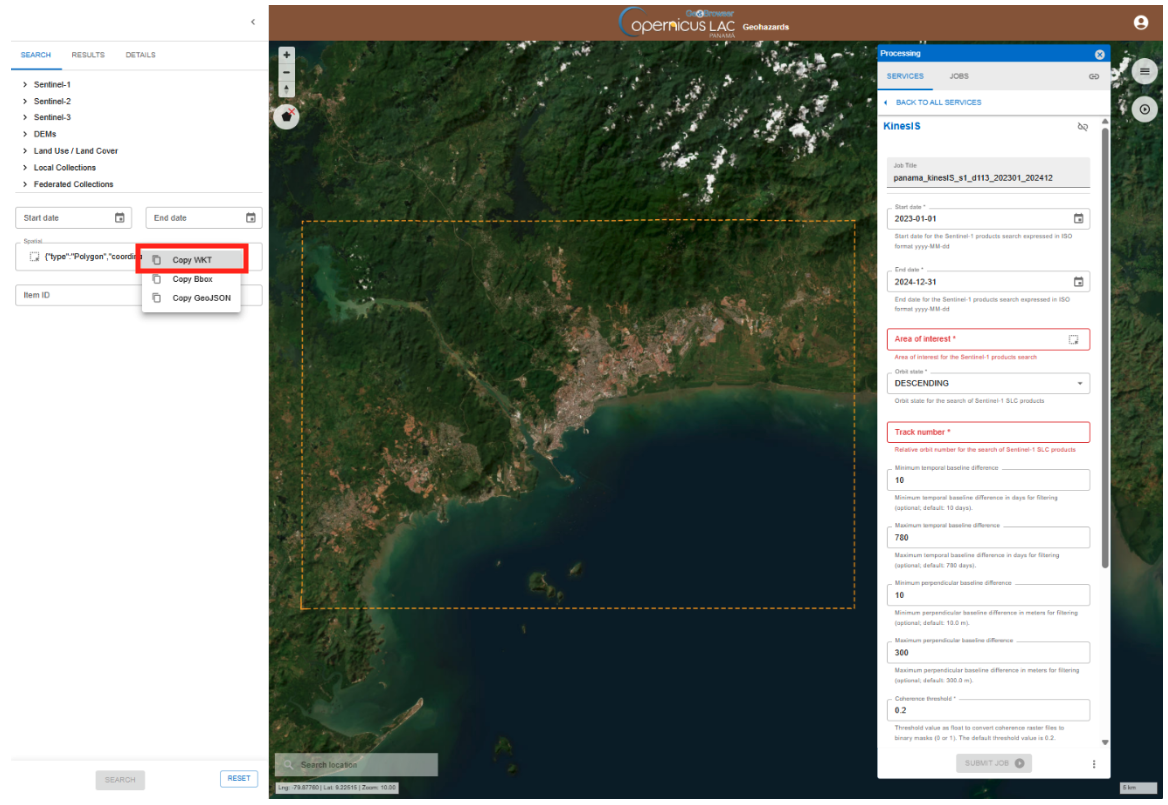
- After that the coordinates of your polygon will automatically appear in the Spatial field on the Search panel on the left.

- At this point you can now copy the WKT coordinates from the Spatial field by clicking on the Copy to clipboard icon and then on the Copy WKT option.
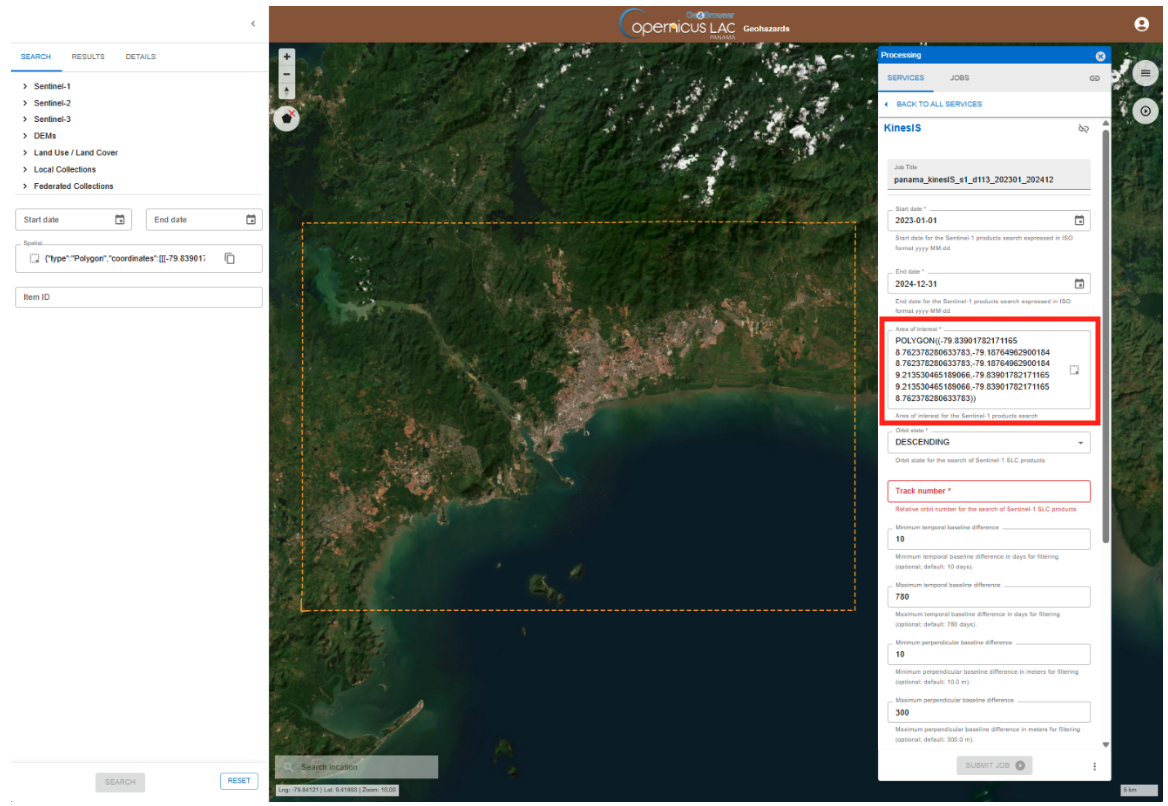
- Finally, you can paste the value into the Area of interest field in the SAR-FEM service form. After the paste you will get a WKT string like the one reported below.
POLYGON((-56.733 -29.547,-56.733 -28.502,-55.725 -28.502,-55.725 -29.547,-56.733 -29.547))
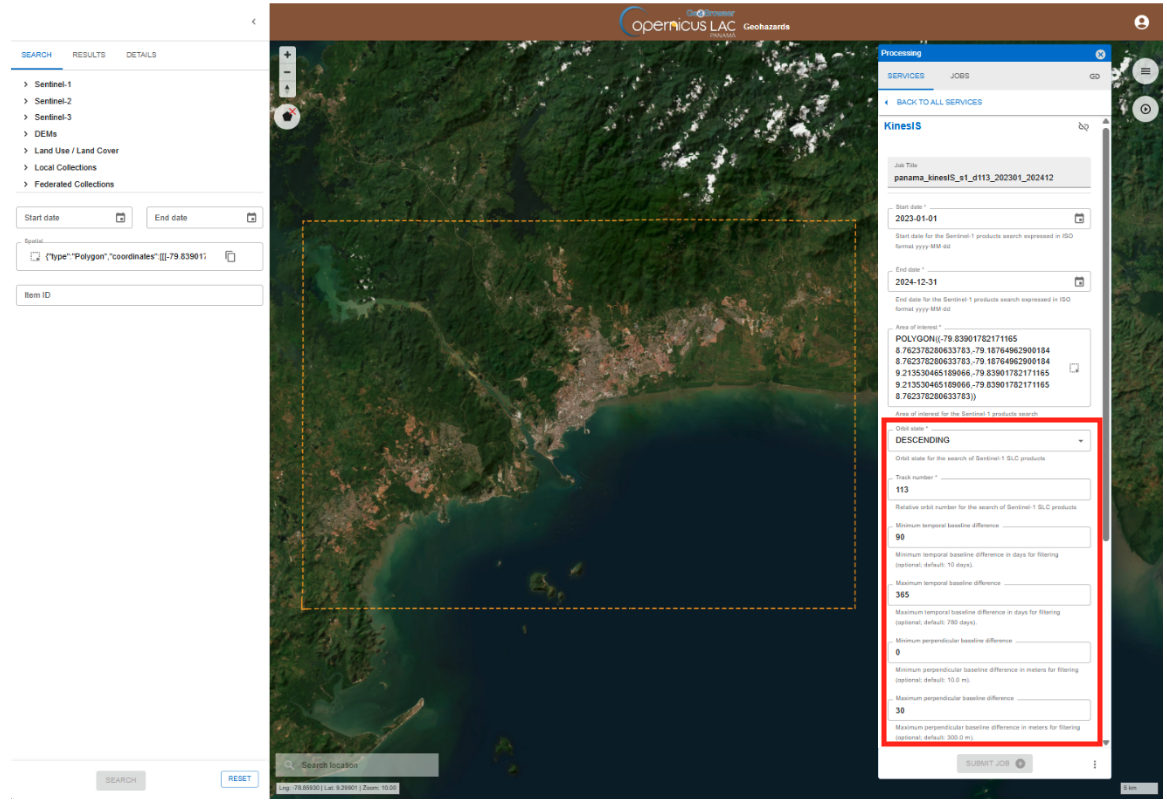
Orbit state
Here you shall specify the acquisition geometry of the Sentinel-1 data to be used in the analysis (Ascending or Descending).
Track number
Insert the Sentinel-1 relative orbit (track) number covering the Area of Interest.
Minimum temporal baseline
This parameter defines the minimum temporal separation (in days) allowed between interferometric image pairs. The default value is 12 days.
Hint
Using slightly higher values excludes interferometric pairs with very short temporal separation from the analysis, helping ensure that the selected differential interferograms, particularly when low motion rates are expected, contain a detectable deformation signal. The default value is 365 days.
Maximum temporal baseline
This parameter defines the maximum temporal separation (in days) allowed between interferometric image pairs.
Hint
By avoiding very high values, interferometric pairs with relatively shorter temporal separation are considered, helping reduce the effects of temporal decorrelation and improve the spatial coverage of the results.
Minimum perpendicular baseline
In this parameter you shall insert the minimum perpendicular baseline (in meters) allowed between interferometric image pairs. The default value is 0 meters.
Maximum perpendicular baseline
In this parameter you shall insert the maximum perpendicular baseline (in meters) allowed between interferometric image pairs. The default value is 50 meters.
Hint
For an interferometric mission such as Sentinel-1, perpendicular baselines are generally well constrained; therefore, users may keep the maximum perpendicular baseline parameter relatively low to reduce unnecessary interferometric pair combinations and processing time, while ensuring low residual topography-related phase contributions.
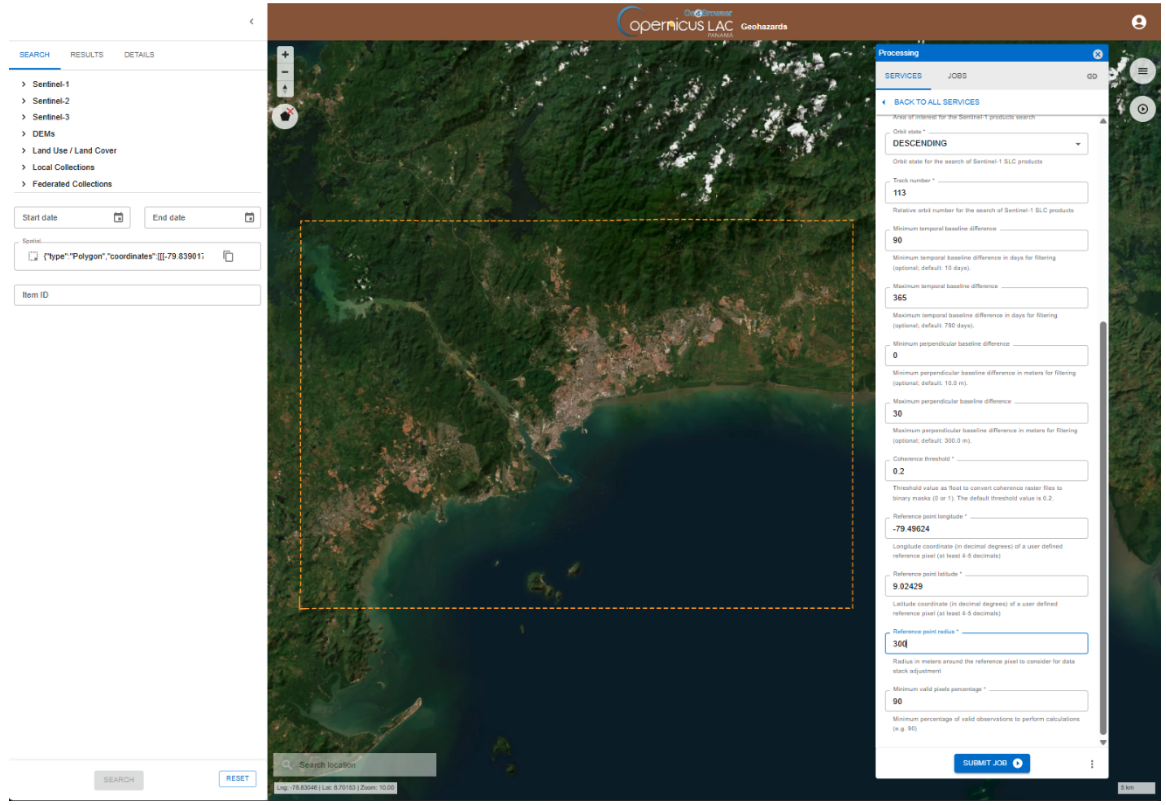
Coherence threshold
This parameter defines the minimum coherence value required for a pixel to be considered valid in the analysis. The default value is 0.3 meters.
Hint
Lowering the coherence threshold allows the inclusion of pixels with potentially unreliable motion estimates, while excessively increasing the threshold reduces the spatial coverage of the results.
Reference point longitude
Provide the longitude coordinate of the reference point used for calibration of the motion measurements.
Reference point latitude
Provide the latitude coordinate of the reference point used for calibration of the motion measurements.
Hint
The reference point should be selected within an area exhibiting long-term coherence, ensuring that the algorithm can identify reliable measurements to properly reference the dataset.
Reference point radius
Specify the radius (in meters) around the reference point within which pixels will be used for referencing the motion measurements.
Minimum valid pixel percentage
This parameter defines the minimum percentage of valid pixels required for the analysis to be performed. The default value is 90 percent.
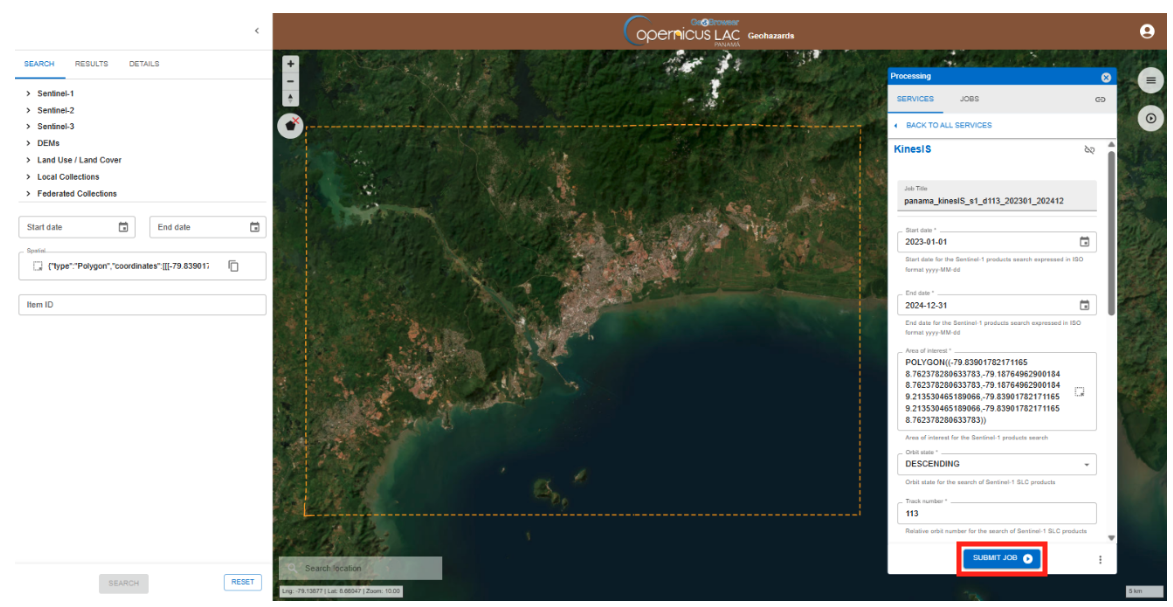
Run the job
After filling in all the required parameters, click SUBMIT JOB to start the service.
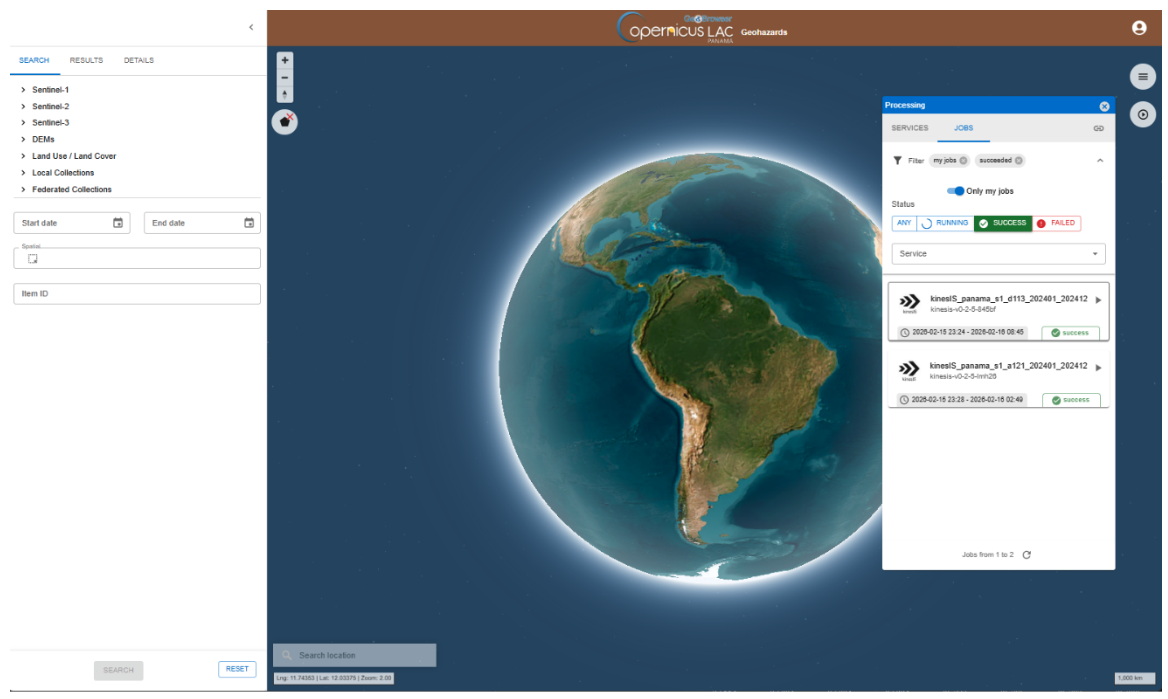
Once submitted, you will be automatically redirected to the JOBS tab, where you can view the list of all previously submitted jobs. Your newly created job will appear at the top of the list.
From this tab, you can monitor the progress of your job, which can have one of the following statuses: running, succeeded or failed.
Note
Service execution time depends on the AOI size, the observation period, and the number of interferometric pair combinations requested through user-defined parameters (e.g., temporal and perpendicular baseline thresholds). In this example, for an AOI of ~3600 km² and one year of Sentinel-1 data, using the current processing parameters, the processing time is approximately 9 hours.
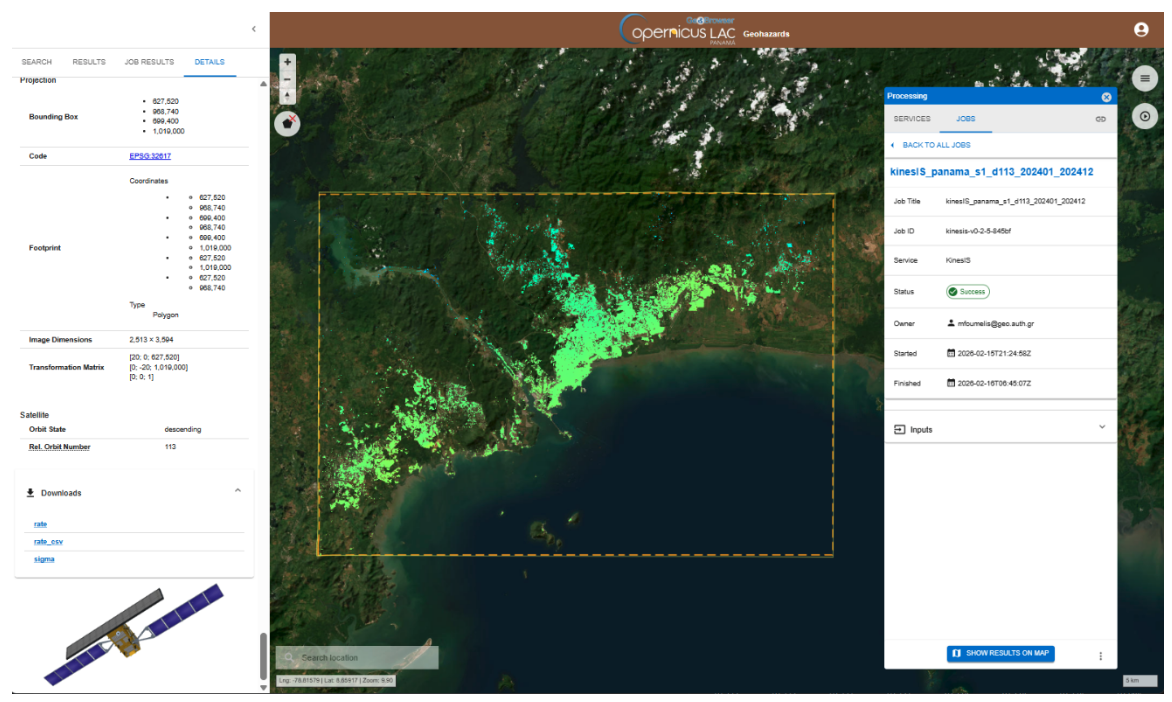
Results
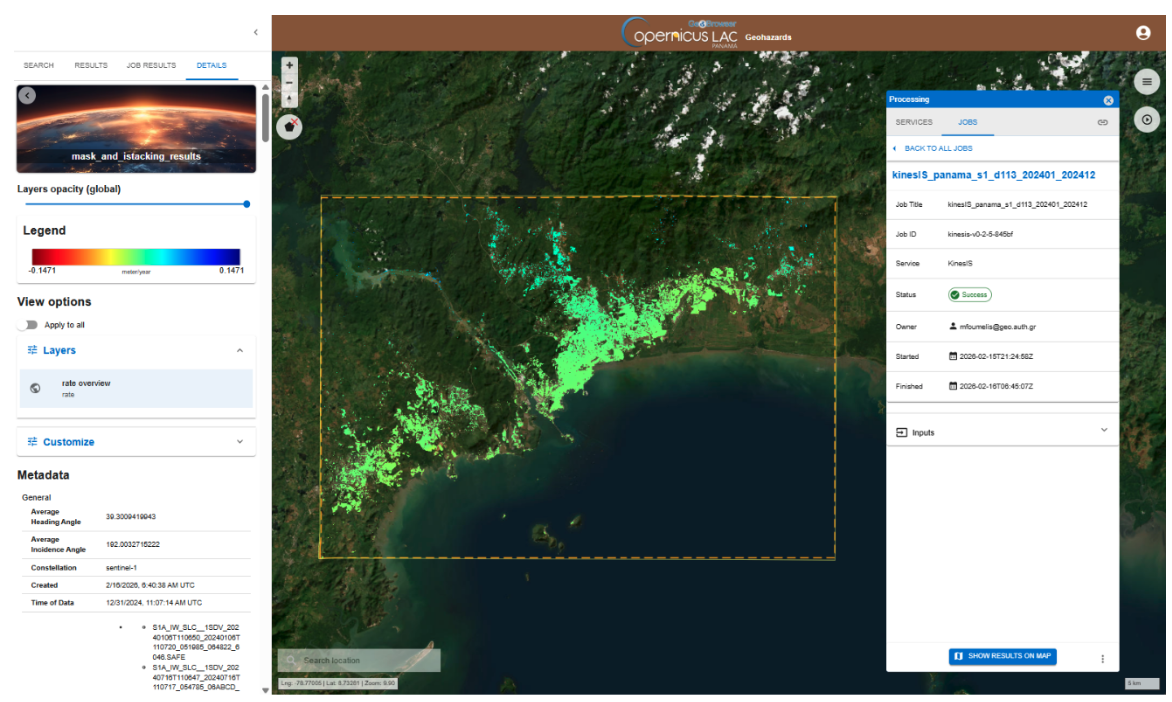
Once the job is successfully accomplished, under the job details click on the button SHOW RESULTS ON MAP located in the JOBS tab of the left panel.
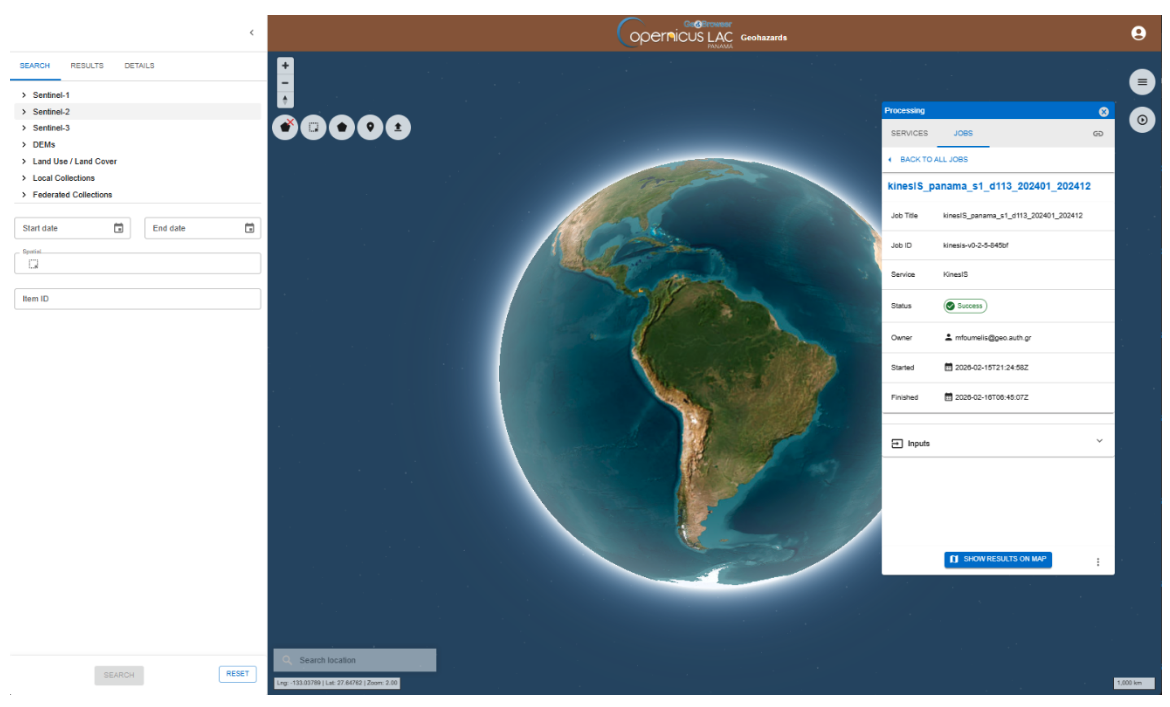
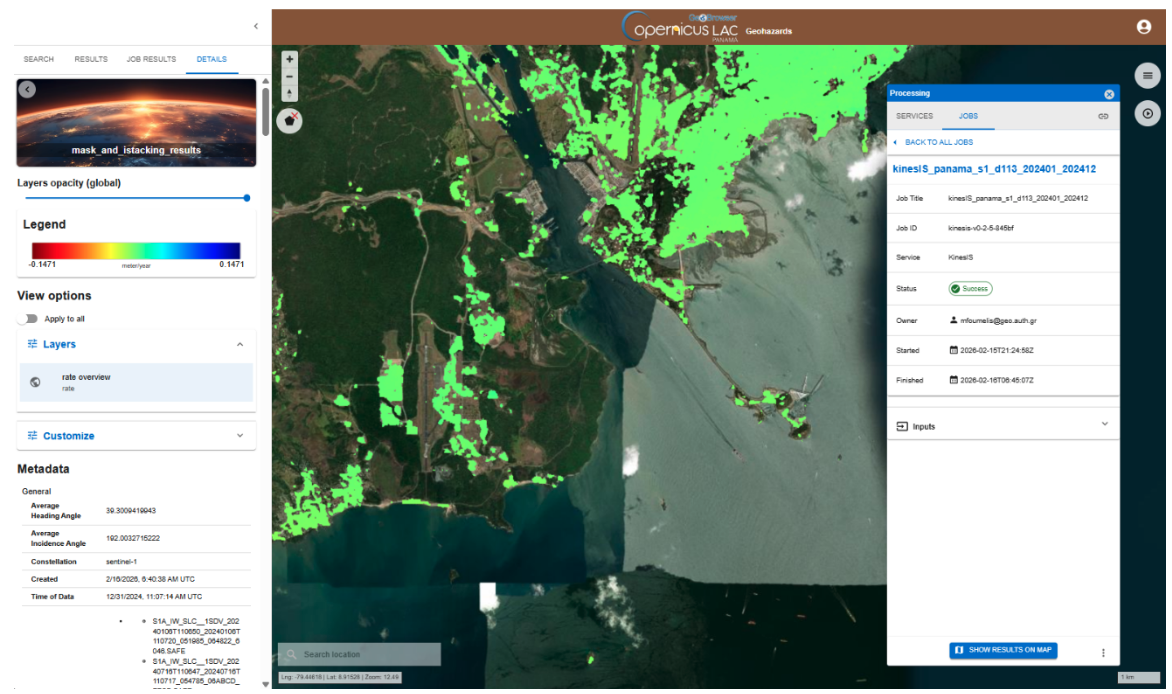
After that all the products generated by the service will be displayed on the map.
From the JOBS tab of the right panel, you can consult the input parameters employed in this job by clicking on the Input dropdown list button. Consult the Metadata available, regarding the input Sentinel-1 products employed by the service, the utilized DEM, extent of bounding box, etc.
From the DETAILS tab in the left panel it is also possible to:
-
set the opacity of the layer,
-
visualize the legend of the product,
-
under view options consult the render applied to the layer and, its histogram (when available), and apply a custom render,
-
download the product.
Hint
Do you want to see both the result and the underneath satellite imagery baselayer? Try using the Layers opacity (global) bar and set the opacity as 50% to better see for instance also the basemap layer.
Note
Aren’t you satisfied with the default render of the product available under Layers in the View options? You can customize it by clicking on Customize under View options in the left panel.
To download the product from the left panel click on the Downloads dropdown button and then on the hyperlink of the single asset.