kinesIS service specifications
![]()
Find kinesIS service tutorial here.
Service Description
The kinesIS service focuses on the generation of wide-area, pixel-based average motion rate maps along with corresponding uncertainty estimates, utilizing a time-series of SAR data based on the interferometric stacking technique. Through the platform interface, users are invited to specify the geographic extent of the analysis using integrated geobrowser selection tools, to select input satellite data covering the desired observation time period, and to define processing parameters.
The kinesIS terrain motion service focuses on the generation of wide-area, pixel-based average Line-of-Sight (LoS) motion rate maps along with corresponding uncertainty estimates, utilizing multi-temporal Copernicus Sentinel-1 SAR data processed through the interferometric stacking technique. Through the platform interface, users are invited to specify the geographic extent of the analysis using integrated geobrowser selection tools, to select input satellite data covering the desired observation time period, and to define processing parameters.
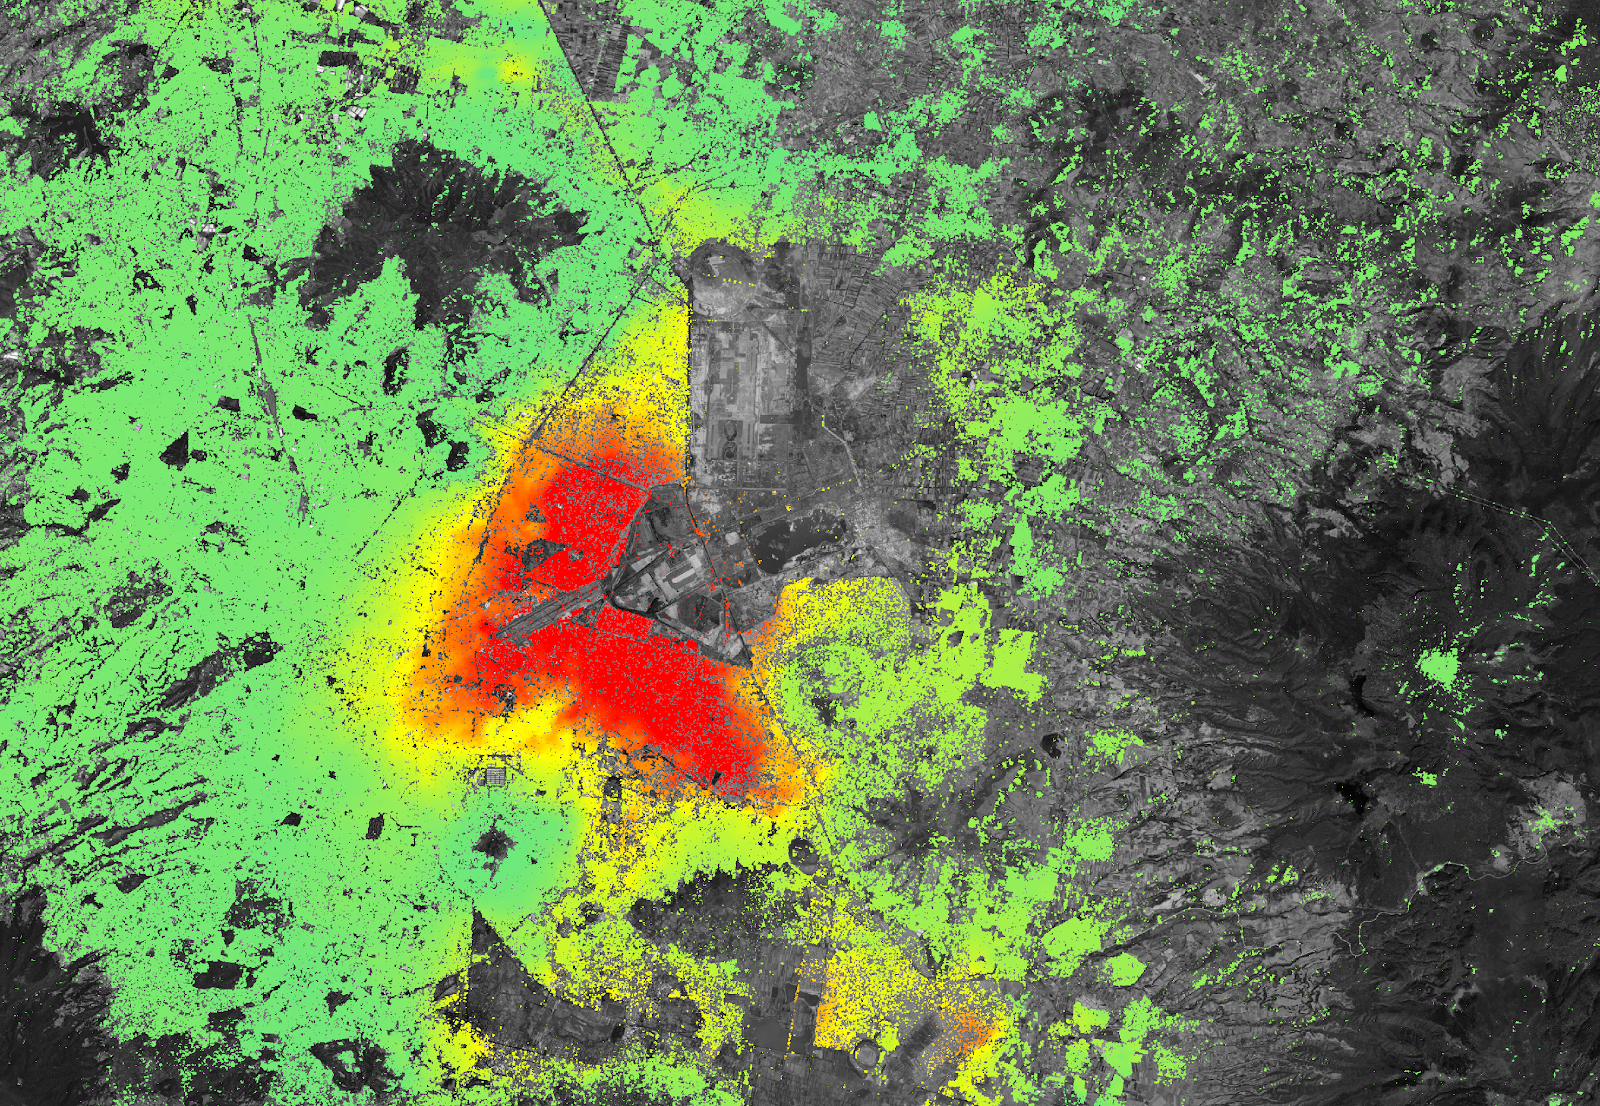
kinesIS involves the coherent averaging of multi-reference differential interferograms generated from a co-registered stack of Single Look Complex (SLC) SAR data1,2. By stacking these interferograms, the technique allows to enhance the signal-to-noise ratio (SNR), to suppress uncorrelated signal (i.e. various error sources), and to highlight surface motion trends that are consistent over the observation period.
Atmospheric effects, particularly delays caused by variations in tropospheric conditions, are a major source of noise in InSAR. Interferometric Stacking mitigates these signals through statistical averaging, as atmospheric contributions tend to vary randomly across interferograms 3. In areas with complex atmospheric conditions, stacking large numbers of interferograms reduces the influence of atmospheric delays, isolating the deformation signal.
The measurements’ uncertainty in kinesIS quantifies the reliability of the estimated motion rates.
Compared to other advanced techniques such as PSI or SBAS-like that provide both average terrain motion measurements and time-series, the IS method provides average terrain motion measurements, generally with a greater spatial density. To monitor deformation, terrain motion over time can be analyzed by properly segmenting the observation time period, allowing users to measure changes over time.
Workflow
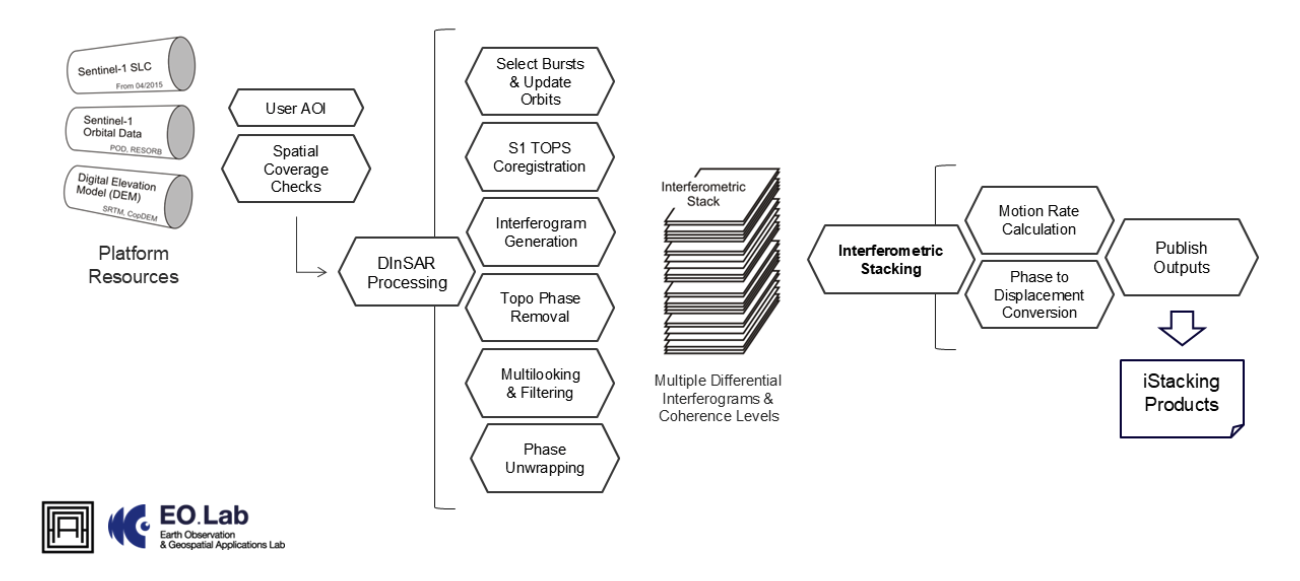
The schema shown in Figure 2 describes the high-level workflow of the kinesIS service.
The processing workflow consists of two main steps:
-
Step 1: Conventional DInSAR (Differential InSAR) processing for pairs of TOPSAR acquisitions, including preparation of input Single Look Complex (SLC) products (automatic concatenation, sub-swath merging etc.), co-registration, topographic phase removal, phase filtering and phase unwrapping.
-
Step 2: Unwrapped phases are then used to calculate the average motion rates and corresponding uncertainties for the specific observation period. Finally, the measurements are converted to a metric system (i.e. millimetres per year) and terrain geocoded.
Upon successful execution, the results are visualized within the platform and made available for download facilitating direct interpretation and use in subsequent processing chains.
Input
The following inputs are needed to run the kinesIS service:
Sentinel imagery
- Copernicus Sentinel-1 IW mode SLC images overlapping the Area of Interest (AOI), for the user defined period of interest.
Ancillary data:
-
DEM covering the input S1 imagery,
-
Precise orbits state vectors for Sentinel-1 acquisitions.
Parameters
The following parameters are needed to run the kinesIS service:
-
Start date: Start of observation period,
-
End date: End of observation period,
-
Area of Interest: Geographical region to be analysed,
-
Orbit state: Sentinel-1 acquisition geometry
-
Track number: Sentinel-1 satellite track covering the AOI
-
Minimum temporal baseline: Minimum temporal separation between interferometric pairs
-
Maximum temporal baseline: Maximum temporal separation between interferometric pairs
-
Minimum perpendicular baseline: Minimum perpendicular baseline between interferometric pairs
-
Maximum perpendicular baseline: Maximum perpendicular baseline between interferometric pairs
-
Coherence threshold: Minimum coherence required for valid pixel selection
-
Reference point longitude: Longitude coordinate of the reference point
-
Reference point latitude: Latitude coordinate of the reference point
-
Reference point radius: Radius around the reference location
-
Minimum valid pixel percentage: Minimum percentage of valid pixels required to perform the analysis
Output
The kinesIS service will produce the following outputs:
-
Average terrain motion rates,
-
Uncertainties of terrain motion rates,
-
Multitemporal coherence levels map.
Specifications of products:
-
Definition: Motion rates and corresponding uncertainties in mm/year; Coherence level [0-1]
-
Data type: Geospatial layers
-
Format: Raster files (COG format)
-
Spatial resolution: >20m
-
Frequency: Obtained on demand
-
Spatial coverage: The service is available for the whole LAC region.
-
Temporal coverage: Depending on the revisit time of Sentinel-1 satellite units
-
Constraints: Availability of Sentinel-1 acquisitions; measurements represent LoS motion
Service Provider
The service is developed by AUTh.
References
-
Foumelis, M., 2012. Human induced groundwater level declination and physical rebound in northern Athens Basin (Greece) observed by multi-reference DInSAR techniques. IGARSS 2012, 4p, doi:10.1109/IGARSS.2012.6351436 ↩
-
Foumelis, M., Raucoules, D., Colas, B. & de Michele, M., 2019. On the effect of interferometric pairs selection for measuring fast moving landslides. International Geoscience and Remote Sensing Symposium (IGARSS 2019), Yokohama, Japan, 28 July - 2 August ↩
-
Strozzi T, Wegmüller U, Werner C and Wiesmann A (2000), "Measurement of slow uniform surface displacement with mm/year accuracy", In Proc. IEEE Int. Geosci. Remote Sens. Symp.. Vol. 5, pp. 2239-2241. IEEE, Piscataway, NJ, United States. ↩