Burned Area Severity service specifications
Service Description
The Burned Area Severity (BAS) on-demand service takes as input a pair of calibrated optical datasets containing nir and swir22 spectral assets and estimates the severity of burnt areas. It provides as output a raster with a color gradient based on RBR value representing burnt area severity.
The burn severity describes how the fire intensity affects the functioning of the ecosystem in the area that has been burnt. The observed effects often vary within the area and between different ecosystems (Keeley, 2009)1. The burn severity can also be described as the degree to which an area has been altered or disrupted by the fire2.
The Burned Area Severity Analysis methodology integrated into this service is based on the Normalized Burn Ratio (NBR) index (Key and Benson, 2006)3 and its derivatives: the delta Normalized Burn Ratio (dNBR) from Miller and Thode, 20144, and the Relativized Burn Ratio (RBR) from Parks et al., 20145. Such indexes are described below.
Normalized Burn Ratio and delta Normalized Burn Ratio
The Normalized Burn Ratio (NBR) index developed by Key and Benson, 20063 is defined as the normalized difference between the nir and swir22:
The delta Normalized Burn Ratio (dNBR) from Miller and Thode (2014) is defined as:
Relativized Burn Ratio
The Relativized Burn Ratio (RBR) from Parks et al.,20145 is defined as:
Also, the processor generates from the pair of input optical images a couple of Shortwave infrared (swir22, nir, red) RGB composites, for both pre- and post-event images.
Workflow
The first step of the BAS processing service creates a collocated stack between the pre and post-event acquisitions of the assets red, nir and swir22.
This collocated stack covers the common area between the pre and the post-event acquisitions.
In case of inputs with different spatial resolution, the higher resolution is used.
The second step applies the band expressions listed below:
The third step generates an RGB composite with:
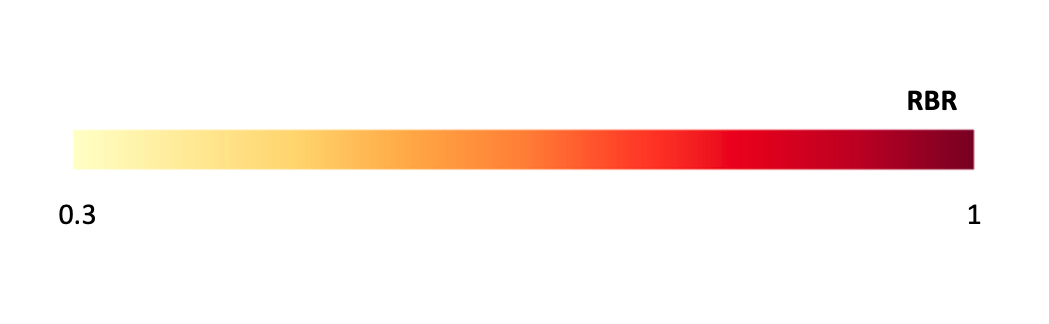
After the computation of RBR, the burned area severity is shown in the map using a custom render applied to the RBR asset. This render is considering only pixels satisfying the following condition: RBR>=0.3. After the normalization to the 8-bit range, the color representation of the RBR index is made using a pre-defined graded yellow-red color bar (YlOrRd Matplotlib color palette).
The BAS legend is shown below.
Input
The BAS processor requires in input a pair of Calibrated Datasets products from multispectral EO data. Both Optical Calibrated Datasets shall include the following single band assets:
-
red,
-
nir,
-
swir22.
The pair is typically made by pre- and post-event datasets from the Sentinel-2 mission.
Parameters
The BAS service requires a specified number of mandatory and optional parameters. All service parameters are listed in the below Table 1.
| Parameter | Description | Required | Default value |
|---|---|---|---|
| Post-event optical calibrated dataset | Post-event Optical calibrated dataset with red, nir and swir22 assets | YES | |
| Pre-event optical calibrated dataset | Pre-event Optical calibrated dataset with red, nir and swir22 assets | YES | |
| Area of Interest | Area of interest expressed in WKT | NO |
Table 1 - Parameters of the BAS service.
Output
The BAS processor generates the following products:
-
Co-located single band TOA/BOA reflectance assets (
red,nir,swir22) from the two input Calibrated Datasets. -
Single band
NBRindex (pre-event), -
Single band
NBRindex (post-event), -
Single band
dNBRindex, -
Single band
RBRindex.
BAS Product Specifications can be found in the below tables.
| Attribute | Value / description |
|---|---|
| Description | Co-located single band assets derived from pre- and post-event datasets |
| File Name | swir16, swir22, nir |
| Geospatial Data Type | Raster |
| Data Type | Float32 |
| Band | 1 |
| Format | COG |
| Projection | Native |
| Long Name | Normalized Burn Ratio pre-event |
|---|---|
| Short Name | nbr_pre |
| Description | Normalized difference between NIR and SWIR22 bands of the pre-event acquisition |
| Processing Level | L1 / L2 |
| Data Type | Float32 |
| Band | Single |
| Format | COG |
| Projection | EPSG:4326 - WGS84 |
| Units | N/A |
| Valid Range | [-1 , 1] |
| Fill Value | N/A |
| Long Name | Normalized Burn Ratio post-event |
|---|---|
| Short Name | nbr_post |
| Description | Normalized difference between NIR and SWIR22 bands of the post-event acquisition |
| Processing Level | L1 / L2 |
| Data Type | Float32 |
| Band | Single |
| Format | COG |
| Projection | EPSG:4326 - WGS84 |
| Units | N/A |
| Valid Range | [-1 , 1] |
| Fill Value | N/A |
| Long Name | Delta Normalized Burn Ratio |
|---|---|
| Short Name | dnbr |
| Description | Difference between the pre and post Normalized Burn Ratio |
| Processing Level | L1 / L2 |
| Data Type | Float32 |
| Band | Single |
| Format | COG |
| Projection | EPSG:4326 - WGS84 |
| Units | N/A |
| Valid Range | [-2 , 2] |
| Fill Value | N/A |
| Long Name | Relativized Burn Ratio |
|---|---|
| Short Name | rbr |
| Description | Relativized Burn Ratio using the pre and post Normalized Burn Ratio |
| Processing Level | L1 / L2 |
| Data Type | Float32 |
| Band | Single |
| Format | COG |
| Projection | EPSG:4326 - WGS84 |
| Units | N/A |
| Valid Range | [-2 , 2] |
| Fill Value | N/A |
Service Provider
The service is developed by Terradue.
References
-
Keeley, J. E. (2009), "Fire intensity, fire severity and burn severity: A brief review and suggested usage", International Journal of Wildland Fire, 18(1), 116–126. Available at: https://pubs.er.usgs.gov. ↩
-
Key, C. H. and Benson, N. C. (2006), “Landscape Assessment (LA): Sampling and Analysis Methods”, USDA Forest Service Gen Tech. Rep RMRS-GTR-164-CD. FIREMON Fire effects monitoring and inventory System. Available at: https://www.fs.usda.gov. ↩↩
-
Miller J. and Thode A. (2007), “Quantifying burn severity in a heterogeneous landscape with a relative version of the delta Normalized Burn Ratio (RdNBR)”, Remote Sensing of Environment, 109, 66-80. DOI: 10.1016/j.rse.2006.12.006. ↩
-
Parks S. A., Dillon G. K., Miller C. A. (2014) "A New Metric for Quantifying Burn Severity: The Relativized Burn Ratio" Remote Sens. 6, no. 3: 1827-1844. DOI: 10.3390/rs6031827. ↩↩