World Settlement Footprint Imperviousness layer specifications
Service Description
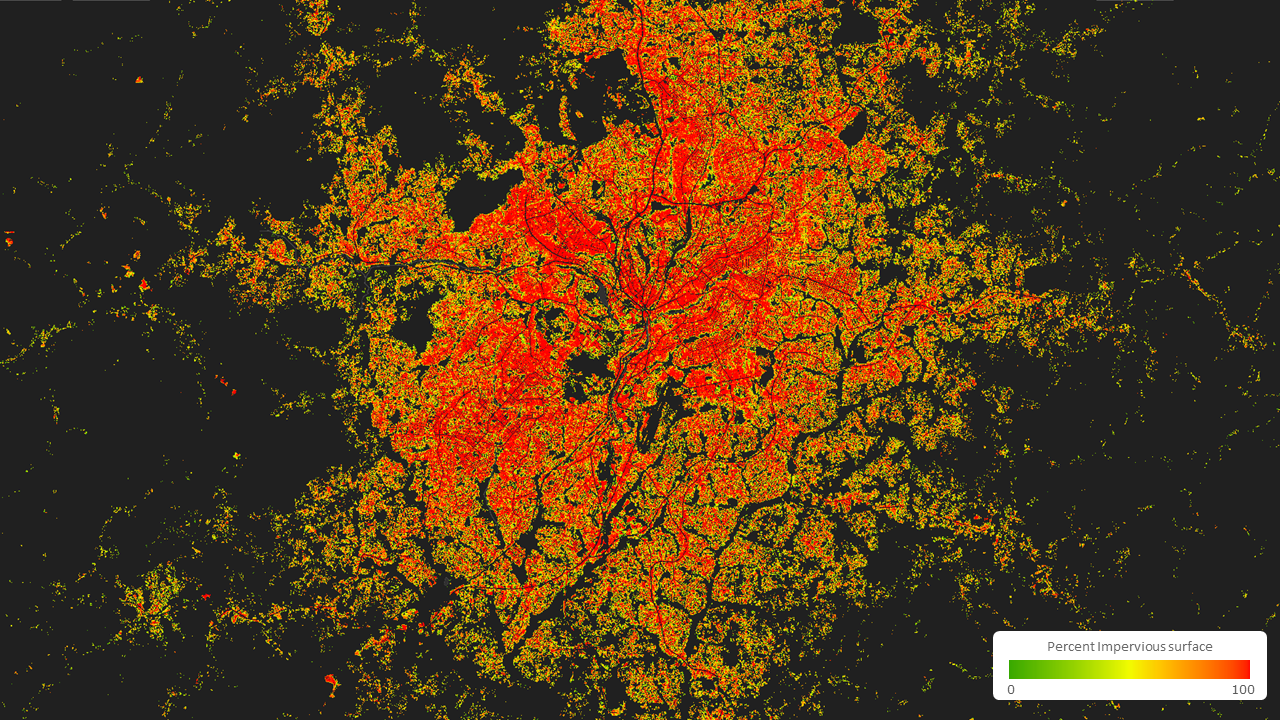
The World Settlement Footprint Imperviousness (WSF Imperviousness) layer is derived from the DLR’s WSF Imperviousness and estimates the Percent Impervious Surface (PIS) for the pixels iteratively identified as settlements in the WSF Tracker, which outlines biannual settlement extent at 10m spatial resolution from July 2016 onwards. The layer leverages the strong inverse relationship between impervious surfaces (such as roads and buildings) and vegetation 1, quantified by the Normalized Difference Vegetation Index (NDVI) —a widely used spectral index characterizing vegetation density and health 2. Higher NDVI values indicate dense, healthy vegetation, corresponding to lower imperviousness within built-up pixels. To estimate the PIS, the service calculates the 95th percentile NDVI from Sentinel-2 (S2) imagery as a robust proxy for vegetation cover and correlates these values with impervious surface data derived from OpenStreetMap (OSM) 3 and Overture Maps 4.
The WSF Imperviousness Service is especially beneficial for a variety of applications, including:
-
Flood Risk Assessment: Supporting the identification of areas with low infiltration capacity and high runoff potential, crucial for urban flood modelling and infrastructure planning.
-
Urban Growth Characterization: Complementing settlement extent data by indicating the intensity and density of built-up areas over time.
-
Environmental Monitoring: Enabling the assessment of land sealing and its impact on ecological processes such as water retention, vegetation loss, and surface temperature regulation.
Workflow
The WSF Imperviousness relies on a multi-step workflow to generate the PIS for settlement areas:
-
Image Collection:
- S2 imagery is collected for each 12-month period. Temporal statistics are computed over a shifting 12-month window, updated every 6 months, to capture changes in impervious surfaces over time and enable continuous monitoring.
-
Feature Extraction:
- The NDVI temporal 95th percentile is derived from all S2 scenes acquired between the target date t and t−1 year. This metric serves as a robust proxy for vegetation cover, minimizing the influence of seasonal variation and cloud-related artefacts, and enabling distinction between vegetated and impervious areas.
-
Training Sample Generation:
- Training samples are derived from OSM and Overture Maps by identifying impervious features such as buildings and roads. These vector layers are rasterized at 10m resolution, and each pixel is assigned a value corresponding to the fraction of its area covered by impervious surfaces, yielding a continuous-valued reference layer. The corresponding NDVI 95th percentile values are extracted from S2 data for these pixels, resulting in a spatially aligned dataset of paired NDVI–imperviousness values to be used for model training.
-
SVR (Support Vector Regression) Modeling:
- An ensemble of SVR models 5 is trained on distinct subsets of the NDVI–imperviousness training data to capture variability in the vegetation–sealing relationship across different geographic and environmental conditions. This ensemble strategy enhances the model’s robustness and generalization capacity, especially in heterogeneous urban landscapes. The trained ensemble is then applied to predict the PIS for all pixels identified as settlements in the WSF Tracker, generating a continuous PIS map for each time step.
-
Temporal Consistency:
- A temporal consistency rule is applied across the sequence of PIS maps to ensure physically plausible evolution of imperviousness within settlement pixels. Specifically, the PIS value of a pixel is allowed to remain stable or increase over successive time steps, reflecting the cumulative and generally irreversible nature of surface sealing in urban growth. Decreases in PIS are only accepted if they meet defined thresholds indicating meaningful and validated land cover change (e.g., vegetation regrowth or surface transformation). This step reduces artefacts caused by noise, misclassification, or seasonal anomalies and ensures a coherent temporal progression aligned with expected urban dynamics.
Input
The following inputs are needed to generate this layer:
Sentinel imagery:
- Sentinel-2 L2A: One year of imagery is used for each update. The 95th percentile of NDVI is computed over a shifting 12-month window, capturing the maximum vegetation signal while mitigating seasonal and cloud-related artefacts. This temporal window is updated every 6 months to match the WSF Tracker time steps.
Ancillary data:
-
OSM: Provides building footprint data and road network information used to identify impervious surfaces and support training sample generation.
-
Overture Maps: Supplies additional vector data for buildings and roads, enhancing coverage and improving sample diversity.
Parameters
The following parameters are needed to generate this layer:
- Area of Interest (AOI): the geographical region to be analyzed.
Output
The WSF Imperviousness dataset consists of one map per WSF Tracker time step:
-
Definition: The output maps represent the PIS for the pixels identified as settlements in the WSF Tracker. Each pixel contains a continuous value between 0 and 100, indicating the estimated proportion of impervious surface within that 10m grid cell.
-
Data type: Geospatial layers.
-
Format: Raster file.
-
Spatial resolution: 10m.
-
Frequency: Biannual updates, aligned with the WSF Tracker.
-
Spatial coverage: Global.
-
Temporal coverage: From July 2016 to present.
-
Constraints: Availability of high-quality S2 imagery and adequate coverage of ancillary datasets (OSM, Overture Maps) for the generation of reliable training samples.
Service Provider
The layer is developed by DLR.
Back to Exposure Mapping services
References
-
Weng, Q. (2007). Remote sensing of impervious surfaces: An overview. International Journal of Remote Sensing, 28(6), 1031–1046. https://doi.org/10.1080/01431160600930492. ↩
-
Tucker, C. J. (1979). Red and photographic infrared linear combinations for monitoring vegetation. Remote Sensing of Environment, 8(2), 127–150. https://doi.org/10.1016/0034-4257(79)90013-0. ↩
-
OpenStreetMap contributors. (2025). OpenStreetMap: Planet dump. Distributed under the Open Data Commons Open Database License (ODbL). Retrieved from https://www.openstreetmap.org. ↩
-
Overture Maps Foundation. (2025). Overture Maps Buildings Layer – Version 2025-02-01. Released under the Community Data License Agreement – Permissive. Available at: https://overturemaps.org/. ↩
-
Smola, A. J., & Schölkopf, B. (2004). A tutorial on support vector regression. Statistics and Computing, 14(3), 199–222. https://doi.org/10.1023/B:STCO.0000035301.49549.88. ↩