Population Distribution service specifications
Service Description
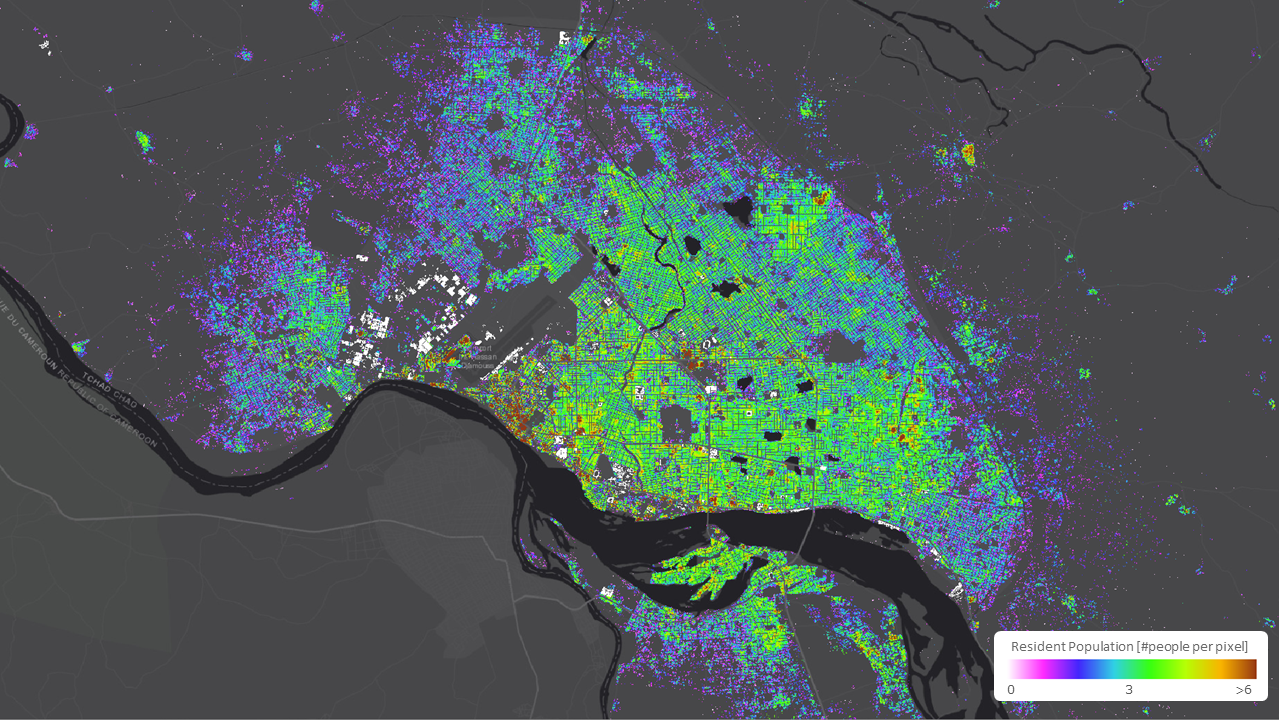
The Population Distribution (PD) service relies on DLR’s WSF Population to generate high-resolution estimates of resident population density at 10m spatial resolution, available in both raster and vector formats. It builds on the World Settlement Footprint (WSF) suite, specifically the WSF Tracker, WSF Imperviousness, and WSF 3D layers, to redistribute population figures within built-up areas based on structural characteristics such as impervious surface density and building height.
Traditional population datasets are typically aggregated at administrative levels and lack the spatial granularity needed for detailed urban analysis. In contrast, this service applies a dasymetric mapping approach 1, redistributing population counts across built-up pixels using a combination of Percent Impervious Surface (PIS)—derived from Sentinel-2 (S2) imagery—and building height—estimated from GLO-30 2 and AW3D30 DEMs 3. This method captures intra-urban variation and aligns population estimates with the physical structure of the urban fabric.
Population figures are sourced from national statistical offices at the finest available disaggregation level. Where data are available for multiple years, polynomial interpolation is used to produce 6-monthly population estimates from July 2016 onward. These are harmonized with the 2024 UN World Population Prospects (medium-variant scenario) 4 to ensure temporal consistency. In countries lacking subnational data, redistribution is performed using national-level totals.
Non-residential areas are excluded using a dedicated OpenStreetMap (OSM)-based mask 5, and additional datasets—such as Google Open Buildings 2.5D 6 and EUBUCCO 7—are integrated to account for newer constructions not reflected in legacy elevation sources.
The service provides:
-
A raster product representing population density (people per pixel) across settlement areas for each WSF Tracker time step.
-
A vector product reporting total population per building footprint, based on aggregated raster values using Google Open Buildings and OSM geometries.
The Population Distribution Service supports a wide range of applications, including:
-
Urban planning and infrastructure design.
-
Disaster risk and exposure modelling.
-
Demographic monitoring and policy support.
Workflow
The Population Distribution Service follows a dual-path workflow to produce both raster and vector population estimates, using structural characteristics of the built environment and optionally integrating user-supplied population figures.
-
Population Data Acquisition and Harmonization:
-
Population data are gathered from national statistical offices at the finest available administrative level.
-
Where multi-year data are available, polynomial interpolation is applied to produce 6-month estimates from July 2016 onward.
-
All estimates are aligned with UN World Population Prospects 2024 (medium-variant scenario) to ensure consistency.
-
Alternatively, users may provide their own population data for specific Areas of Interest (AOIs), enabling tailored outputs.
-
-
Raster Path: Pixel-Based Dasymetric Mapping:
-
Settlement extent is defined by the WSF Tracker at each 6-month time step.
-
Percent Impervious Surface (PIS) and building height are derived from the WSF Imperviousness and WSF3D layers, respectively.
-
Non-residential pixels are excluded using a 10m-resolution OSM-based mask.
-
Within each administrative unit \(U\) with total population \(P_U\), the population density for pixel is derived using a combined imperviousness \((PIS)\) × building height \((BH)\) weighting scheme:
\[ P_p = P_U \cdot \frac{PIS_p}{\sum_{i \in U} PIS_i} \cdot \frac{BH_p}{\sum_{i \in U} BH_i} \] -
This yields a 10m-resolution raster map of population density per WSF tracker time step.
-
-
Vector Path: Building-Based Volume Dasymetric Mapping:
-
Building footprints are sourced from Google Open Buildings and OSM.
-
For each footprint, building height is obtained from the WSF3D raster and combined with footprint area to estimate building volume.
-
A non-residential building mask is applied using OSM tags to filter out unsuitable features.
-
Within each administrative unit \(U\) with total population \(P_U\), the population density for building is derived using a combined area \((A)\) × building height \((BH)\) weighting scheme:
\[ P_b = P_U \cdot \frac{A_b}{\sum_{i \in U} A_i} \cdot \frac{BH_b}{\sum_{i \in U} BH_i} \] -
This results in a vector layer containing total estimated population per building.
-
Input
The following inputs are needed to run the service:
Population data:
-
Official census or population estimates from national statistical offices, preferably disaggregated at ADM0 to ADM2 levels.
-
UN World Population Prospects 2024 (medium-variant scenario), used for temporal harmonization and extrapolation.
-
User-provided population figures (optional): Users may supply total population counts for custom Areas of Interest (AOIs), replacing or refining the default input data.
Settlement extent:
- WSF Tracker: Provides the built-up area mask for each 6-month time step starting from July 2016.
Built environment indicators:
-
WSF Imperviousness: Used to estimate the Percent Impervious Surface (PIS) of settlement pixels.
-
WSF 3D: Provides building height estimates used in both raster-based weighting and volume estimation for vector outputs.
Building footprints (for vector path):
-
Google Open Buildings: Primary source of individual building footprints for vector population assignment.
-
OSM: Used to complement Google’s coverage and provide additional footprint geometries.
Non-residential mask:
- OSM-derived land use and building tags, rasterized at 10m resolution to exclude non-residential areas or buildings from the redistribution process.
Parameters
The following parameters are needed to run the service:
-
Area of Interest (AOI): The geographical region to be analysed. This can be defined as a polygon or bounding box.
-
Reference time step: The 6-month period for which population density is to be estimated (e.g., January 2020, July 2023).
-
Population source (optional): Specification of whether to use default population data (national statistics + UN WPP) or user-provided figures for the selected AOI.
Output
The service will produce two types of outputs:
Raster product – Population density per pixel
-
Definition: A raster layer representing the estimated number of residents per 10m pixel within the settlement extent defined by the WSF Tracker.
-
Data type: Geospatial raster layer.
-
Format: GeoTIFF.
-
Spatial resolution: 10m.
-
Frequency: Biannual, aligned with WSF Tracker time steps.
-
Spatial coverage: Global, within settlement areas.
-
Temporal coverage: From July 2016 to present (based on available population inputs).
-
Constraints: Accuracy depends on the quality of population statistics, completeness of imperviousness and building height inputs, and OSM coverage.
Vector product – Population per building footprint
-
Definition: A vector layer reporting the estimated total number of residents per building, derived via volume-based dasymetric mapping using building footprint geometries and building height data.
-
Data type: Geospatial vector layer (polygon-based).
-
Format: GeoPackage or Shapefile.
-
Spatial resolution: Building-level.
-
Frequency: On demand, aligned with selected population reference year or time step.
-
Spatial coverage: Limited to areas covered by Google Open Buildings and OSM.
-
Temporal coverage: Reflects the most recent available WSF3D and building footprint data.
-
Constraints: Dependent on footprint coverage and building height accuracy; limited by input data currency and completeness.
Service Provider
The service is developed by DLR.
Back to Exposure Mapping services
References
-
Leyk, S., et al. (2019): The spatial allocation of population: a review of large‐scale gridded population data products and their fitness for use. Earth Syst. Sci. Data, 11, 1385–1409. ↩
-
Copernicus DEM – Global Digital Elevation Model - COP-DEM_GLO-30 https://doi.org/10.5270/ESA-c5d3d65. ↩
-
JAXA. (2019). ALOS World 3D - 30m (AW3D30). Earth Observation Research Center (EORC), Japan Aerospace Exploration Agency. Retrieved from https://www.eorc.jaxa.jp/ALOS/en/aw3d30/. ↩
-
United Nations DESA/Population Division. (2024). World Population Prospects 2024. Retrieved from https://population.un.org/wpp/. ↩
-
OpenStreetMap contributors. (2025). OpenStreetMap: Planet dump. Distributed under the Open Data Commons Open Database License (ODbL). Retrieved from https://www.openstreetmap.org. ↩
-
Google. (2024). Open Buildings 2.5D Dataset. AI-generated building height estimates derived from Sentinel-2 imagery. Retrieved from https://sites.research.google/open-buildings/. ↩
-
Gamba, M., Venerandi, A., Perino, S., & Biljecki, F. (2023). EUBUCCO v0.1: European Building stock Characteristics in a Common and Open database for 200+ million individual buildings. Scientific Data, 10, 127. https://doi.org/10.1038/s41597-023-01997-0. ↩